Financial Accounts of the United States - Z.1
Recent Developments RSS Data Download
The recent developments discussed below refer to data through June 30, 2023.
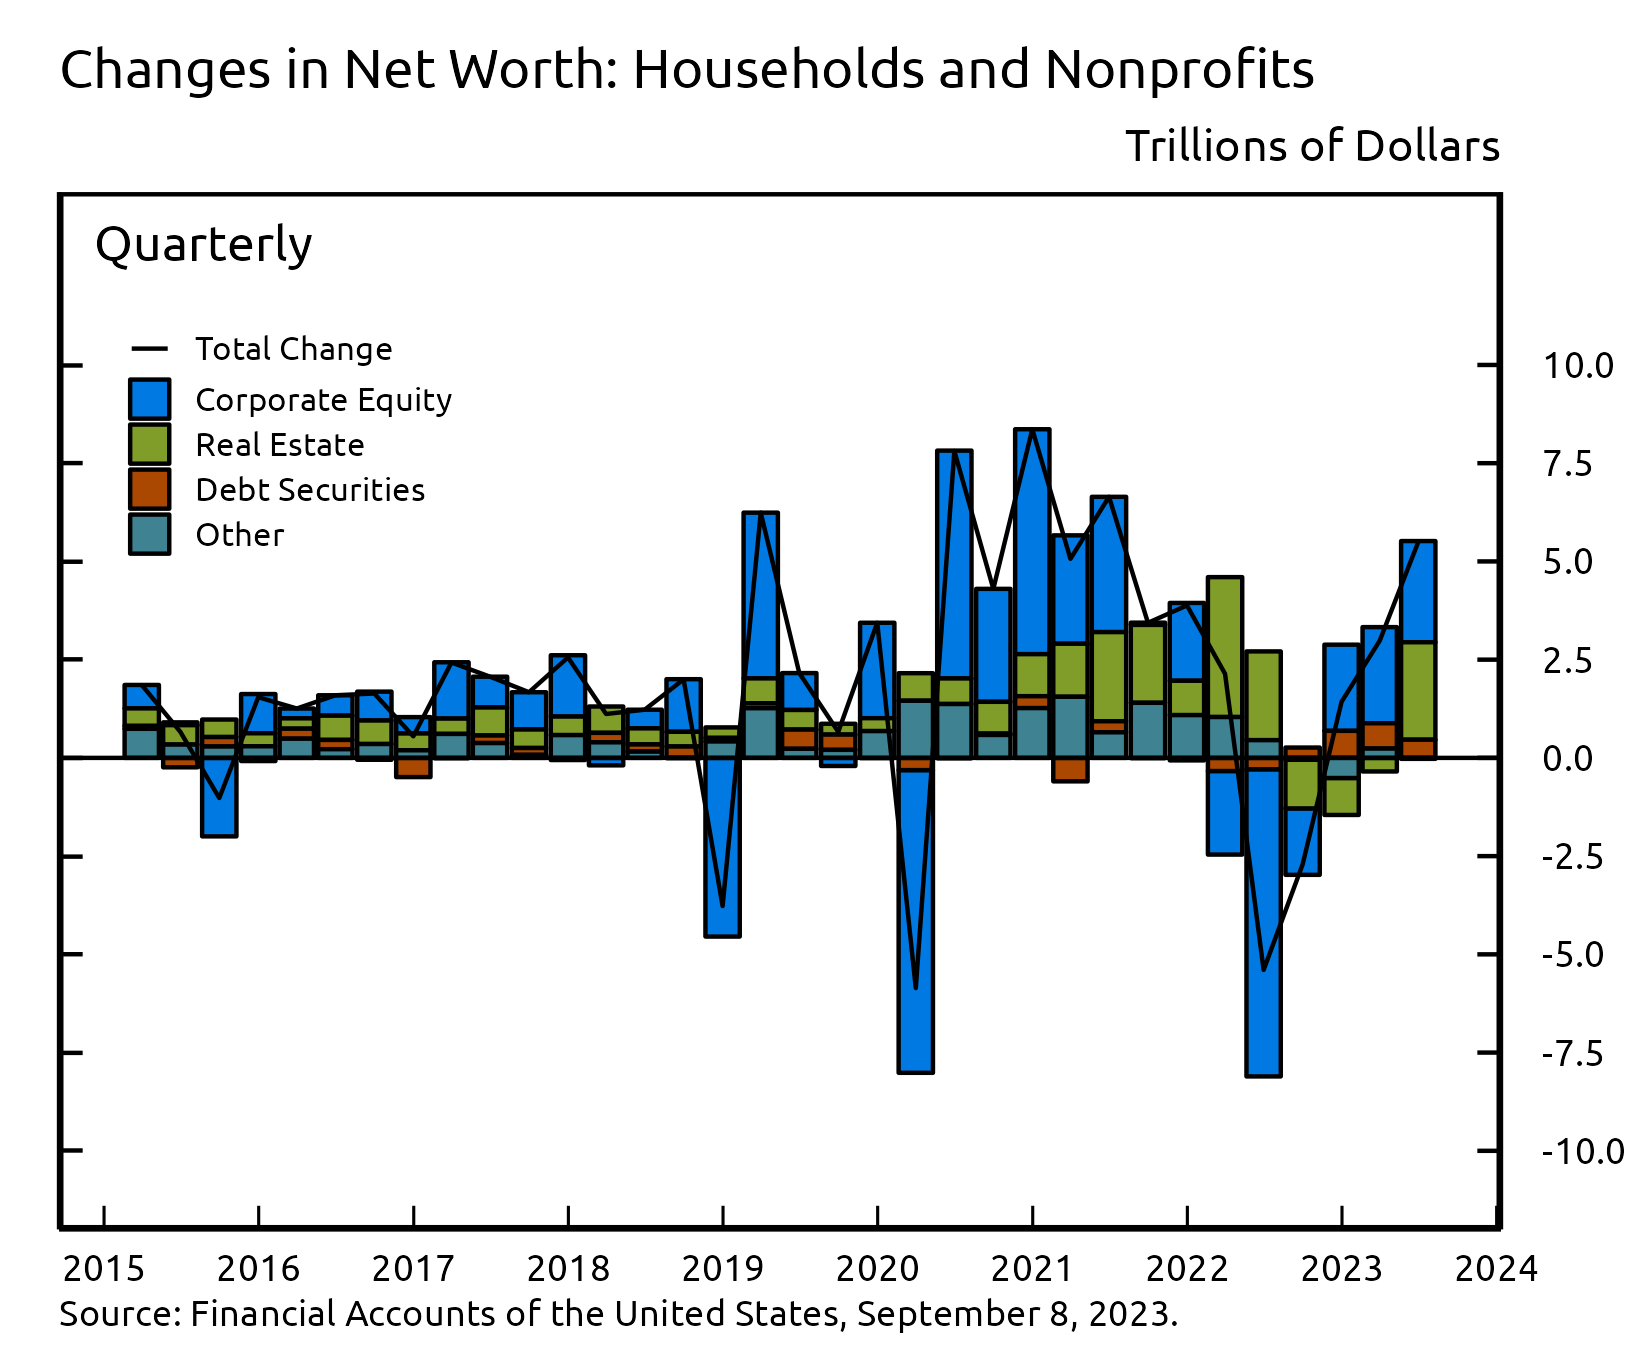
- Household net worth increased by $5.5 trillion in the second quarter, primarily driven by gains in stock and house prices.
- Household debt growth expanded at a 2.7% pace amid modest growth in mortgage debt and a slowdown in the growth of consumer credit.
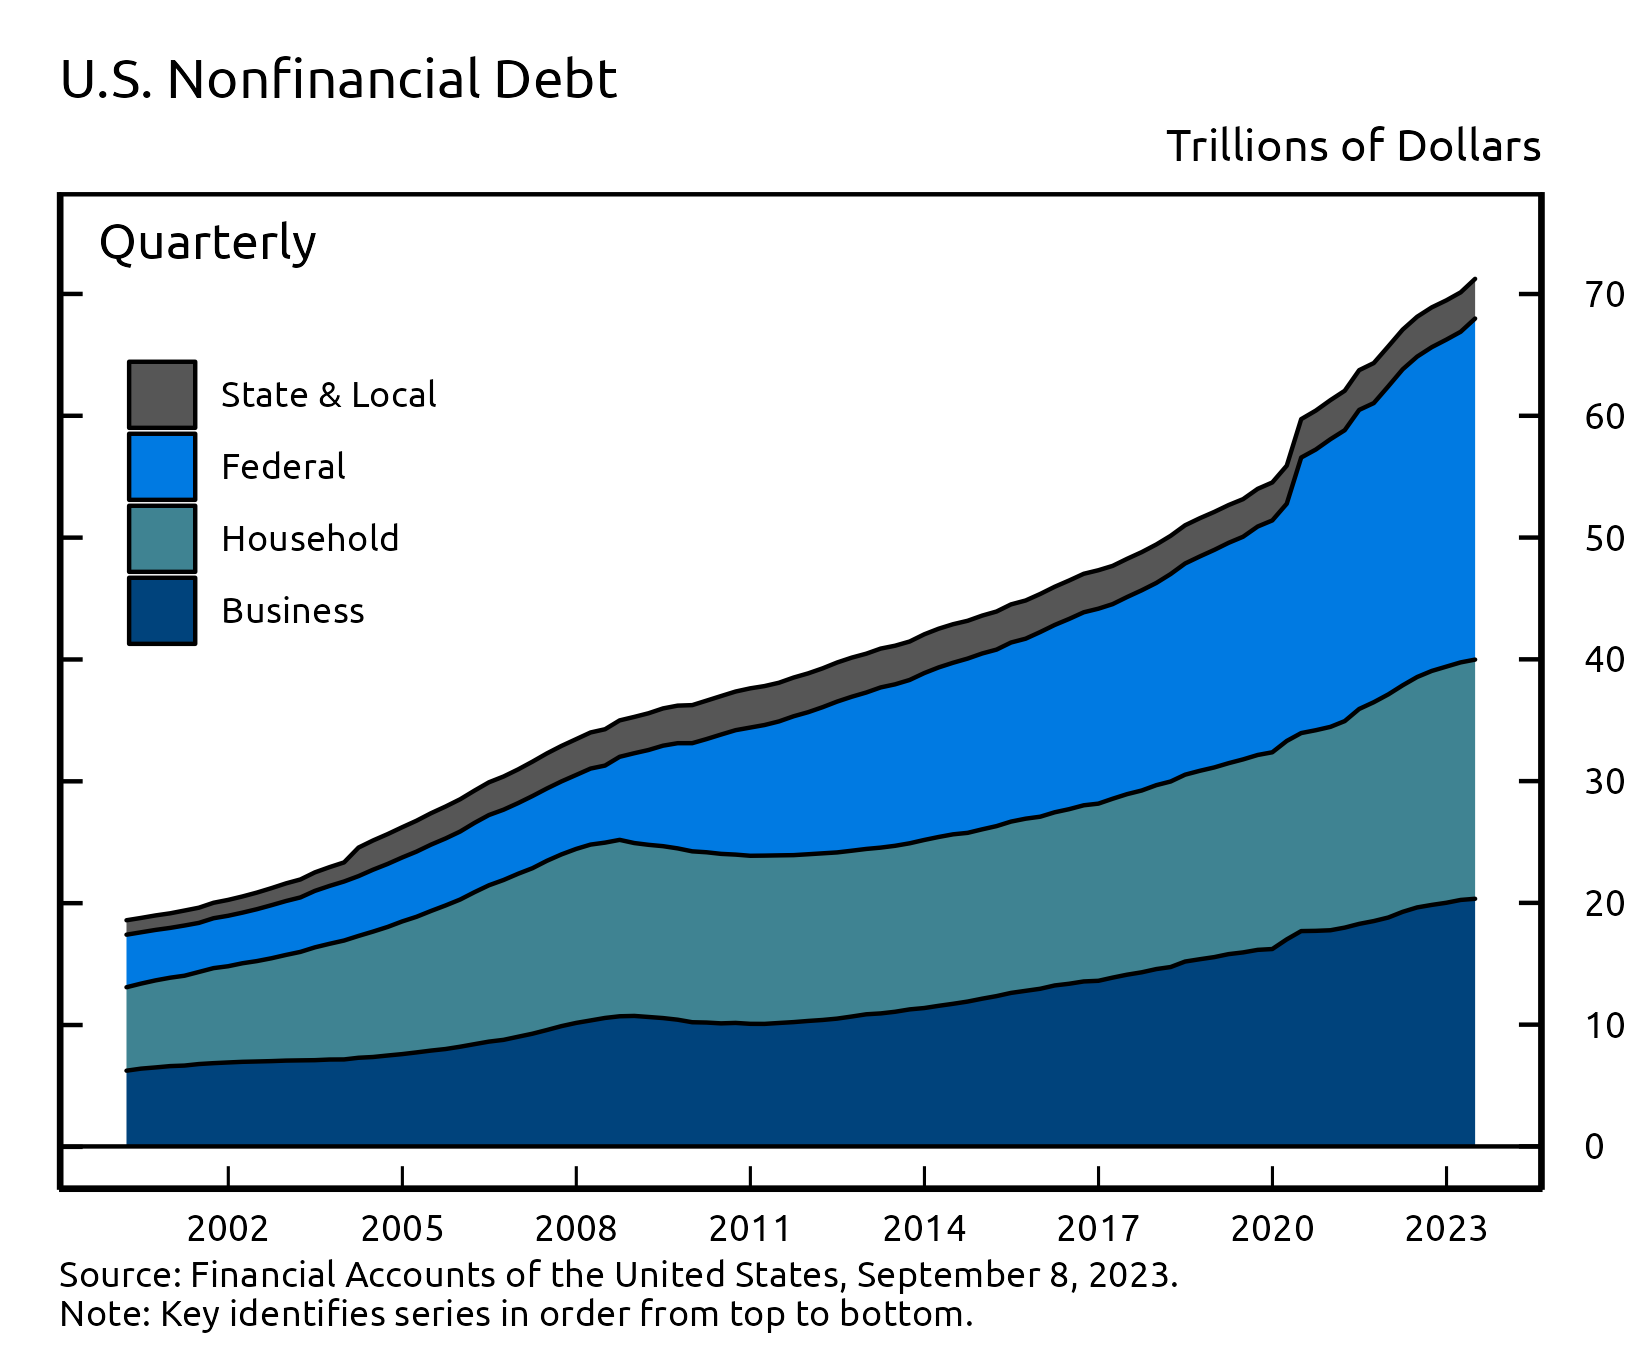
- Nonfinancial business debt increased at an annual rate of 1.9%, reflecting weak net bond issuance and slow growth in loans.
Household Net Worth
The net worth of households and nonprofit organizations increased $5.5 trillion to $154.3 trillion in the second quarter. The increase in household net worth was primarily driven by gains on corporate equity holdings and real estate; the value of household’s directly and indirectly held corporate equities increased by $2.6 trillion, while the value of household real estate increased by $2.4 trillion.
View interactive | Accessible version | CSV | Data Dictionary | Chart Note (1) |
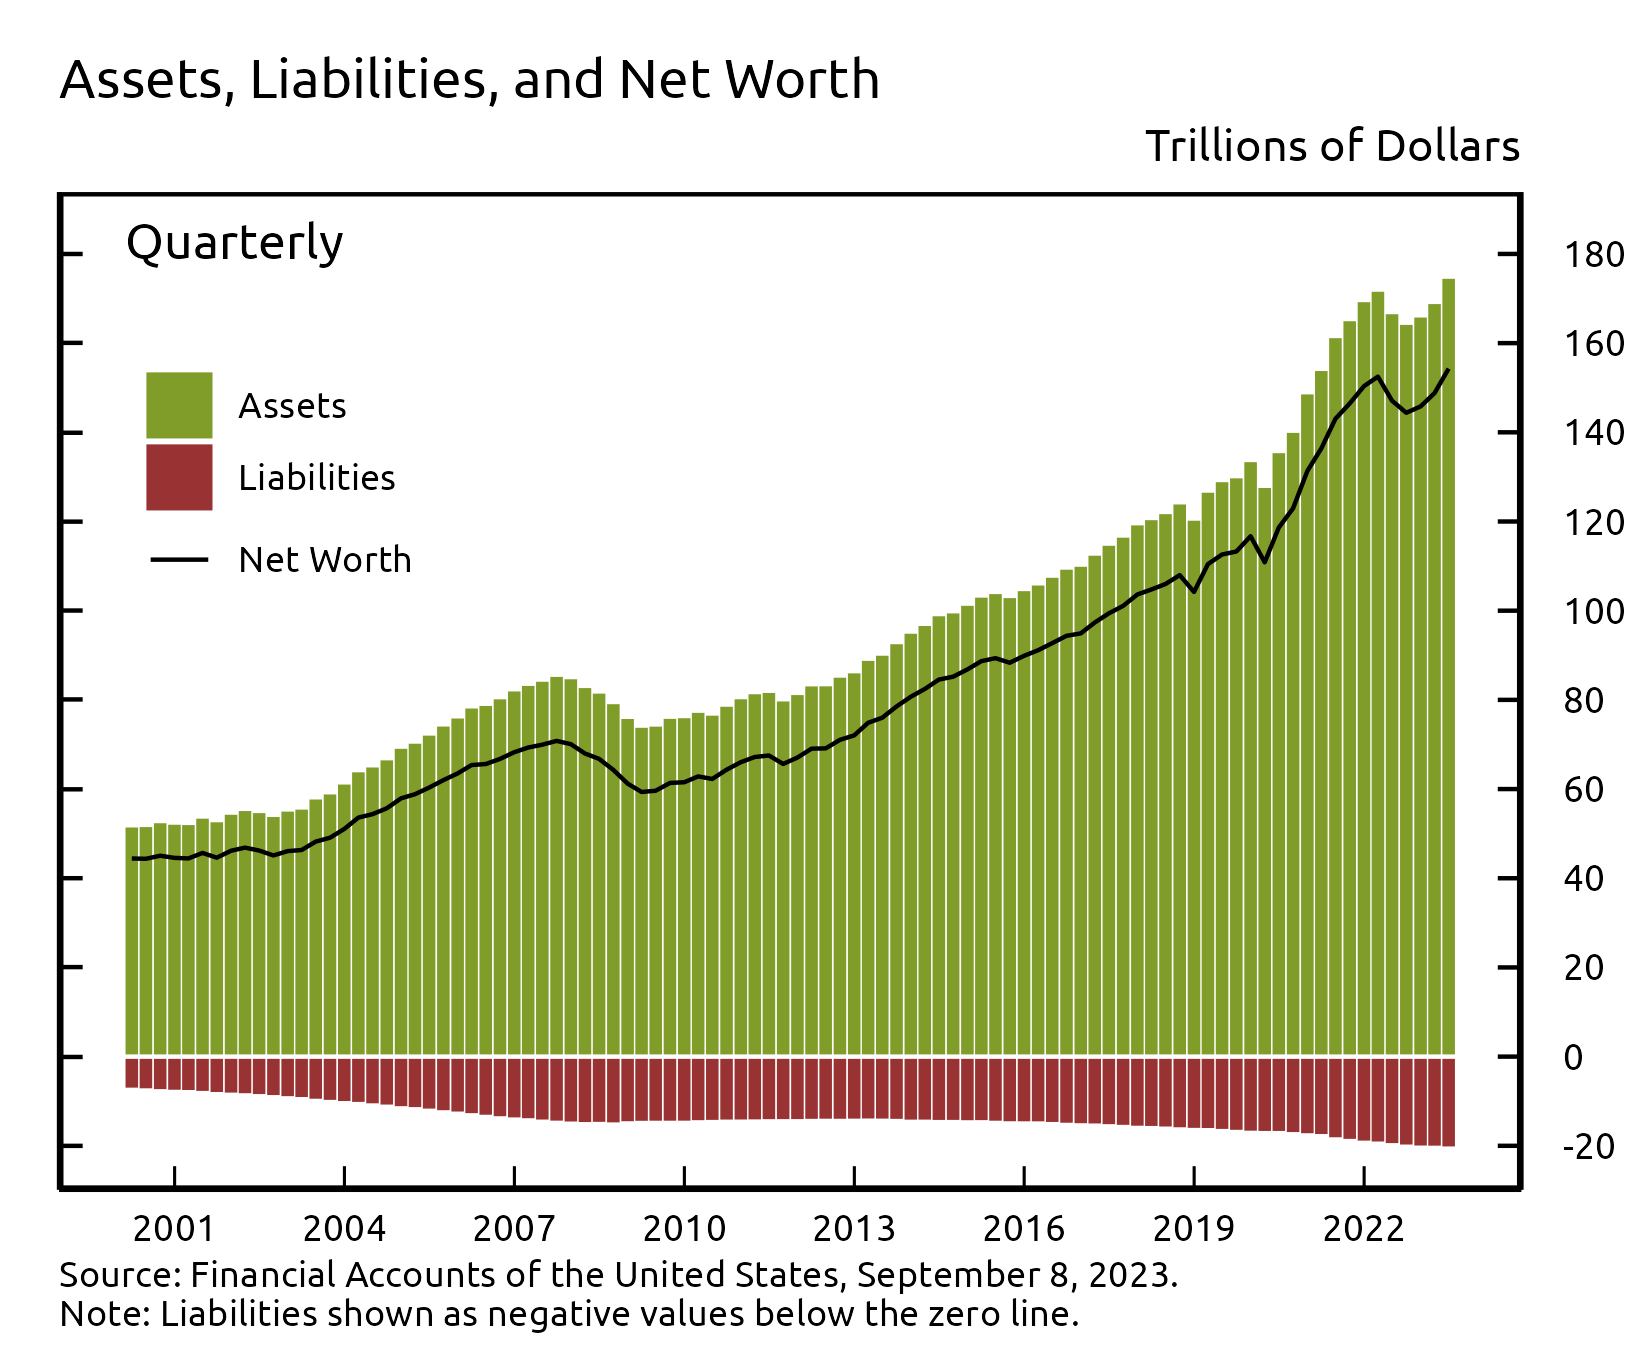
Directly and indirectly held corporate equities ($44.7 trillion) and household real estate ($44.5 trillion) remain the largest components of household net worth. Household debt (seasonally adjusted) was $19.6 trillion.
View interactive | Accessible version | CSV | Data Dictionary |
Household Balance Sheet Summary
| Description | 2021 | 2022 | 2022:Q3 | 2022:Q4 | 2023:Q1 | 2023:Q2 |
|---|---|---|---|---|---|---|
| Net Worth | 150.35 | 145.81 | 144.38 | 145.81 | 148.79 | 154.28 |
| Change in Net Worth | 19.03 | -4.54 | -2.71 | 1.43 | 2.98 | 5.49 |
| Equities | 49.13 | 39.69 | 37.50 | 39.69 | 42.14 | 44.71 |
| Change in Equities | 8.24 | -9.44 | -1.69 | 2.19 | 2.45 | 2.58 |
| Real Estate | 38.73 | 42.36 | 43.26 | 42.36 | 42.07 | 44.50 |
| Change in Real Estate | 5.83 | 3.63 | -1.30 | -0.90 | -0.30 | 2.43 |
For more data on household net worth, see table B.101
Nonfinancial debt
Household debt grew by 2.7% in the second quarter of 2023, a touch higher than in the first quarter but down noticeably from the average pace posted over the previous two years (this and subsequent rates of growth are reported at a seasonally adjusted annual rate). Home mortgage debt expanded by 2.8% while nonmortgage consumer credit grew by 2.3%.
Nonfinancial business debt grew at a 1.9% pace in the second quarter, reflecting relatively low net issuance of corporate debt securities and a continued slowdown in the growth of mortgages and other loans. Federal government debt increased at a 12.7% pace, while state and local government debt expanded by 2.8%.
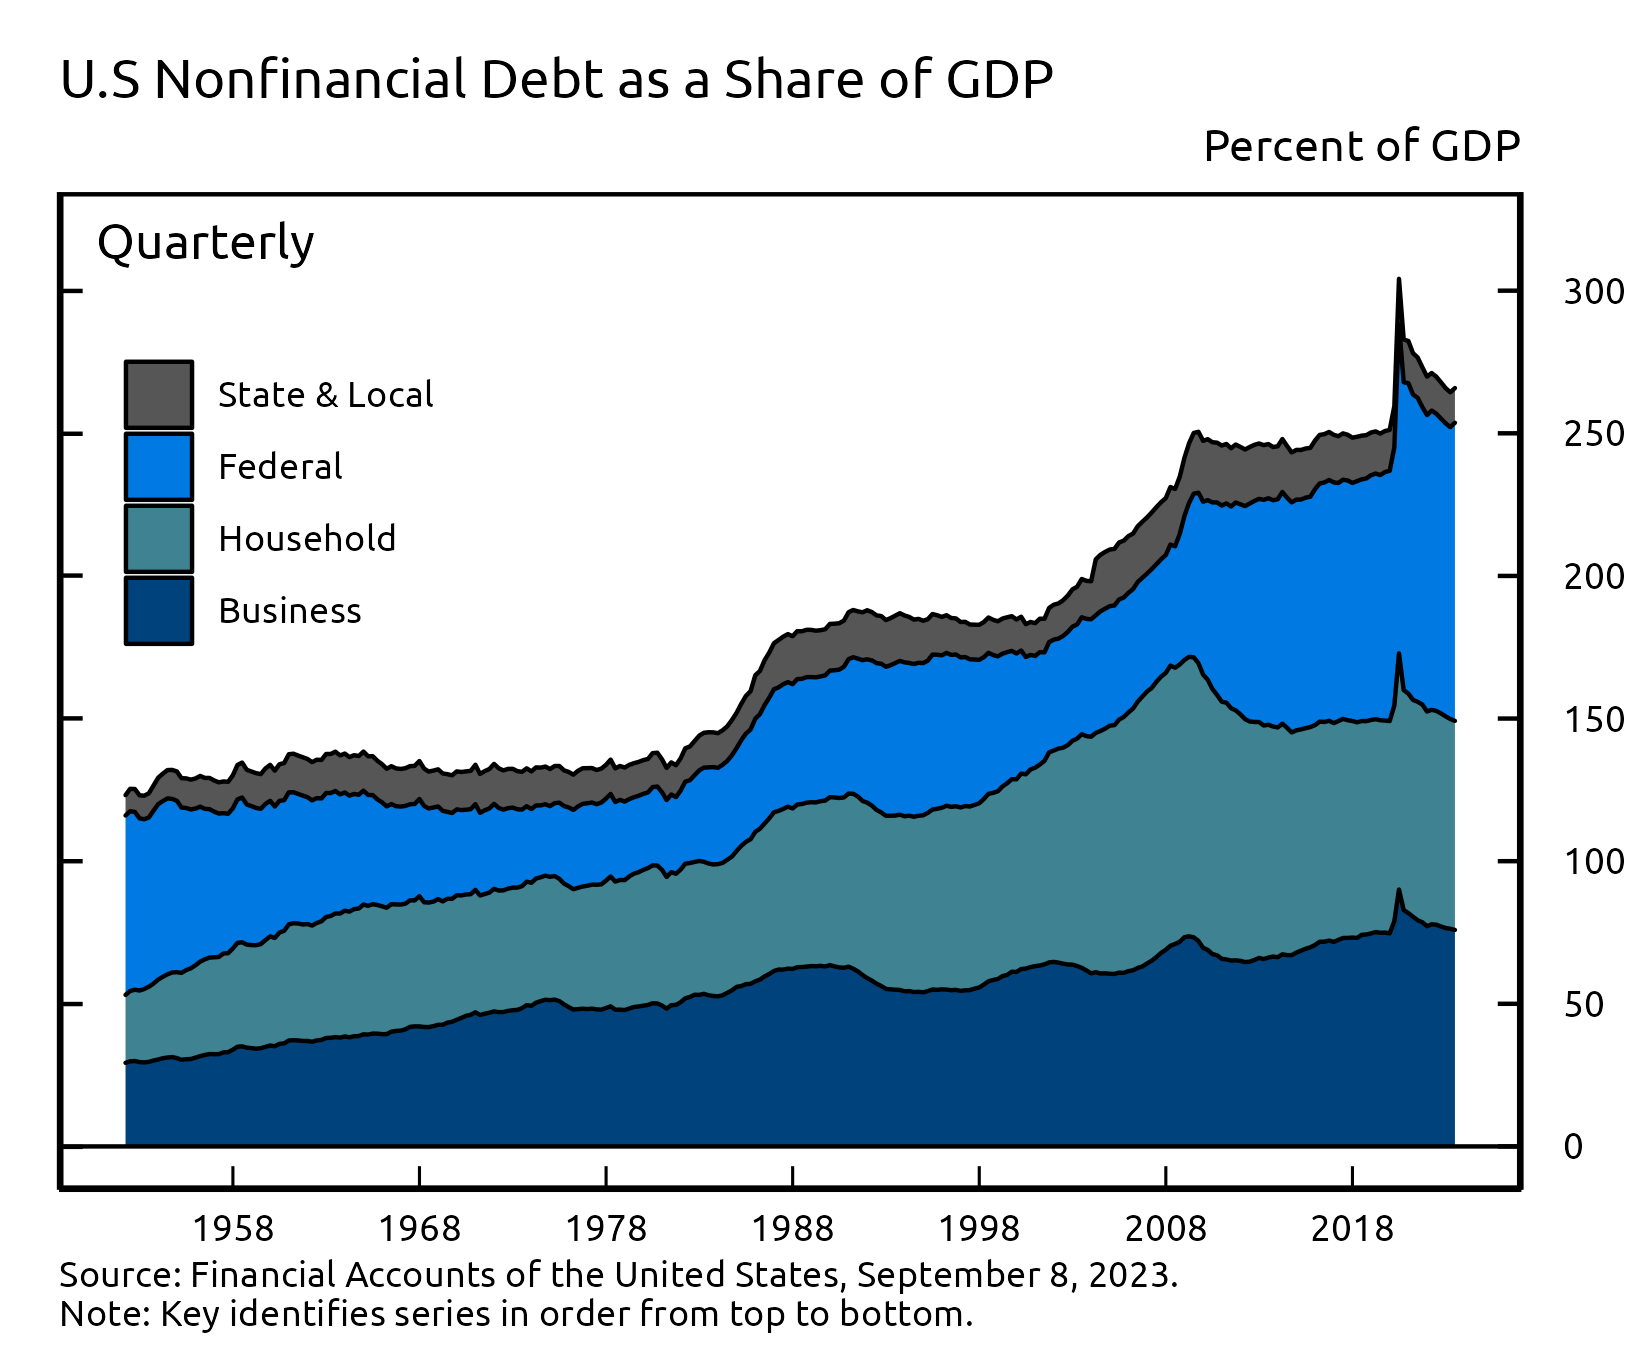
The ratio of nonfinancial debt outstanding to GDP ticked up in the second quarter, as robust growth of federal debt after the debt ceiling was lifted in June more than offset the relatively slow debt growth of households and nonfinancial businesses. The ratio has declined substantially since it spiked amid pandemic-related factors in the second quarter of 2020 but remains slightly above the level that prevailed in the years just before the pandemic.
For more data on nonfinancial debt, see table D.1 (rates of growth) and table D.3 (outstanding).
Debt Growth by Sector
| Description | 2021 | 2022 | 2022:Q3 | 2022:Q4 | 2023:Q1 | 2023:Q2 |
|---|---|---|---|---|---|---|
| Total Nonfinancial | 6.32 | 5.69 | 4.52 | 3.24 | 3.78 | 6.34 |
| Households and Nonprofits | 7.52 | 6.20 | 6.21 | 3.29 | 2.40 | 2.73 |
| Nonfinancial Business | 4.87 | 5.90 | 4.19 | 3.58 | 4.62 | 1.89 |
| Federal Government | 7.13 | 6.11 | 4.19 | 3.98 | 4.45 | 12.67 |
| State and Local Governments | 2.17 | -1.60 | -0.52 | -5.14 | 1.21 | 2.75 |
Debt Outstanding by Sector
| Description | 2021 | 2022 | 2022:Q3 | 2022:Q4 | 2023:Q1 | 2023:Q2 |
|---|---|---|---|---|---|---|
| Total Nonfinancial | 65.71 | 69.48 | 68.90 | 69.48 | 70.14 | 71.25 |
| Households and Nonprofits | 18.33 | 19.39 | 19.21 | 19.39 | 19.51 | 19.64 |
| Nonfinancial Business | 18.80 | 20.01 | 19.83 | 20.01 | 20.24 | 20.34 |
| Federal Government | 25.30 | 26.85 | 26.59 | 26.85 | 27.15 | 28.01 |
| State and Local Governments | 3.28 | 3.23 | 3.27 | 3.23 | 3.24 | 3.26 |
Accessible version | CSV | Data Dictionary |
Accessible version | CSV | Data Dictionary |
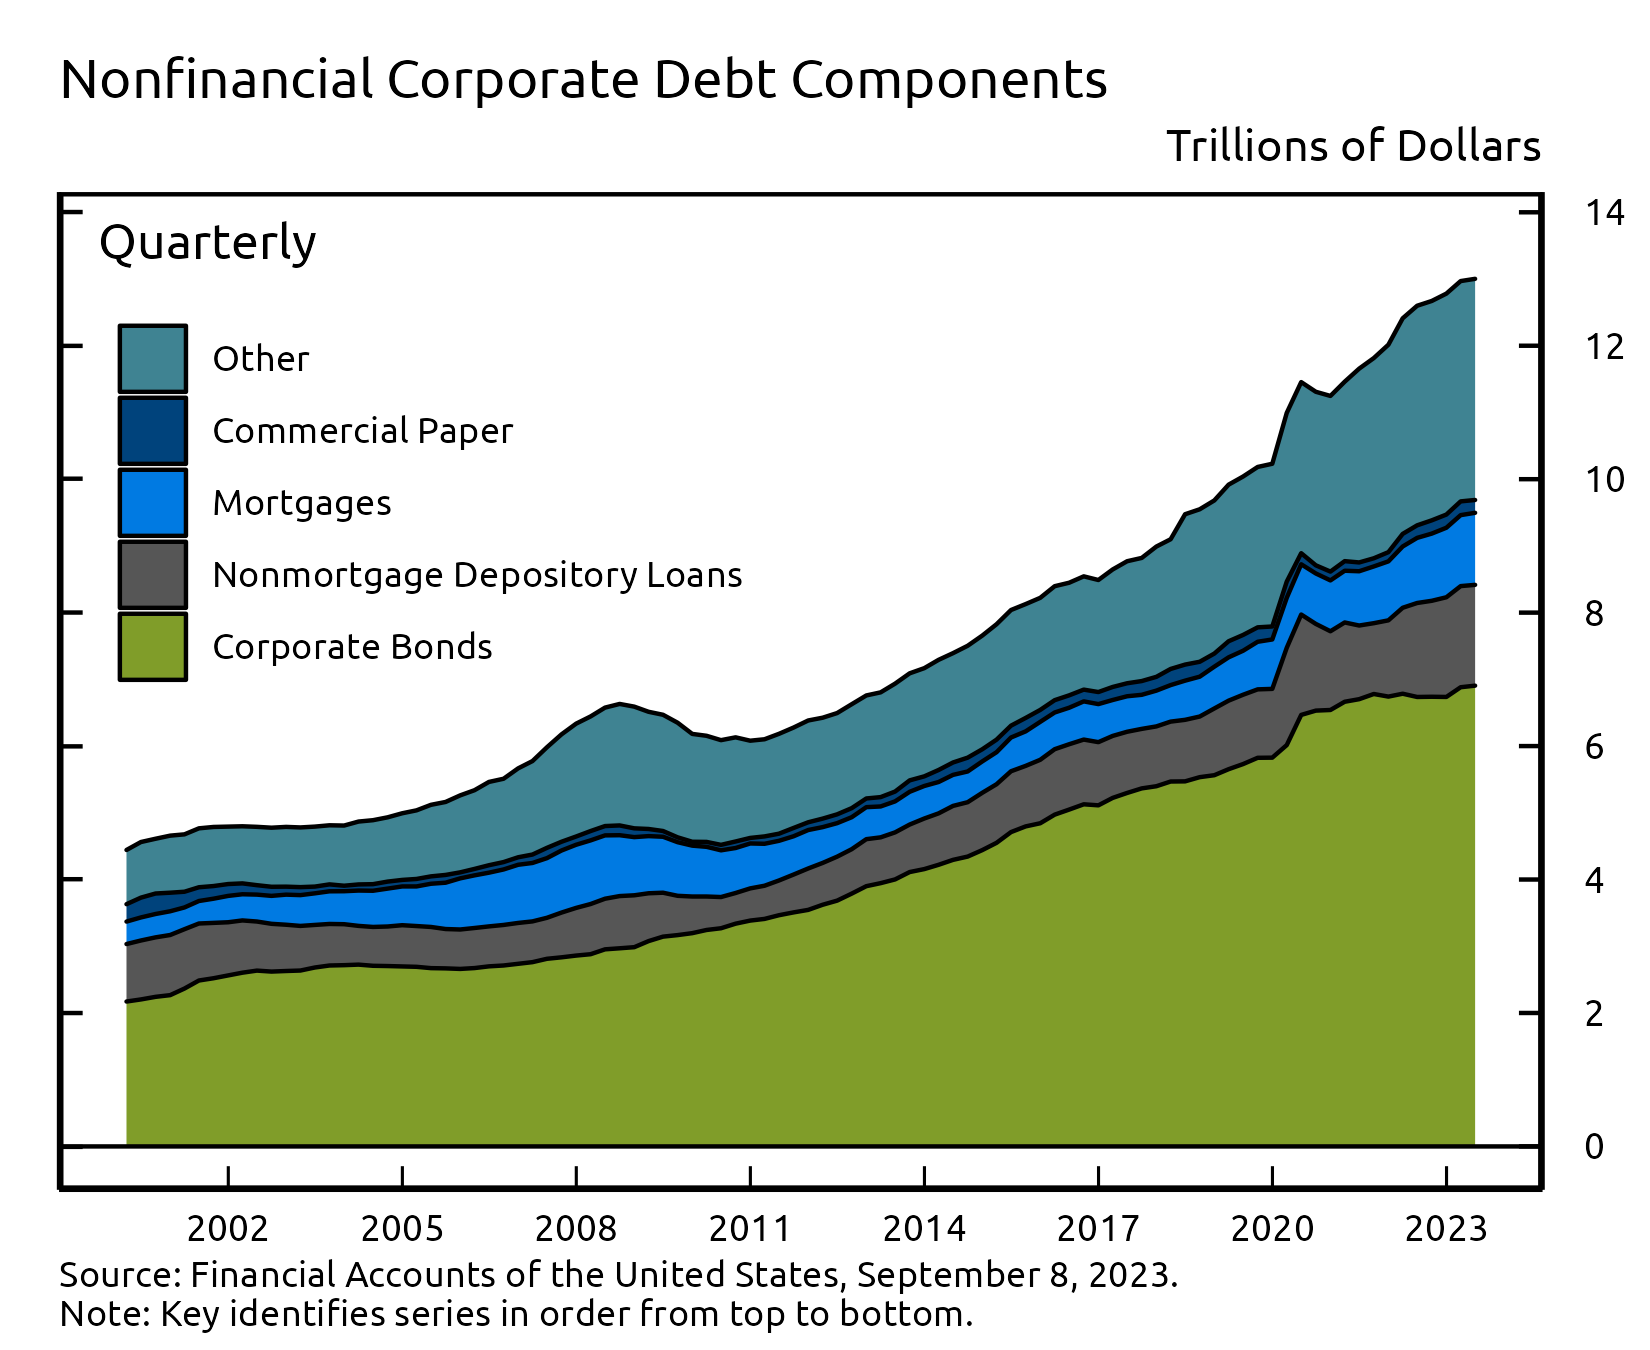
Looking at the various components of nonfinancial business debt, corporate bonds increased by about $24 billion in the second quarter while mortgage loans increased by $65 billion. Other types of loans, including nonmortgage loans at depository institutions, declined by about $13 billion in the second quarter.
Overall, outstanding nonfinancial corporate debt was $13.0 trillion. Corporate bonds, at roughly $6.9 trillion, accounted for 53% of the total. Nonmortgage depository loans were about $1.5 trillion. Other types of debt include loans from nonbank financial institutions, loans from the federal government, industrial revenue bonds, and commercial paper.
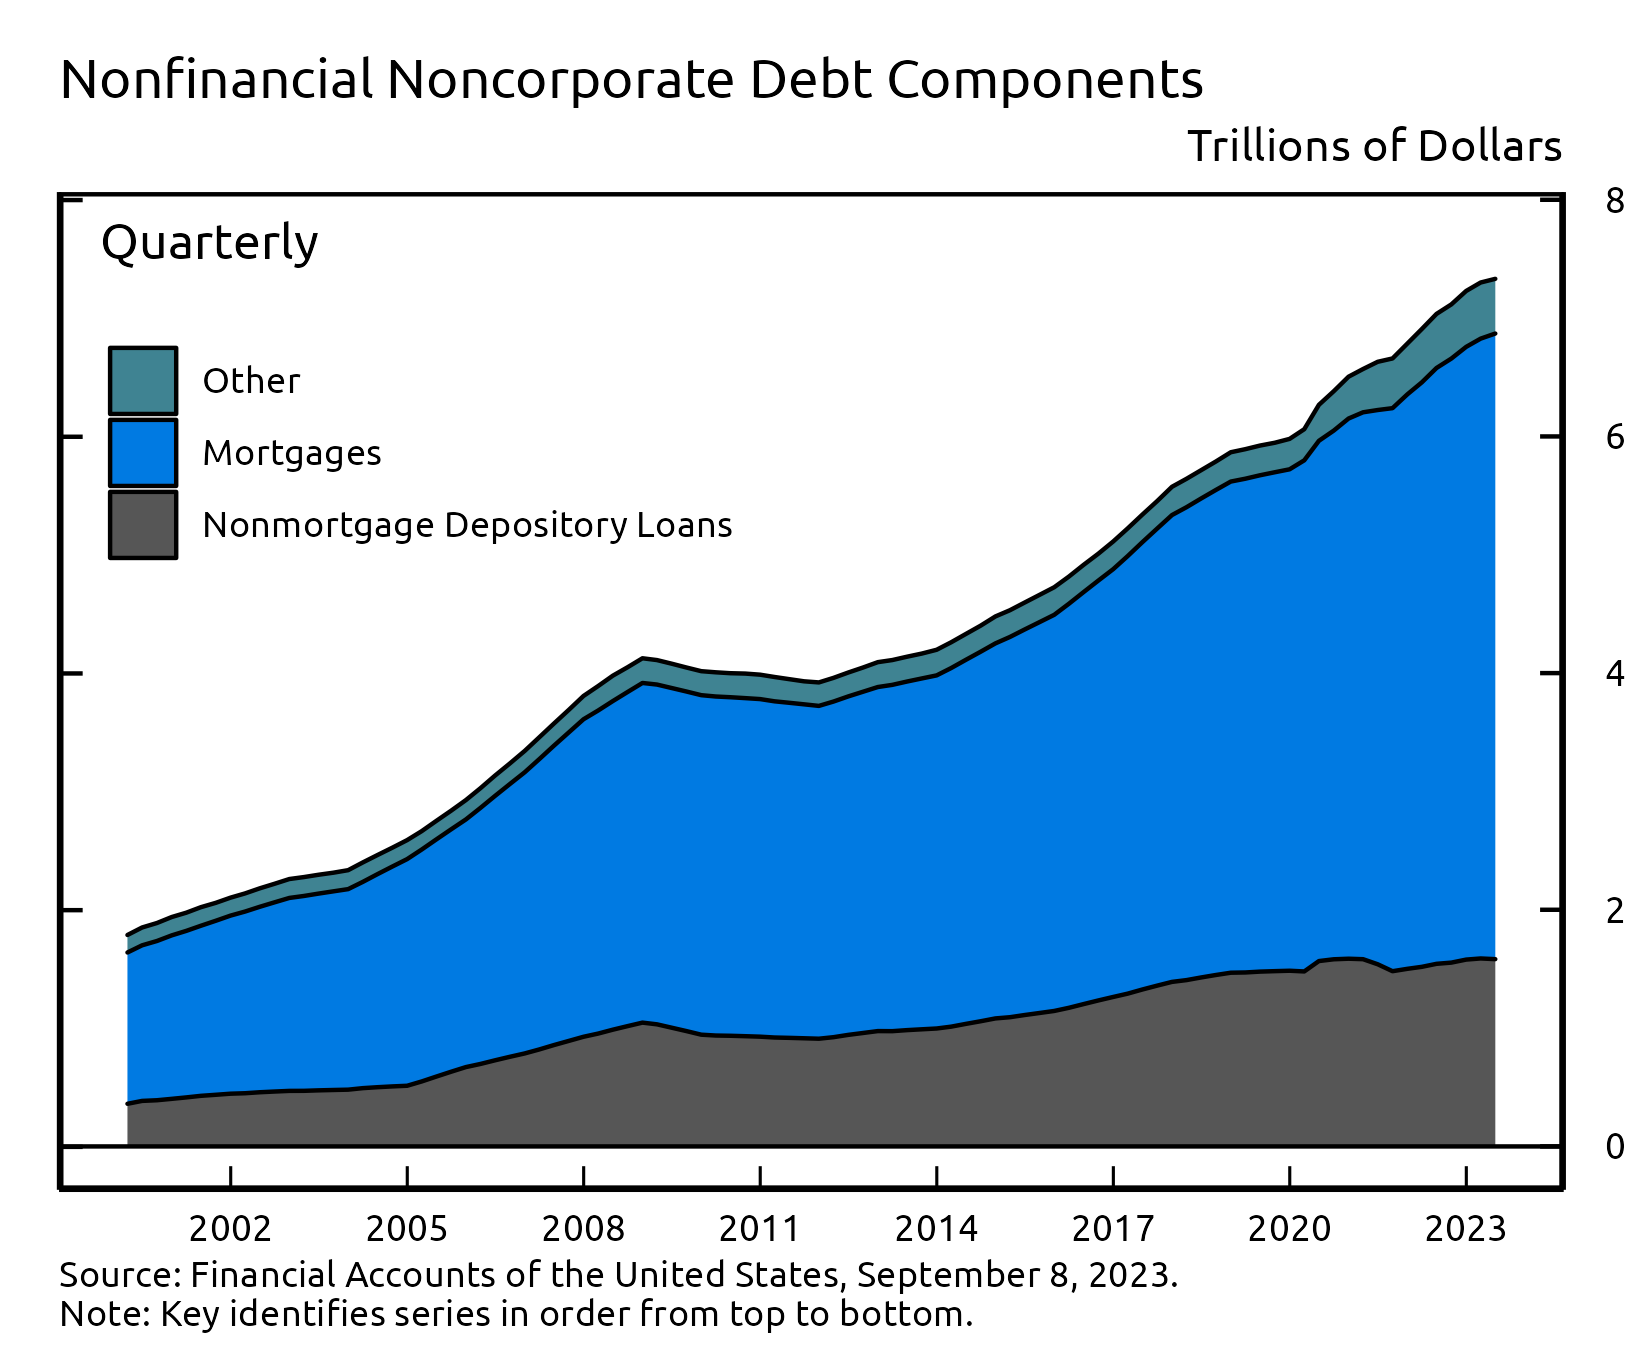
The nonfinancial noncorporate business sector consists mostly of smaller businesses, which are typically not incorporated. Nonfinancial noncorporate business debt was $7.3 trillion in the second quarter. Mortgage loans, at roughly $5.3 trillion, accounted for about 72% of the total, while nonmortgage depository loans ($1.6 trillion) accounted for most of the remainder.
Accessible version | CSV | Data Dictionary |
Accessible version | CSV | Data Dictionary |
For more data on nonfinancial business balance sheets, including debt, see tables B.103 and B.104.
Coming soon
- Enhanced Financial Accounts Projects
(www.federalreserve.gov/releases/efa/enhanced-financial-accounts.htm)
will be updated on Friday, September 22, 2023, including the
Distributional Financial Accounts, which provide a quarterly
estimate of the distribution of U.S. household wealth.
- Financial Accounts data for the third quarter of 2023 will be published on Thursday, December 7, 2023, at 12:00 noon.
Chart Notes
- Changes in net worth consist of transactions, revaluations, and other volume changes. Corporate equity and debt securities include directly and indirectly held securities. Real estate is the value of owner-occupied real estate. Other includes equity in noncorporate businesses, consumer durable goods, fixed assets of nonprofit organizations, and all other financial assets apart from corporate equities and debt securities, net of liabilities, as shown on table B.101 Balance Sheet of Households and Nonprofit Organizations.