Financial Accounts of the United States - Z.1
Recent Developments RSS Data Download
The recent developments discussed below refer to data through September 30, 2025.
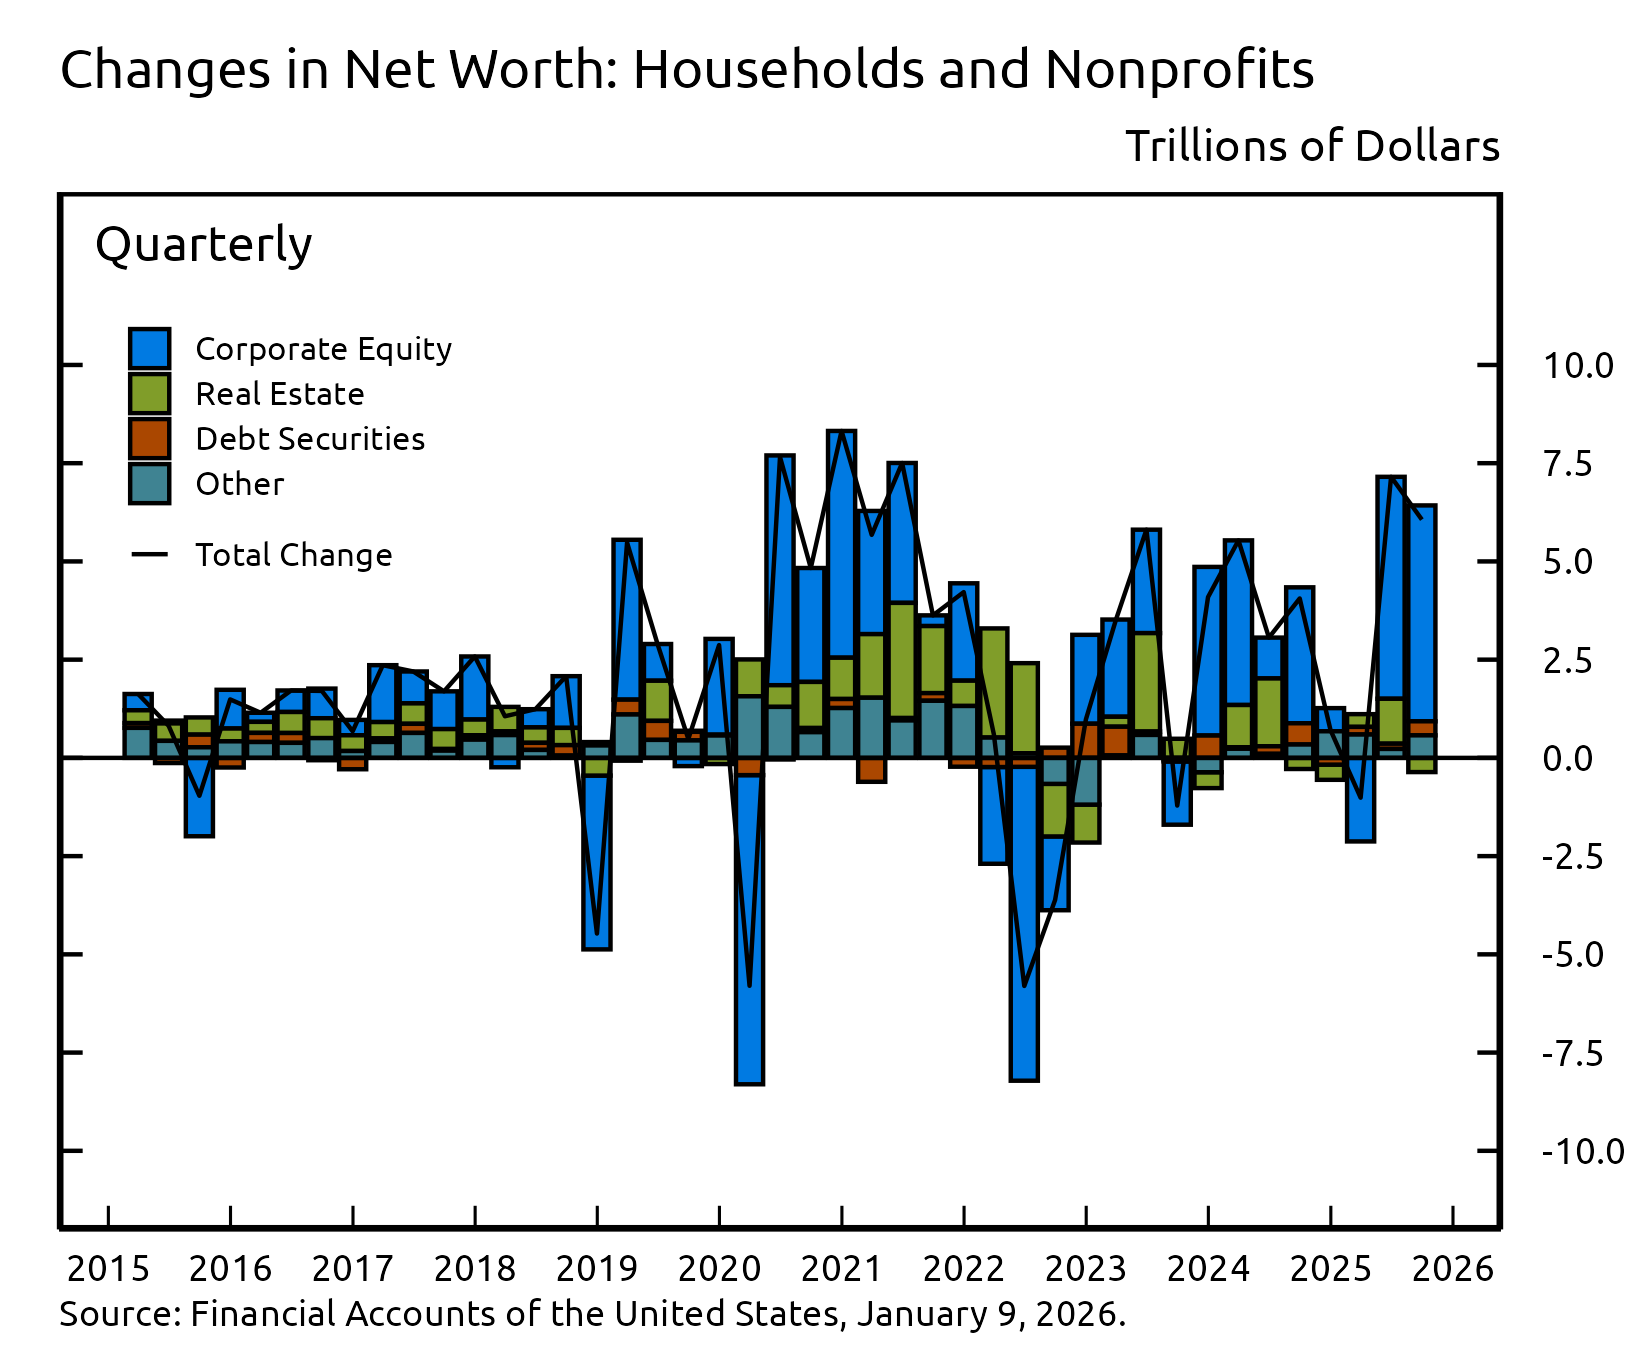
- Household net worth increased by $6.1 trillion in the third quarter of 2025, largely driven by gains on corporate equity.
- Total nonfinancial debt expanded at a seasonally adjusted annual rate of 8.8% in the third quarter, buoyed by rapid growth in federal borrowing amid continued moderate growth in nonfinancial business and household debt.
- Household debt increased at a 4.1% pace, reflecting continued steady growth in mortgage debt and nonmortgage consumer credit.
- Nonfinancial business debt grew at an annual rate of 3.9%, driven by robust net issuance of corporate bonds and solid growth in mortgage loans and nonmortgage loans at nondepository financial institutions.
Household Net Worth
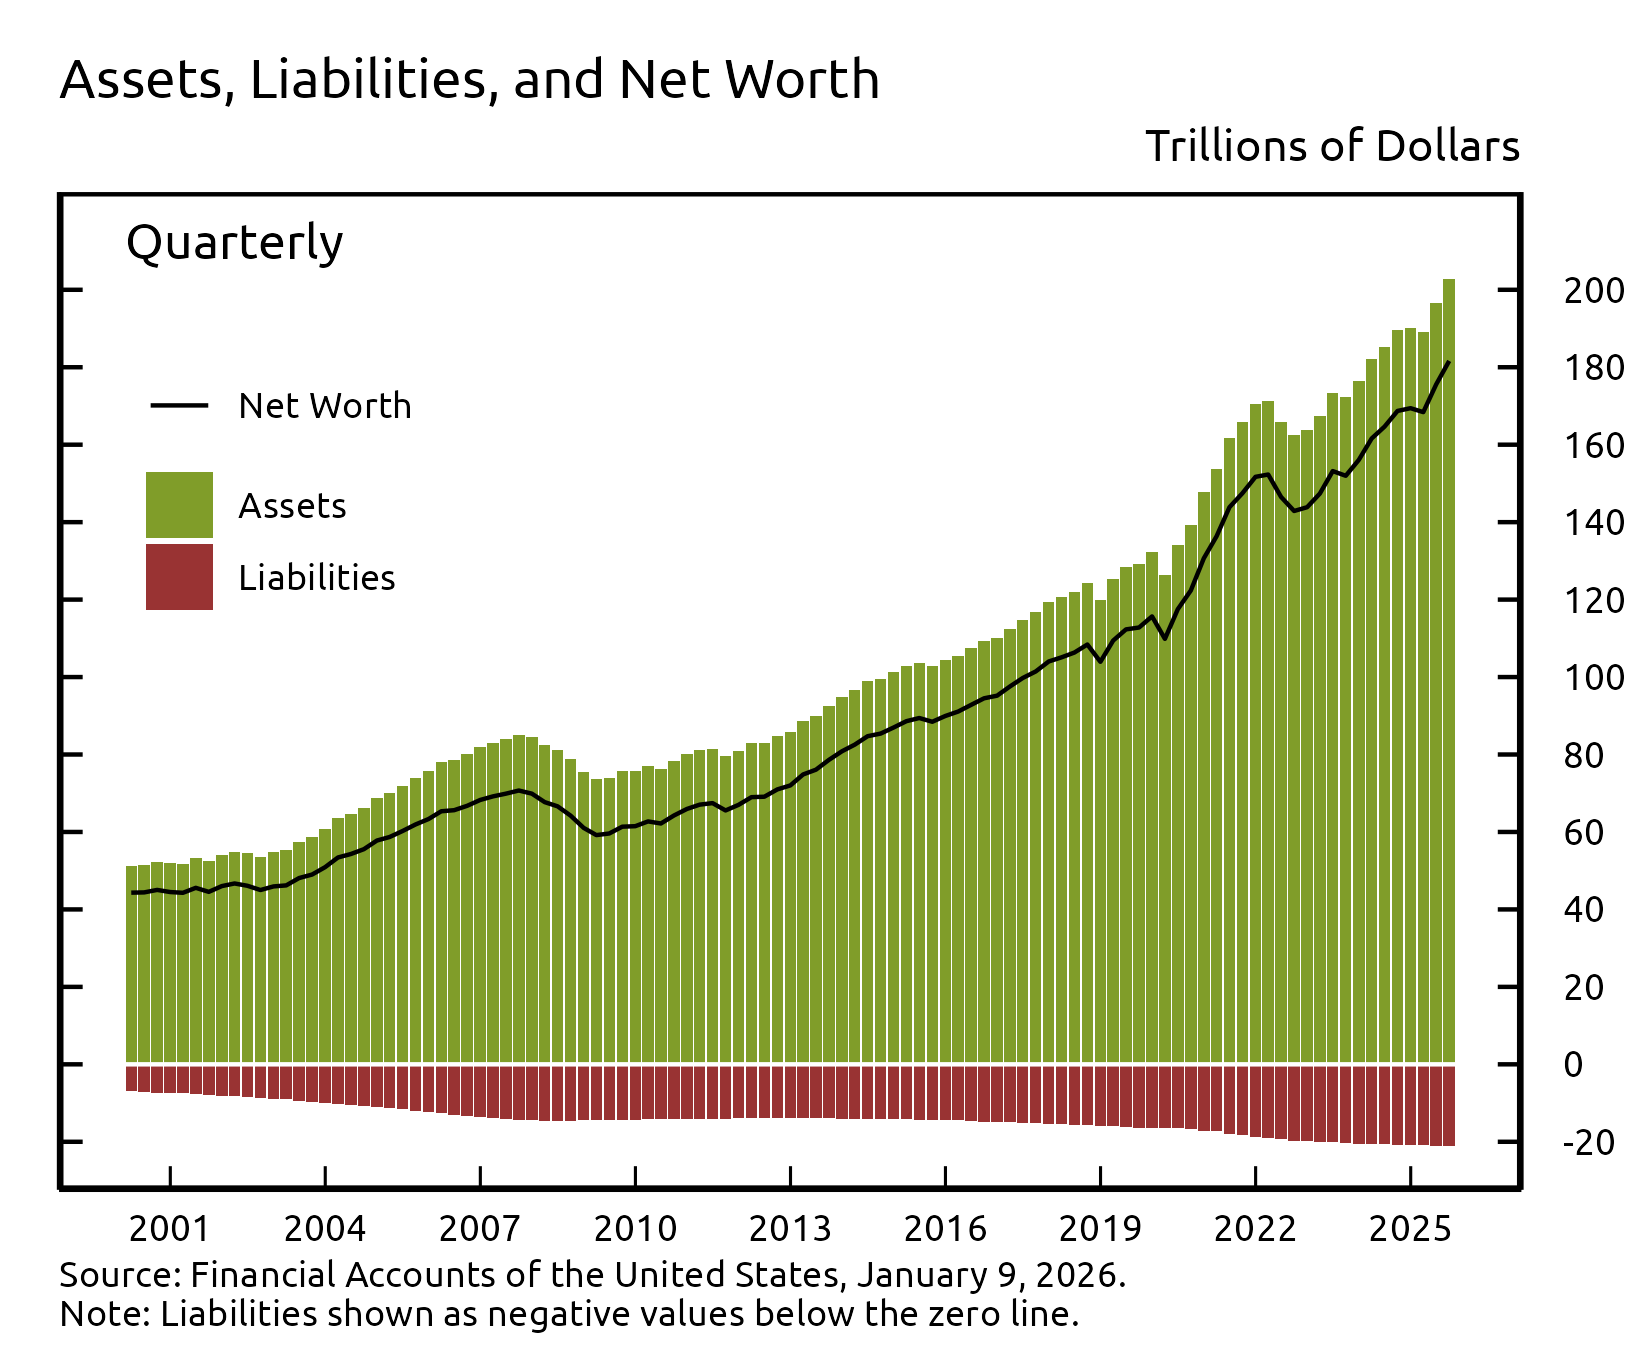
The net worth of households and nonprofit organizations increased by $6.1 trillion to $181.6 trillion in the third quarter. The value of directly and indirectly held equity on the household balance sheet increased by $5.5 trillion in the third quarter, while the value of directly and indirectly held debt securities rose by $0.4 trillion. The value of owner-occupied real estate decreased by $0.4 trillion, as house prices declined slightly in the third quarter.
View interactive | Accessible version | CSV | Data Dictionary | Chart Note (1) |
Directly and indirectly held corporate equities ($66.5 trillion) and household real estate ($48.0 trillion) remain the largest components of household net worth.
View interactive | Accessible version | CSV | Data Dictionary |
Household Balance Sheet Summary
| Description | 2023 | 2024 | 2024:Q4 | 2025:Q1 | 2025:Q2 | 2025:Q3 |
|---|---|---|---|---|---|---|
| Net Worth | 156.06 | 169.43 | 169.43 | 168.41 | 175.57 | 181.63 |
| Change in Net Worth | 12.21 | 13.36 | 0.71 | -1.01 | 7.15 | 6.06 |
| Equities | 48.19 | 57.47 | 57.47 | 55.34 | 60.99 | 66.49 |
| Change in Equities | 7.79 | 9.28 | 0.59 | -2.13 | 5.65 | 5.49 |
| Real Estate | 44.80 | 46.93 | 46.93 | 47.25 | 48.40 | 48.04 |
| Change in Real Estate | 2.84 | 2.13 | -0.39 | 0.32 | 1.14 | -0.36 |
For more data on household net worth, see table B.101
Nonfinancial debt
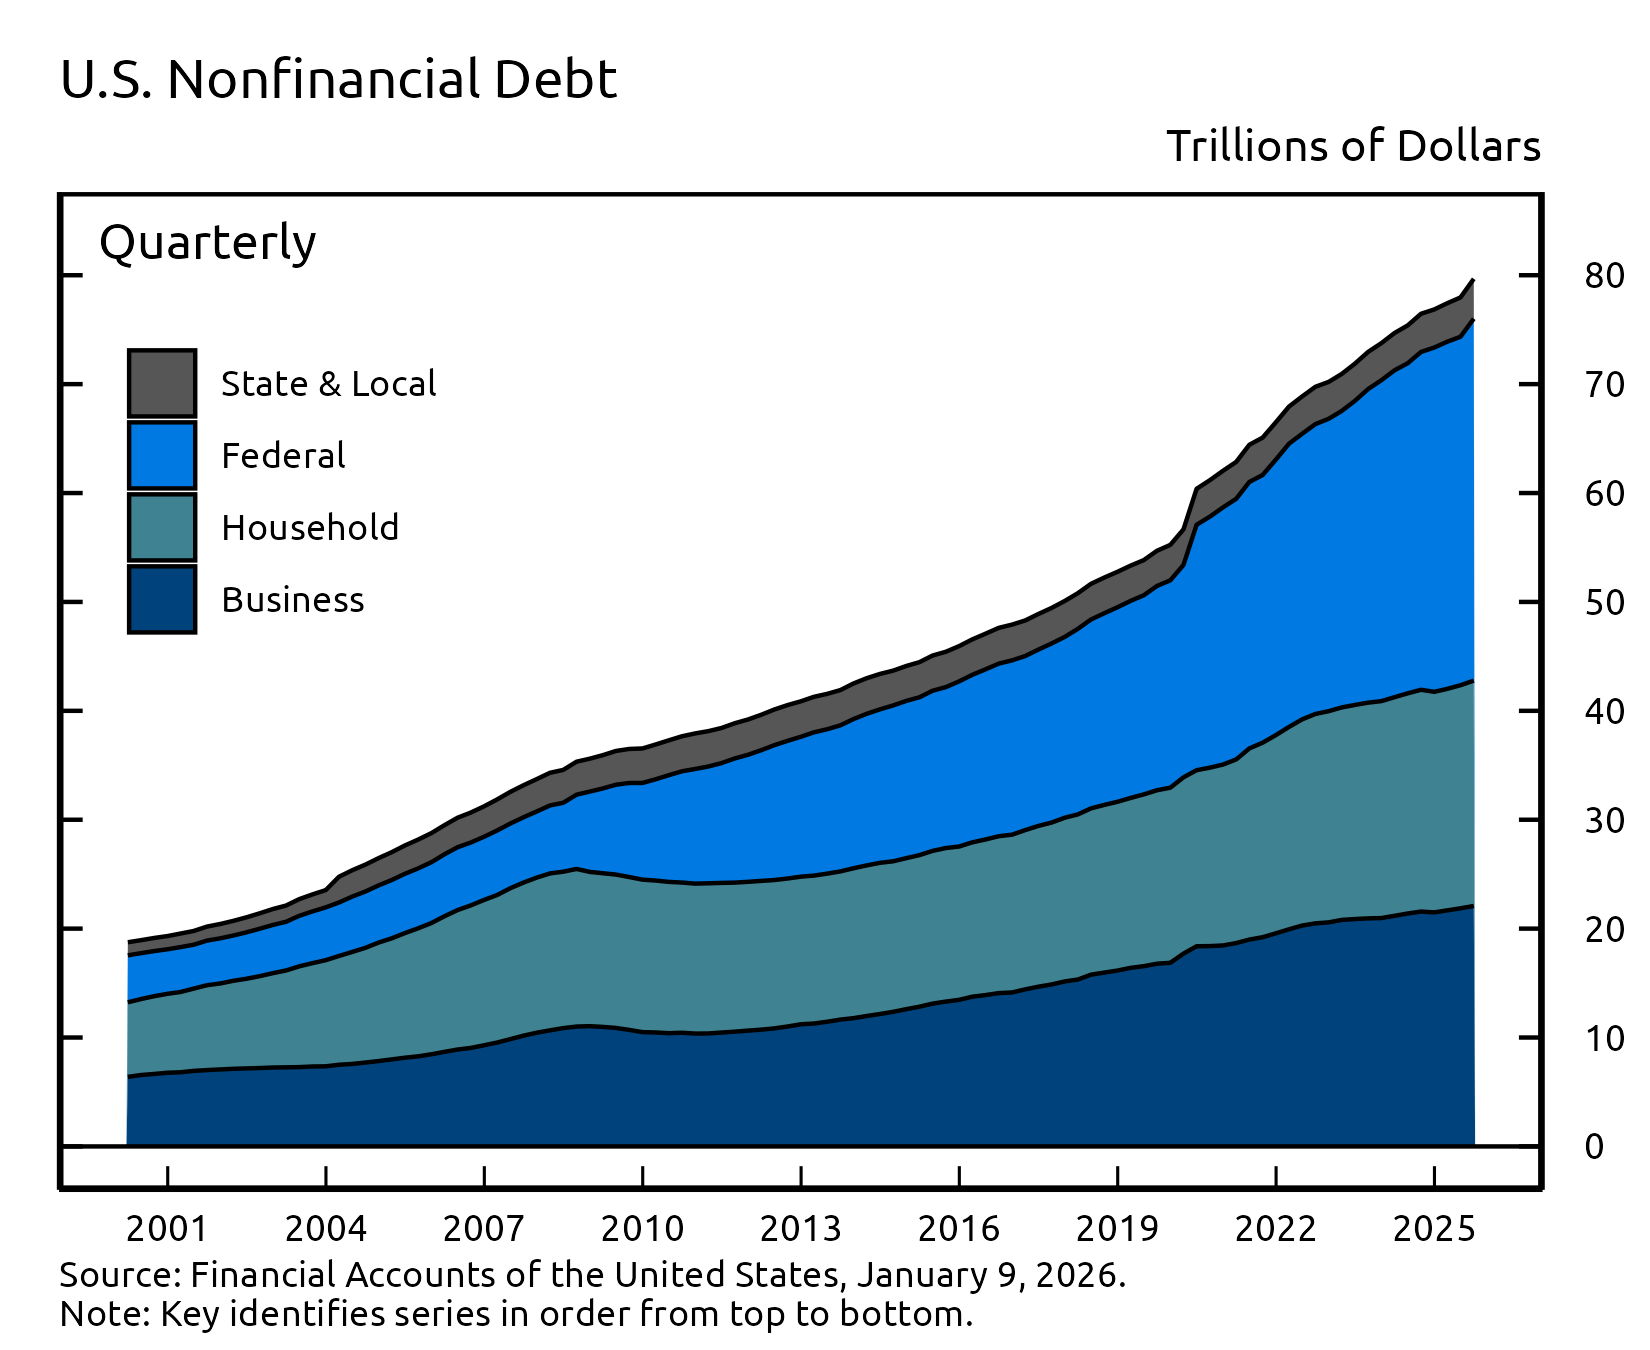
Total domestic nonfinancial debt grew at an annual rate of 8.8% in the third quarter, up noticeably from the first half of the year, and well above the average pace recorded over the past few years (this and subsequent rates of growth are reported at a seasonally adjusted annual rate). This acceleration was primarily driven by the rapid expansion in federal government debt, while private nonfinancial debt continued to expand at a moderate pace.
Household debt grew by 4.1% in the third quarter, up slightly from the 3.9% pace posted in the previous quarter. Home mortgage debt expanded by 3.2% and nonmortgage consumer credit grew by 2.3%.
Nonfinancial business debt expanded at a 3.9% pace in the third quarter, about the same as the previous quarter. While total business borrowing was little changed in the third quarter, the composition shifted somewhat, as net issuance of corporate bonds bounced back while businesses paid down commercial paper, on net. Mortgage debt and nonmortgage loans from nondepository financial institutions continued to expand at a solid pace in the third quarter.
Federal government debt grew at a 15.5% pace in the third quarter, up markedly from the 1.5% pace recorded in the previous quarter. Federal debt expanded rapidly following the increase in the statutory debt limit in July and the subsequent unwinding of extraordinary measures undertaken by the Department of the Treasury to remain below the debt limit. State and local government debt growth expanded at an annual rate of 5.5% in the third quarter, down somewhat from the previous quarter’s exceptionally rapid 8.5% pace.
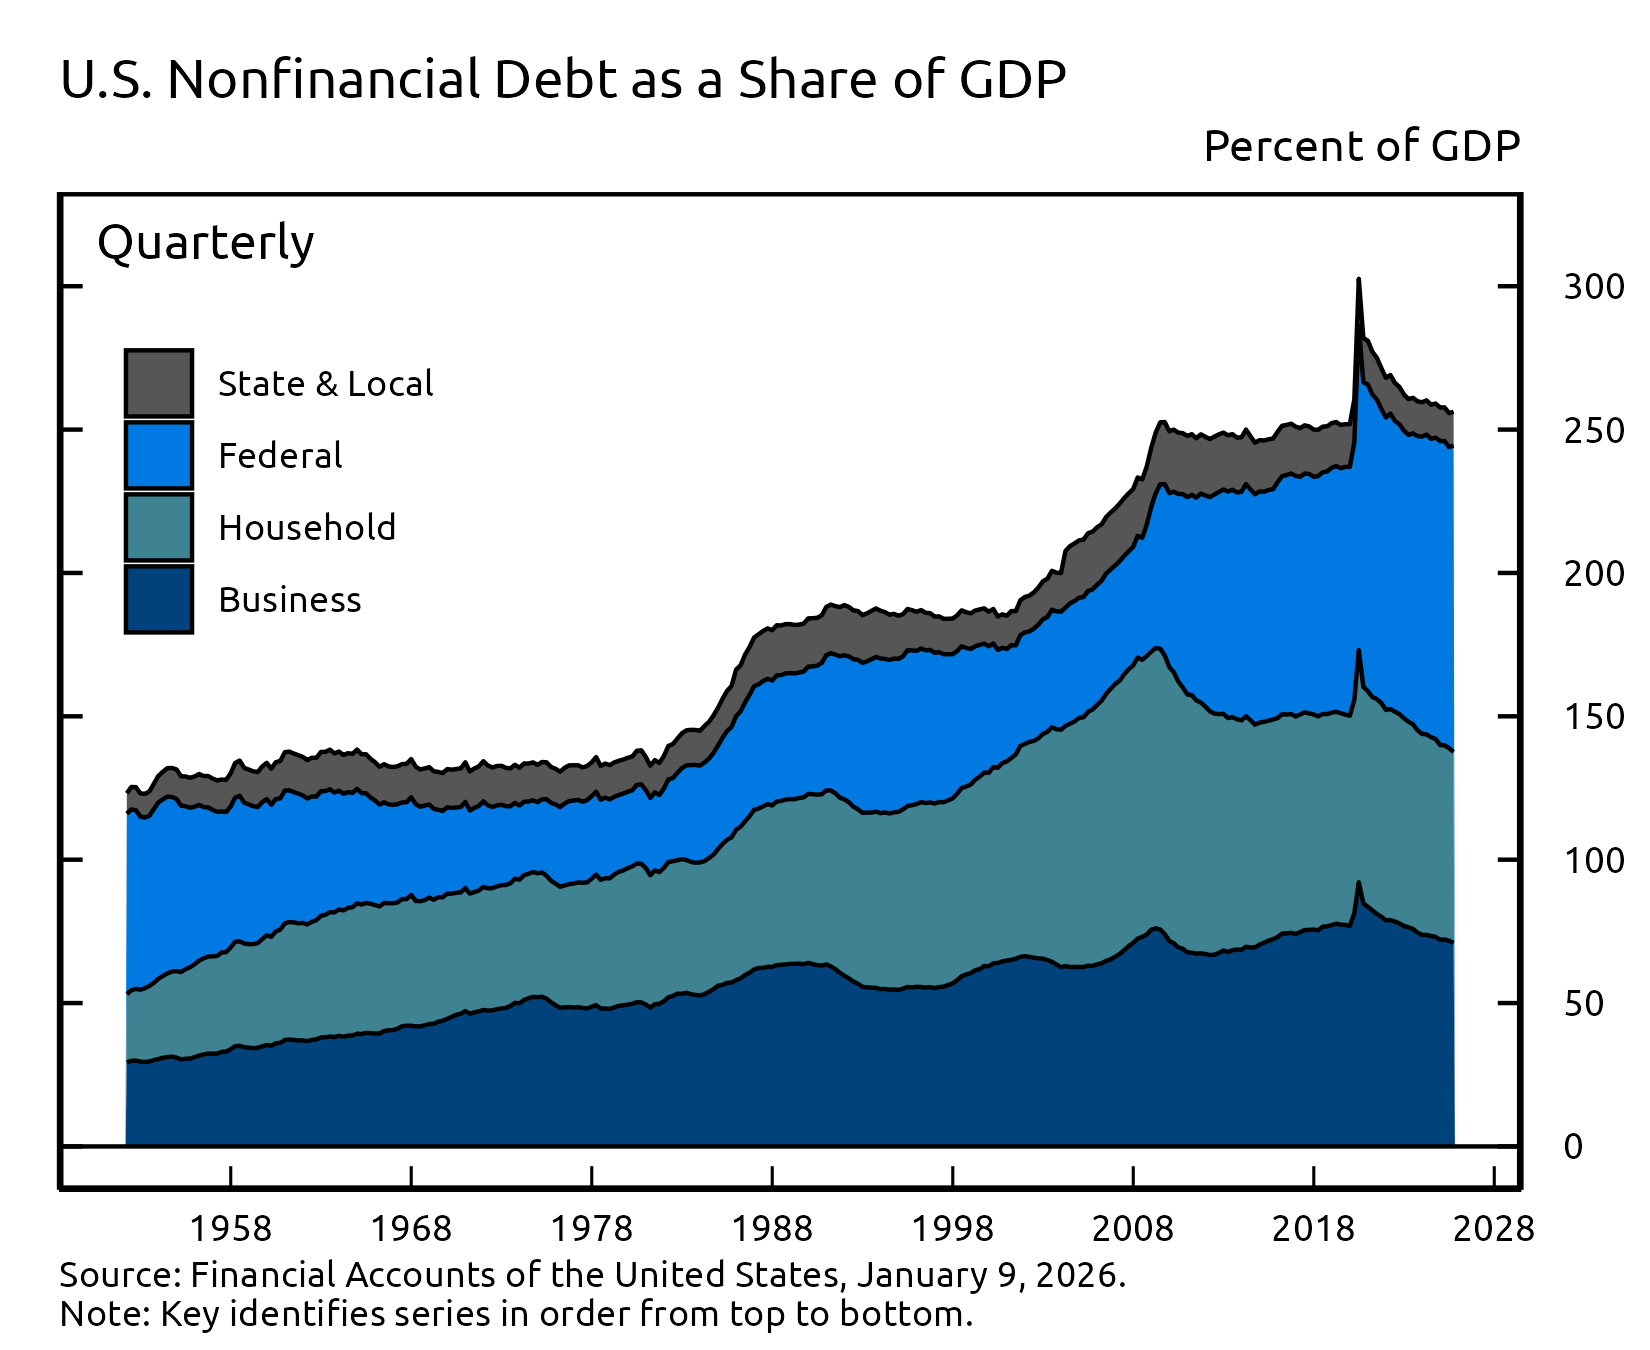
Total domestic nonfinancial debt outstanding (seasonally adjusted) was $79.7 trillion in the third quarter, of which household debt was $20.7 trillion, nonfinancial business debt was $22.1 trillion, and total government debt was $36.9 trillion. The ratio of nonfinancial debt outstanding to GDP was 256% in the third quarter, about the same as in recent quarters. For more data on nonfinancial debt, see table D.1 (rates of debt growth), table D.2 (borrowing), and table D.3 (debt outstanding).
Debt Growth by Sector
| Description | 2023 | 2024 | 2024:Q4 | 2025:Q1 | 2025:Q2 | 2025:Q3 |
|---|---|---|---|---|---|---|
| Total Nonfinancial | 5.08 | 4.75 | 4.20 | 3.49 | 3.14 | 8.79 |
| Households and Nonprofits | 2.75 | 3.10 | 3.32 | 1.85 | 3.92 | 4.07 |
| Nonfinancial Business | 1.93 | 3.08 | 0.92 | 5.14 | 3.99 | 3.93 |
| Federal Government | 9.76 | 7.28 | 7.65 | 3.34 | 1.48 | 15.50 |
| State and Local Governments | 0.49 | 2.75 | -1.03 | 4.20 | 8.48 | 5.49 |
Debt Outstanding by Sector
| Description | 2023 | 2024 | 2024:Q4 | 2025:Q1 | 2025:Q2 | 2025:Q3 |
|---|---|---|---|---|---|---|
| Total Nonfinancial | 73.77 | 76.86 | 76.86 | 77.43 | 77.96 | 79.67 |
| Households and Nonprofits | 19.92 | 20.25 | 20.25 | 20.34 | 20.49 | 20.69 |
| Nonfinancial Business | 20.97 | 21.49 | 21.49 | 21.68 | 21.87 | 22.08 |
| Federal Government | 29.47 | 31.62 | 31.62 | 31.88 | 32.00 | 33.24 |
| State and Local Governments | 3.40 | 3.50 | 3.50 | 3.53 | 3.61 | 3.66 |
Accessible version | CSV | Data Dictionary |
Accessible version | CSV | Data Dictionary |
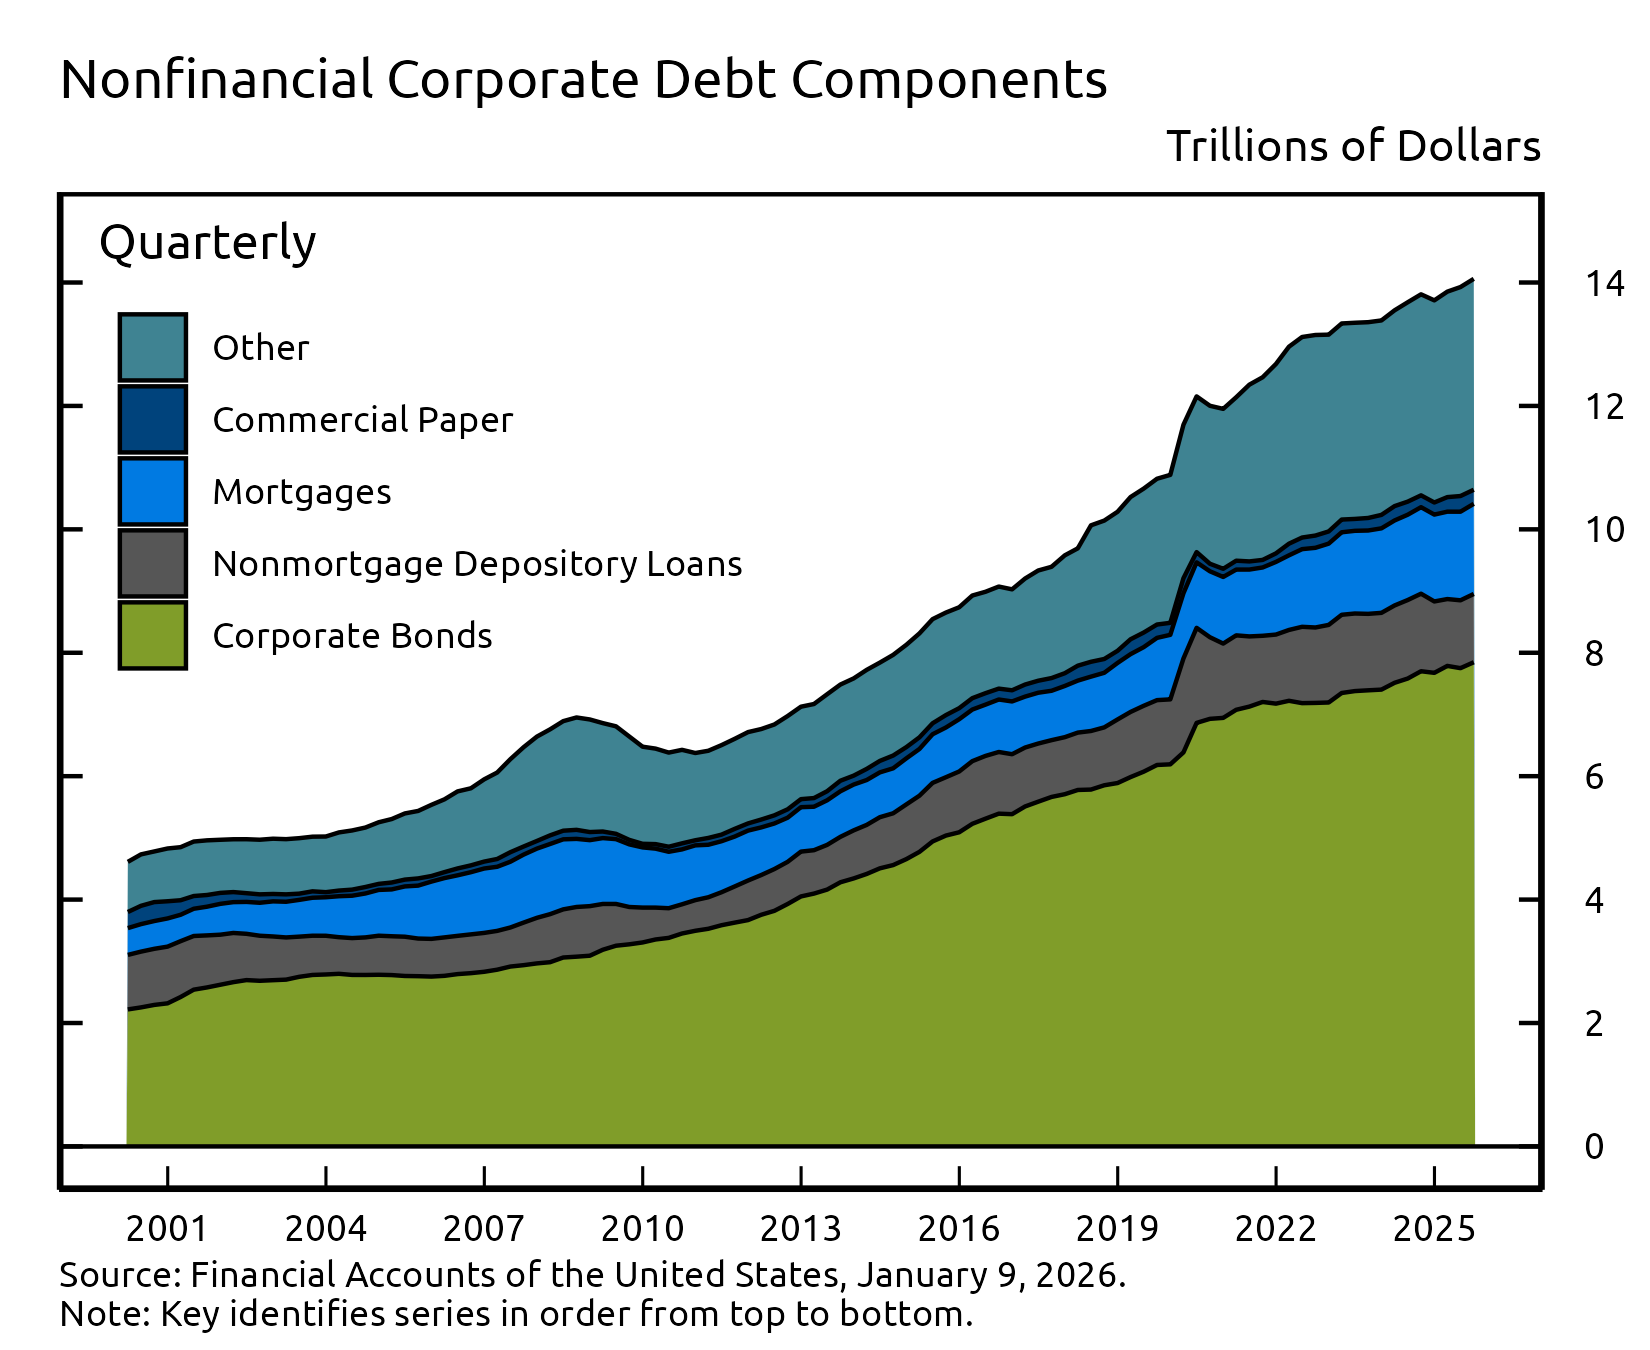
Looking at the components of nonfinancial business debt, corporate bonds increased by about $96 billion in the third quarter while mortgage loans increased by $89 billion. Commercial paper outstanding declined by about $26 billion while nonmortgage loans at depository institutions decreased by about $1 billion. Other nondepository nonmortgage loans rose by $35 billion in the third quarter.
Outstanding nonfinancial corporate debt was $14.1 trillion. Corporate bonds, at roughly $7.8 trillion, accounted for 56% of the total debt. Mortgage loans were about $1.5 trillion, while nonmortgage depository loans were approximately $1.1 trillion. Other types of debt include loans from nondepository financial institutions, loans from the federal government, industrial revenue bonds, and commercial paper.
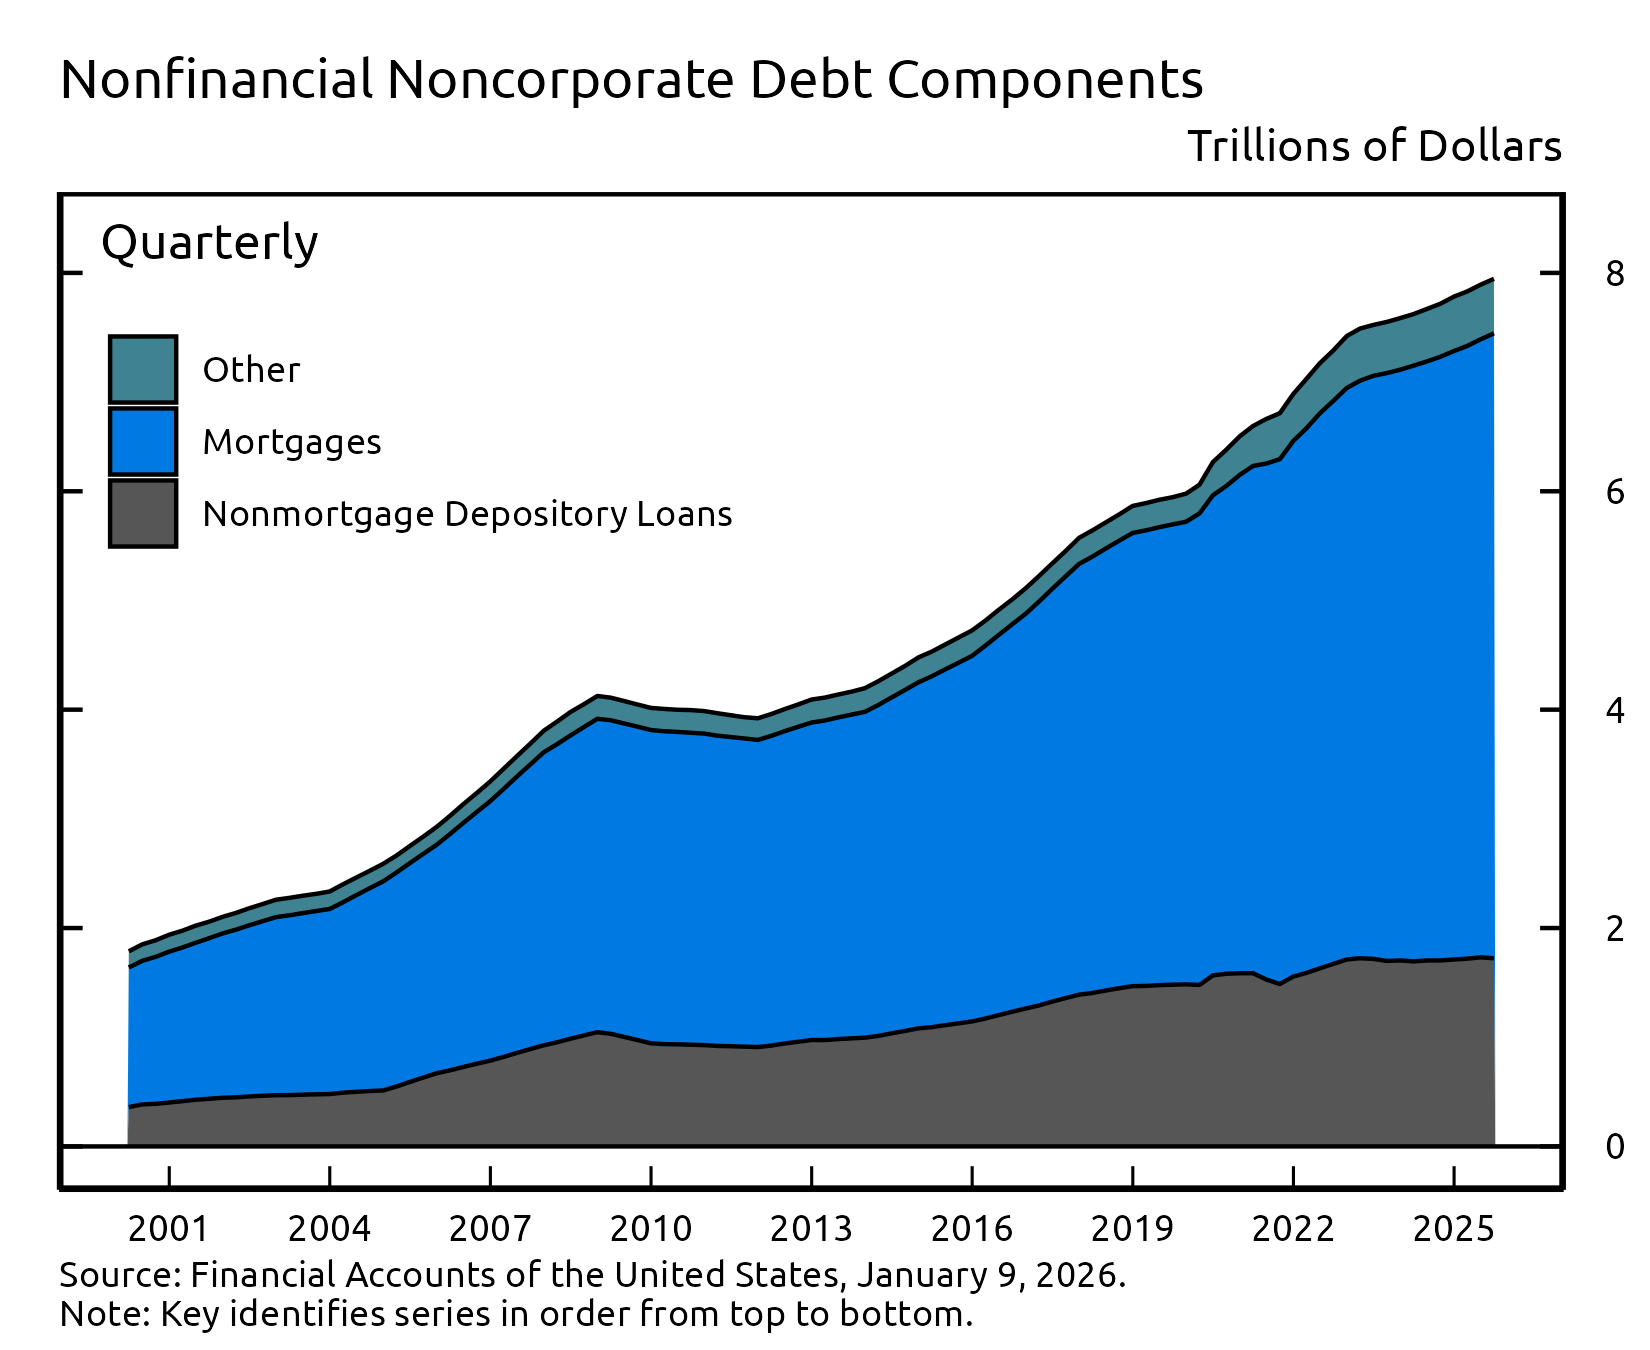
The nonfinancial noncorporate business sector consists mostly of smaller businesses, which are typically not incorporated. Nonfinancial noncorporate business debt was $7.9 trillion in the third quarter. Mortgage loans, at roughly $5.7 trillion, accounted for about 72% of the total, while nonmortgage depository loans ($1.7 trillion) accounted for most of the remainder.
Accessible version | CSV | Data Dictionary |
Accessible version | CSV | Data Dictionary |
For more data on nonfinancial business balance sheets, including debt, see tables B.103 and B.104.
Coming soon
- Enhanced
Financial Accounts Projects will be updated on Friday,
January 16, 2026, including the Distributional Financial
Accounts, which provide a quarterly estimate of the
distribution of U.S. household wealth.
- Financial Accounts data for the fourth quarter of 2025 will be published on Thursday, March 12, 2026, at 12:00 noon.
Chart Notes
- Changes in net worth consist of transactions, revaluations, and other volume changes. Corporate equity and debt securities include directly and indirectly held securities. Real estate is the value of owner-occupied real estate. Other includes equity in noncorporate businesses, consumer durable goods, fixed assets of nonprofit organizations, and all other financial assets apart from corporate equities and debt securities, net of liabilities, as shown on table B.101 Balance Sheet of Households and Nonprofit Organizations.