January 02, 2018
Recent Trends in Small Business Lending and the Community Reinvestment Act 1
Tim Dore and Traci Mach
In this note, we analyze data on small business loan originations collected under the Community Reinvestment Act (CRA) to document heterogeneity in the recovery in small business lending since the financial crisis. Small business loan originations by CRA respondents declined significantly between 2007 and 2010 and, by 2016, have only recovered slightly. However, there is substantial heterogeneity across neighborhood types in small business loan growth since 2010. In particular, neighborhoods outside CRA assessment areas and neighborhoods with a high minority population share have experienced a much stronger recovery than neighborhoods inside assessment areas and low minority-population-share neighborhoods. Despite the stronger growth in these neighborhoods, loan originations in 2016 nevertheless remain lower than their pre-crisis levels for all neighborhood types.
Background on the Community Reinvestment Act
The Congress enacted the CRA in 1977 to encourage federally insured depository institutions to help meet the credit needs of the communities in which they operate, particularly low- and moderate-income (LMI) neighborhoods, consistent with safe and sound operations.2 These local communities, referred to hereafter as CRA assessment areas, are generally identified as the areas where banking institutions have a physical branch office presence and take deposits. LMI neighborhoods have been defined for regulatory purposes as census tracts with a median family income of less than 80 percent of the median family income of the broader area according to decennial census data.3
CRA regulations require larger commercial banks and savings associations to collect and report data regarding the geographic location of their small business lending. As a consequence of amendments to CRA regulations in 2005, banking institutions with assets less than $1.221 billion are no longer required to report data on their small business and small farm lending. However, many smaller institutions still elect to report these data. Analysis of Call Report data indicates that lenders reporting CRA data account for over two-thirds of the dollar volume of small business loans outstanding at all commercial banks and savings associations.
Each reporting bank makes an annual report on the total number and dollar volume of small business loan originations by census tract. As in the Call Report data, small business loans encompass commercial and industrial loans and nonfarm nonresidential property loans whose original amounts are $1 million or less. However, unlike the Call Report data, the CRA data provide information on originations, or the flow, of small business credit rather than the stock of outstanding loan balances.4 The CRA data also provide information on the number and dollar volume of small business loans originated to businesses with revenues of less than $1 million, to the extent that the reporting institution collects such information when making credit decisions.
CRA Small Business Loan Origination Trends
Figure 1 shows that the dollar volume of small business loan originations has barely recovered from effects of the financial crisis. It grew about 31 percent between 2010 and 2016, the latest year for which data are available, but remains approximately 30 percent below the 2007 high. Similarly, after dropping more than 50 percent between 2007 and 2010, originations to the smallest businesses, those with revenues of less than $1 million, grew approximately 26 percent between 2010 and 2016.
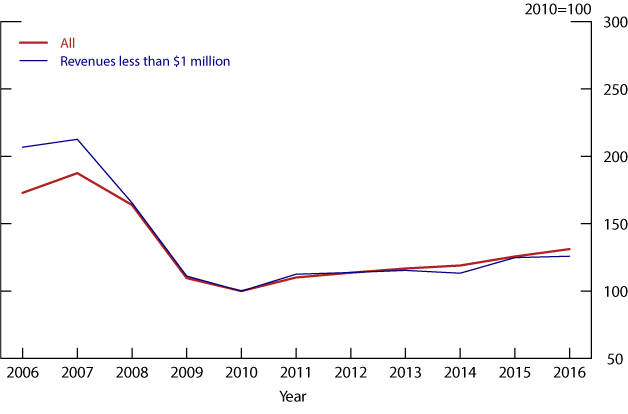
Source: Federal Financial Institutions Examination Council, data reported under the Community Reinvestment Act.
Figure 2 disaggregates these two measures of small business originations by whether loans were made in a bank's CRA assessment area and whether loans were made in LMI neighborhoods. Both panels show stronger recovery in small business loan origination volume outside of assessment areas. Origination volumes were about 68 percent higher outside assessment areas in 2016 relative to 2010, while they were 21 percent higher inside assessment areas over that same time period. The disparity was slightly starker for originations to firms with revenues less than $1 million.
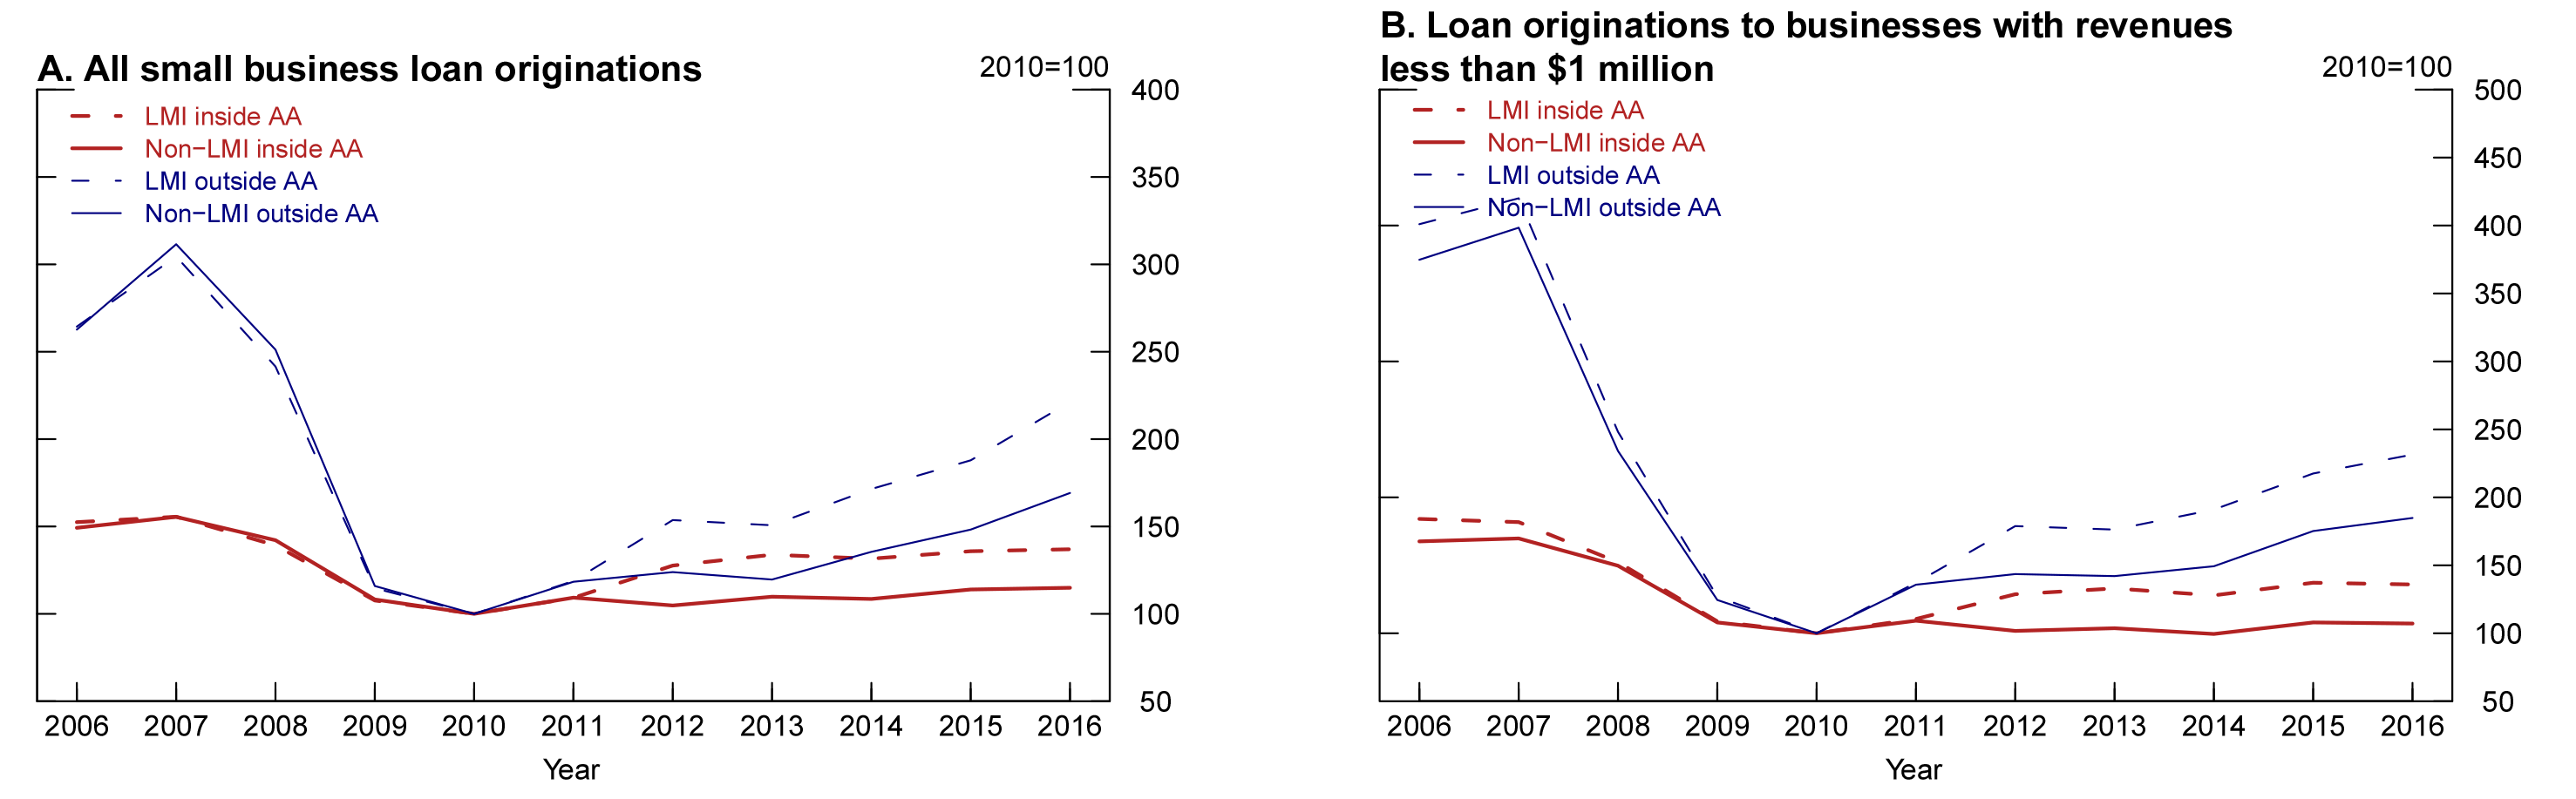
Note: LMI is low and moderate income; AA is assessment area.
Source: Federal Financial Institutions Examination Council, data reported under the Community Reinvestment Act.
While loan origination growth has been stronger outside of assessment areas since 2010, these areas also experienced a significantly steeper decline in lending during the financial crisis. As a result, in 2016, origination volume was 23 percent below 2007 levels inside assessment areas and 43 percent below outside assessment areas. The trend in recovery in lending has been similar across LMI and non-LMI neighborhoods inside and outside of assessment areas, although the recovery outside assessment areas has rebounded a bit more.
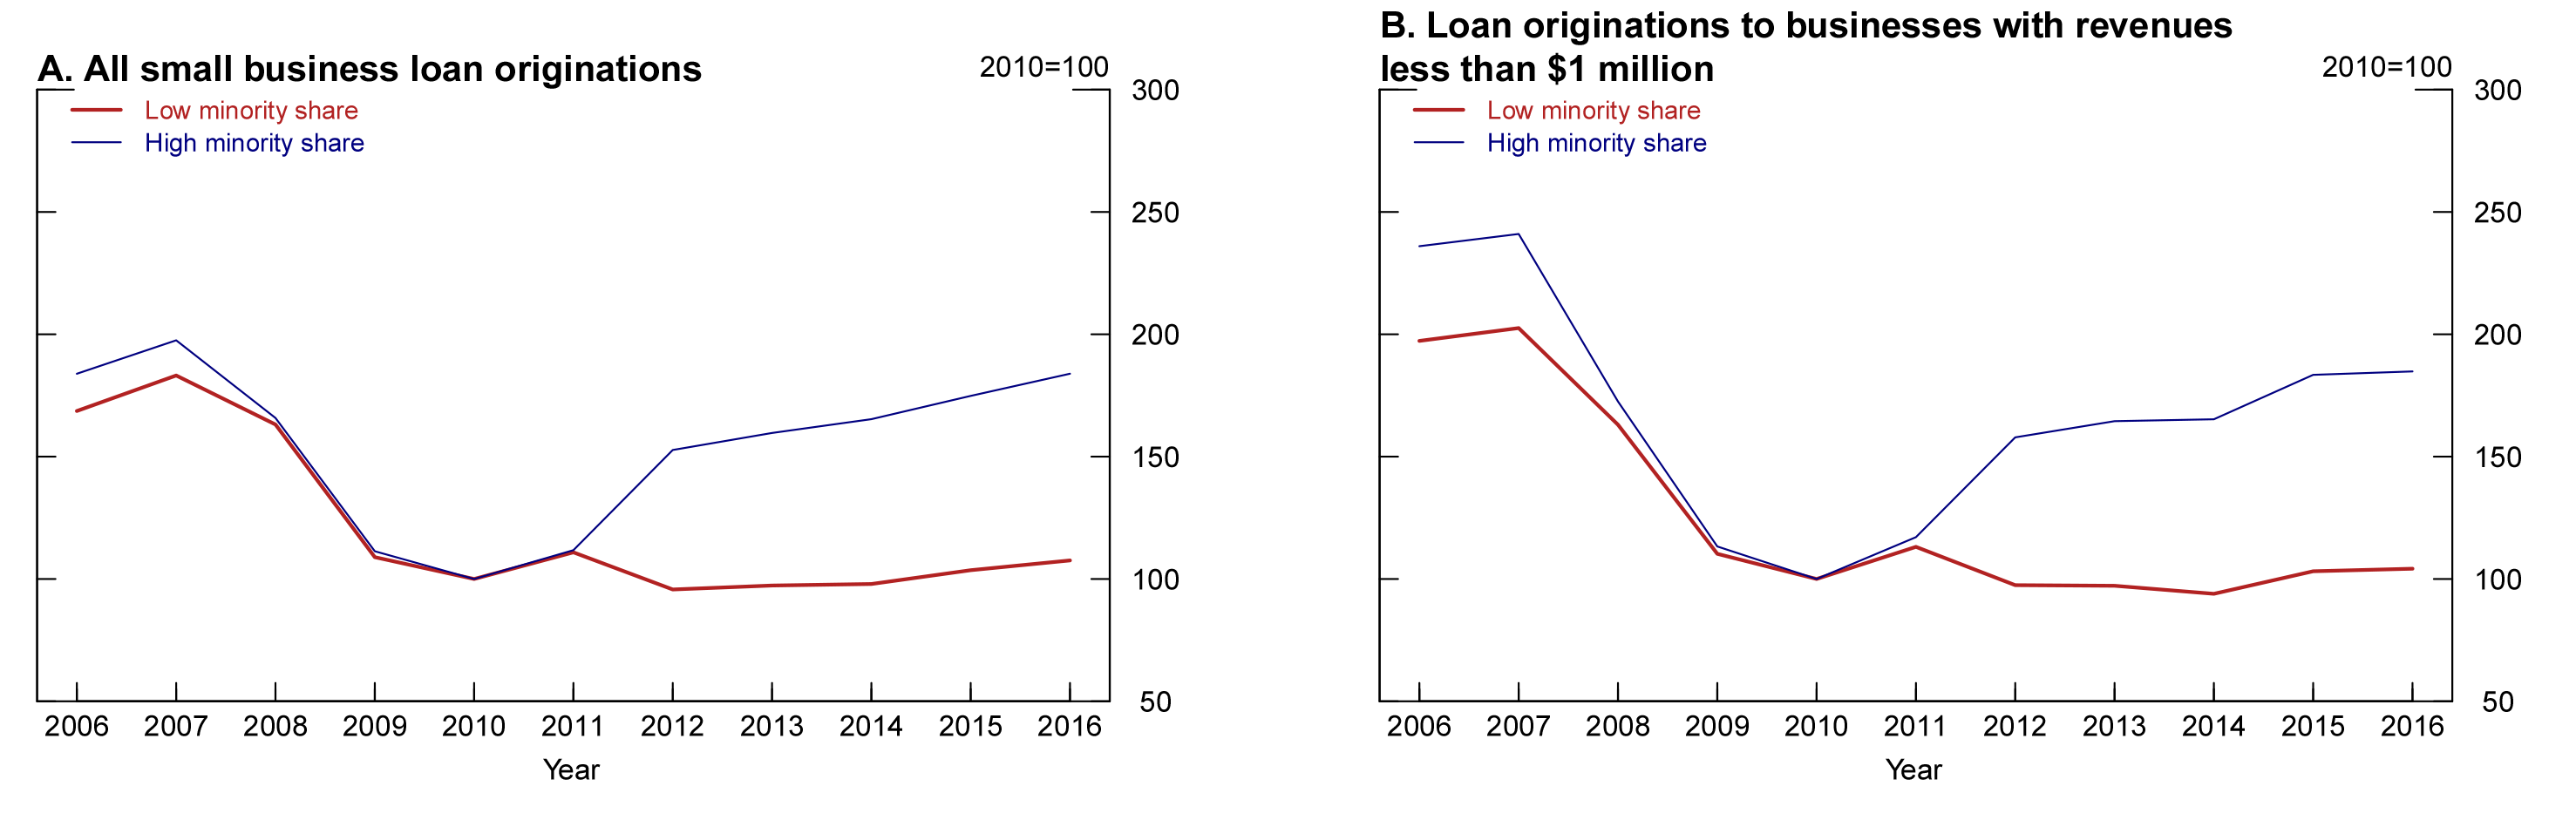
Figure 3 displays the trend in lending across neighborhoods with higher (at least 30 percent) and lower (less than 30 percent) shares of minority residents. Since 2010, higher-minority-share-neighborhoods have experienced higher growth in origination volume. As a result, while the origination amounts in lower-minority-share neighborhoods are approximately 8 percent higher in 2016 than in 2010, they are 84 percent higher for higher-minority-share neighborhoods. The trend is similar for loans to the smallest businesses--those businesses with revenues less than $1 million.
Note: LMI is low and moderate income; AA is assessment area.
Source: Federal Financial Institutions Examination Council, data reported under the Community Reinvestment Act.
Table 1 provides additional data on small business lending in LMI versus non-LMI neighborhoods, and inside versus outside of CRA assessment areas. The top panel shows data for 2010, while the bottom panel shows data for 2016. Comparing across columns, the volume of lending is considerably higher in non-LMI neighborhoods than in LMI neighborhoods in both years, reflecting, at least in part, that roughly three-fourths of the population reside in non-LMI neighborhoods.
Within each income group, assessment area lending generally exceeds non-assessment area lending in dollar terms, but not in terms of the number of loans. This pattern results from specialized credit card lending institutions making up a large portion of non-assessment area lending. A dozen or so such institutions issue business cards nationwide but generally do not have an extensive network of bank branches and therefore have limited CRA assessment areas. Comparing LMI with non-LMI areas, Table 1 indicates that credit card lenders made up a larger share of loan origination volume in non-LMI areas than in LMI areas in both 2010 (9.1 percent versus 6.9 percent) and 2016 (21.7 percent versus 19.0 percent).
Finally, Table 1 also shows the share of small business lending by banks in the top 10 banking organizations according to total assets, by neighborhood income group. These data reveal that the top 10 organizations accounted for just under one-third of dollars loaned in both LMI and non-LMI neighborhoods in both 2010 and 2016.5
Table 1. Small business lending, by neighborhood income and assessment area status, 2010 and 2016
| Category | LMI | Non-LMI | Total1 | ||||
|---|---|---|---|---|---|---|---|
| Inside AA | Outside AA | Total | Inside AA | Outside AA | Total | ||
| 2010 | |||||||
| Small business loans | |||||||
| Dollar volume (millions) | 31,080 | 6,516 | 37,596 | 105,254 | 29,408 | 134,662 | 174,818 |
| Share by credit card lender (percent) | 0.1 | 39.3 | 6.9 | 0.0 | 41.5 | 9.1 | 8.5 |
| Share by top 10 bank organizations (percent) | 36.8 | 7.8 | 31.7 | 35.8 | 9.9 | 30.1 | 30.0 |
| Number of loans (thousands) | 268 | 471 | 739 | 1,087 | 2,263 | 3,350 | 4,215 |
| Average loan amount (thousands) | 115.8 | 13.8 | 50.8 | 96.8 | 13.0 | 40.2 | 41.5 |
| Loans to businesses with revenues less than $1 million | |||||||
| Dollar volume (millions) | 9,846 | 1,902 | 11,748 | 42,194 | 9,507 | 51,701 | 64,579 |
| Share of all (percent) | 31.7 | 29.2 | 31.2 | 40.1 | 32.3 | 38.4 | 36.9 |
| Share by credit card lender (percent) | 0.0 | 20.6 | 3.3 | 0.0 | 22.3 | 4.1 | 3.9 |
| Share by top 10 bank organizations (percent) | 34.9 | 10.5 | 31.0 | 36.0 | 13.3 | 31.9 | 31.1 |
| Number of loans (thousands) | 145 | 105 | 249 | 678 | 516 | 1,194 | 1,490 |
| Average loan amount (thousands) | 68.0 | 18.2 | 47.1 | 62.3 | 18.4 | 43.3 | 43.3 |
| 2016 | |||||||
| Small business loans | |||||||
| Dollar volume (millions) | 42,567 | 14,418 | 56,985 | 120,954 | 49,748 | 170,702 | 229,278 |
| Share by credit card lender (percent) | 10.8 | 42.5 | 19.0 | 11.5 | 46.5 | 21.7 | 20.9 |
| Share by top 10 bank organizations (percent) | 33.3 | 8.9 | 27.1 | 34.7 | 10.7 | 27.7 | 20.9 |
| Number of loans (thousands) | 554 | 803 | 1,357 | 1,756 | 2,920 | 4,675 | 6,106 |
| Average loan amount (thousands) | 76.8 | 18.0 | 42.0 | 68.9 | 17.0 | 36.5 | 37.5 |
| Loans to businesses with revenues less than $1 million | |||||||
| Dollar volume (millions) | 13,382 | 4,403 | 17,785 | 45,216 | 17,572 | 62,787 | 81,274 |
| Share of all (percent) | 31.4 | 30.5 | 31.2 | 37.4 | 35.3 | 36.8 | 35.4 |
| Share by credit card lender (percent) | 13.0 | 51.6 | 22.5 | 14.4 | 54.0 | 25.5 | 24.6 |
| Share by top 10 bank organizations (percent) | 31.2 | 12.8 | 26.7 | 34.0 | 15.1 | 28.7 | 28.0 |
| Number of loans (thousands) | 320 | 327 | 647 | 1,081 | 1,297 | 2,378 | 3,052 |
| Average loan amount (thousands) | 41.9 | 13.4 | 27.5 | 41.8 | 13.5 | 26.4 | 26.6 |
Conclusion
Data from the CRA on small business loan originations highlight significant heterogeneity in the recovery following the financial crisis. While loan origination activity remains well below pre-crisis levels, the recovery has been stronger outside of CRA assessment areas and in neighborhoods with a high minority population share. There are many possible factors, on both the demand side and the supply side, that account for the divergent growth rates in the past several years across these geographical areas and understanding these factors would improve our understanding of the weak growth in aggregate small business lending activity since the financial crisis.
1. This note is largely based on findings reported in Board of Governors (2017) Report to the Congress on the Availability of Credit to Small Businesses. Washington: Board of Governors, September, https://www.federalreserve.gov/publications/files/sbfreport2017.pdf. Return to text
2. For more information about the CRA background and requirements, refer to https://www.ffiec.gov/cra/. Return to text
3. For census tracts in an MSA, the MSA would be considered the broader area. For census tracts outside of an MSA, all non-MSA counties within the same state would be considered the broader area. Return to text
4. For credit cards and lines of credit in the CRA data, banks report new and renewed line sizes (the maximum amount of available credit) as the amount originated. More details on CRA reporting requirements and standards are available on the Federal Financial Institutions Examination Council's website at https://www.ffiec.gov/cra/default.htm. Return to text
5. It is important to keep in mind that the CRA data exclude a large number of smaller banks that may account for a significant number of loans, and, therefore, the share of lending attributed to the top 10 organizations is overstated in the CRA data. Return to text
Dore, Tim, and Traci Mach (2018). "Recent Trends in Small Business Lending and the Community Reinvestment Act," FEDS Notes. Washington: Board of Governors of the Federal Reserve System, January 2, 2018, https://doi.org/10.17016/2380-7172.2122.