


Financial Accounts of the United States - Z.1
Recent Developments RSS Data Download
The recent developments discussed below refer to data through June 30, 2026.
The net worth of households and nonprofit organizations increased by $12.8 trillion in the second quarter of 2026, primarily driven by strong capital gains on corporate equity assets.
The debt of households and nonprofit organizations increased 5.0% at a seasonally adjusted annual rate in the second quarter as the pace of mortgage borrowing picked up and nonmortgage consumer credit continued to grow at a moderate pace.
Domestic nonfinancial business debt expanded 4.6% at a seasonally adjusted annual rate in the second quarter, reflecting solid growth in corporate bonds and loan liabilities.
Household net worth
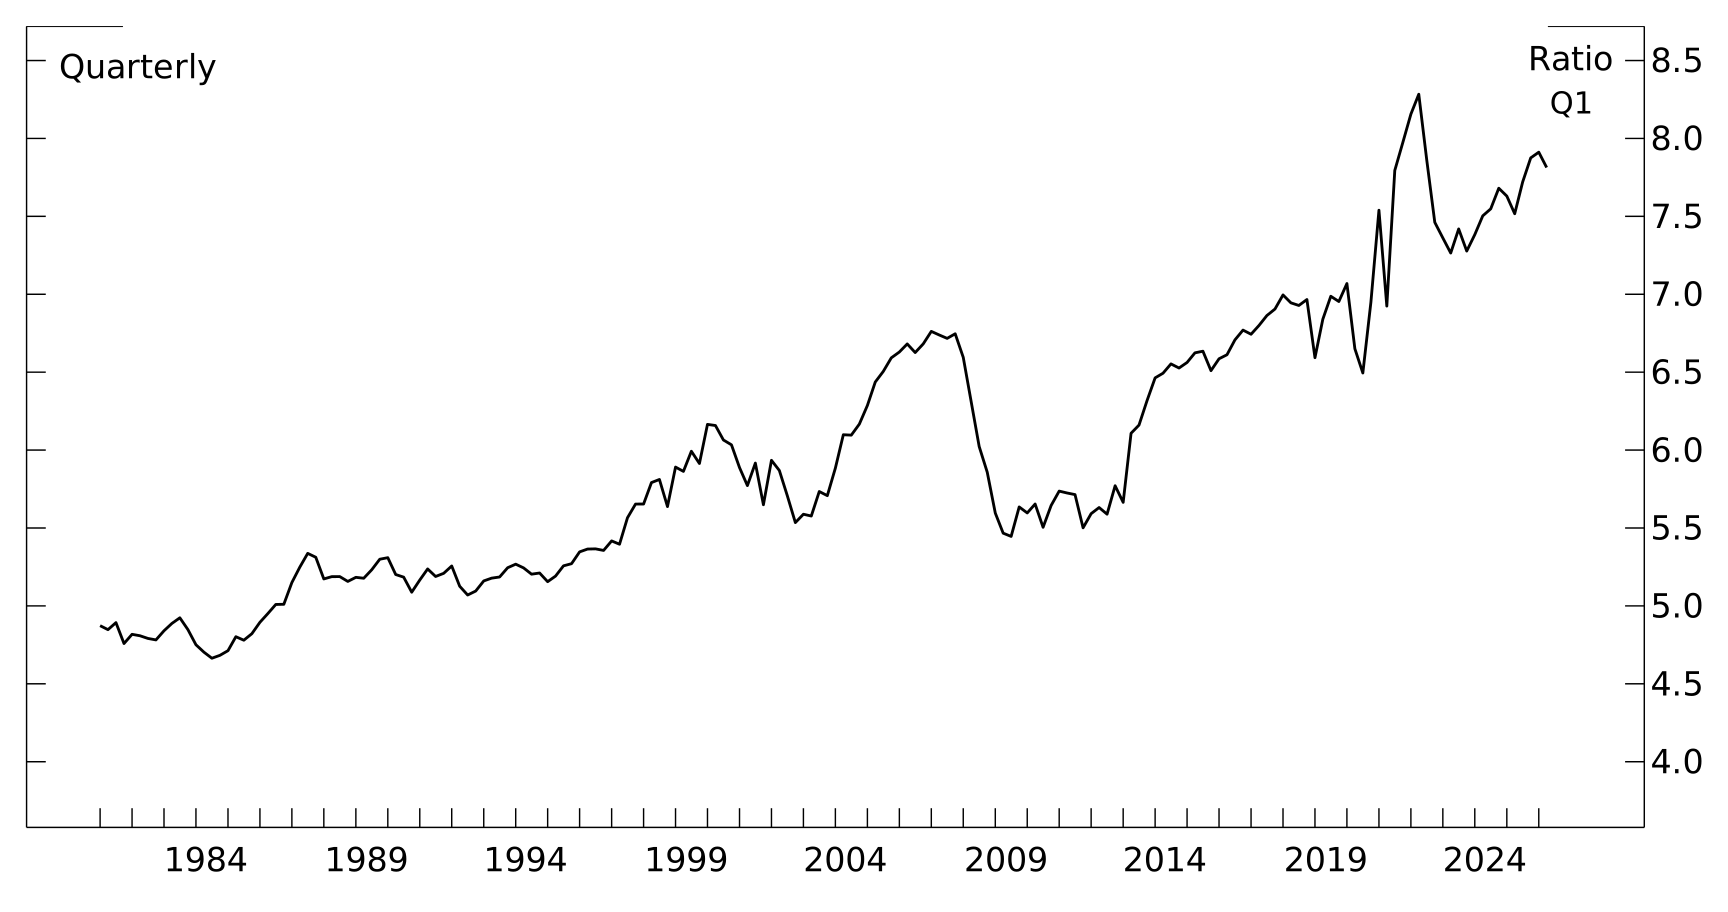
The net worth of households and nonprofit organizations – the difference between the value of total assets and liabilities (figure 1) – increased by $12.8 trillion to $195.9 trillion in the second quarter.1 The ratio of net worth to disposable personal income (DPI), a measure of households’ potential to finance consumption out of their wealth, reached a record high of 8.28 in the second quarter (figure 2), surpassing the previous peak recorded in 2022:Q1.
Figure 1: Household balance sheet
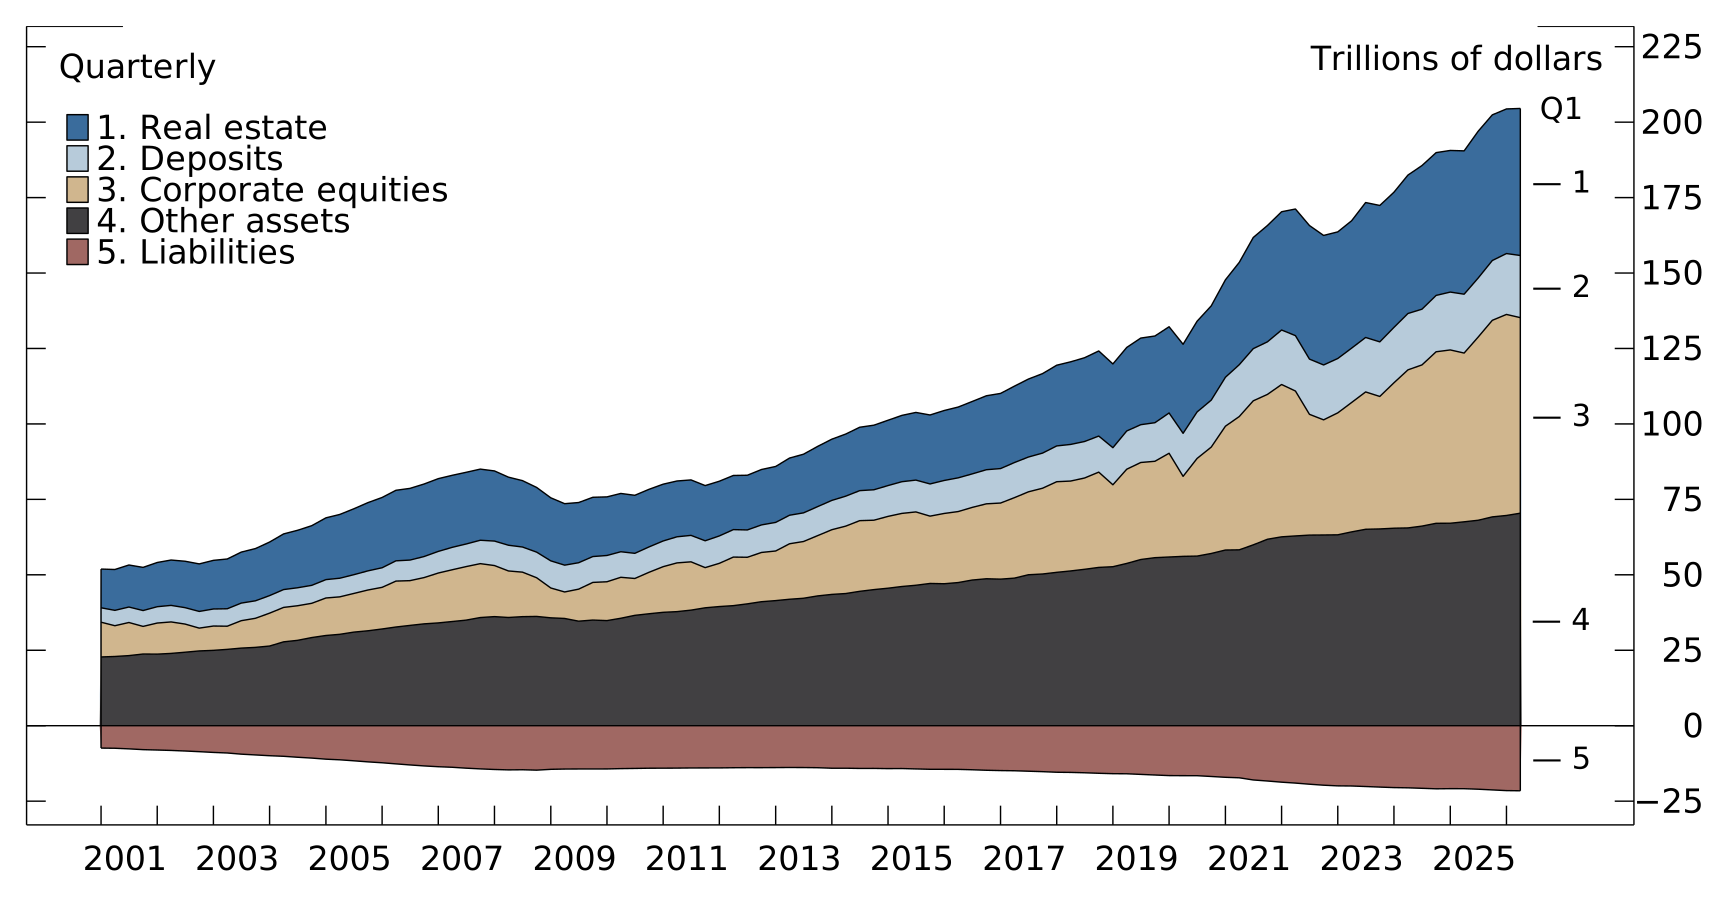
Note: Liabilities are shown as negative values. Corporate equities and debt securities include both directly held securities and securities held indirectly in mutual funds, defined contribution pension plans, and variable life insurance and annuity products. Deposits include money market fund shares. Real estate is the value of owner-occupied real estate. Other assets include consumer durable goods, fixed assets of nonprofit organizations, equity in noncorporate business, hedge fund shares, and all other assets apart from those shown.
Source: Financial Accounts of the United States, September 11, 2026.
Figure 2: Ratio of household net worth to DPI
Source: Financial Accounts of the United States, September 11, 2026.
Accessible version | CSV | Data DictionaryTable 1: Condensed household balance sheet
Trillions of dollars
| 2022 | 2023 | 2024 | 2025 | 2026:Q1 | 2026:Q2 | |
|---|---|---|---|---|---|---|
| Assets | 162.8 | 175.9 | 189.5 | 203.8 | 204.7 | 217.8 |
| Nonfinancial assets | 54.7 | 57.6 | 60 | 61.7 | 62.9 | 64.3 |
| Owner-occupied real estate | 41.9 | 44.7 | 46.9 | 47.9 | 48.7 | 49.8 |
| Other nonfinancial assets | 12.8 | 12.9 | 13.1 | 13.8 | 14.2 | 14.5 |
| Financial assets | 108.1 | 118.3 | 129.5 | 142.1 | 141.8 | 153.5 |
| Deposits and money market funds | 17.9 | 18.2 | 18.9 | 19.9 | 20.3 | 20.3 |
| Debt securities | 9.2 | 10.6 | 11 | 11.8 | 11.8 | 12.2 |
| Corporate equities | 38.6 | 46.3 | 55.2 | 64.5 | 63.3 | 74 |
| Equity in noncorporate business | 16 | 15.8 | 16 | 16.3 | 16.6 | 16.8 |
| Defined benefit pension entitlements | 15.6 | 16.1 | 16.4 | 16.6 | 16.7 | 16.7 |
| Other financial assets | 10.8 | 11.4 | 12 | 12.9 | 13.1 | 13.5 |
| Liabilities | 19.7 | 20.3 | 20.8 | 21.5 | 21.6 | 21.9 |
| One-to-four-family residential mortgages | 12.7 | 13 | 13.4 | 13.8 | 13.8 | 14 |
| Consumer credit | 4.9 | 5 | 4.9 | 5.1 | 5.1 | 5.1 |
| Other liabilities | 2.2 | 2.3 | 2.4 | 2.6 | 2.7 | 2.8 |
| Net worth | 143.1 | 155.7 | 168.7 | 182.3 | 183.1 | 195.9 |
Source: Financial Accounts of the United States, September 11, 2026.
The major components of household wealth are shown in table 1. On the asset side of the household balance sheet, owner-occupied real estate ($49.8 trillion) accounts for most nonfinancial assets. Financial assets include deposits and money market funds ($20.3 trillion), directly and indirectly held equity shares ($74.0 trillion) and debt securities ($12.2 trillion), and other assets such as equity in noncorporate business ($16.8 trillion) and defined benefit pension plan entitlements ($16.7 trillion).2 On the liability side, home mortgages ($14.0 trillion) and consumer credit ($5.1 trillion) account for most of household debt.3 For more detailed data on household balance sheets, see tables S1M.b and S1M.e.b.
The $12.8 trillion increase in household net worth in the second quarter reflects both net transactions and revaluations.4 Transactions occur when households purchase or sell assets, or when they incur or pay down liabilities. Revaluations arise from changes in the market value of assets that households already own—for example, when stock prices or real estate prices change. In the second quarter, the value of directly and indirectly held equity increased by $10.7 trillion, deposits decreased by $0.1 trillion, and the value of real estate increased by $1.1 trillion. For more details on changes in household net worth, see table S1M.r.
Changes in household net worth are often driven by revaluations of corporate equity and real estate, which represent the largest components of household wealth. Because the ownership of such assets—particularly equities—is concentrated among higher-income households, not all households are equally impacted by changes in asset prices. For more information on the distribution of household wealth, see the Distributional Financial Accounts.
Figure 3: Changes in household net worth
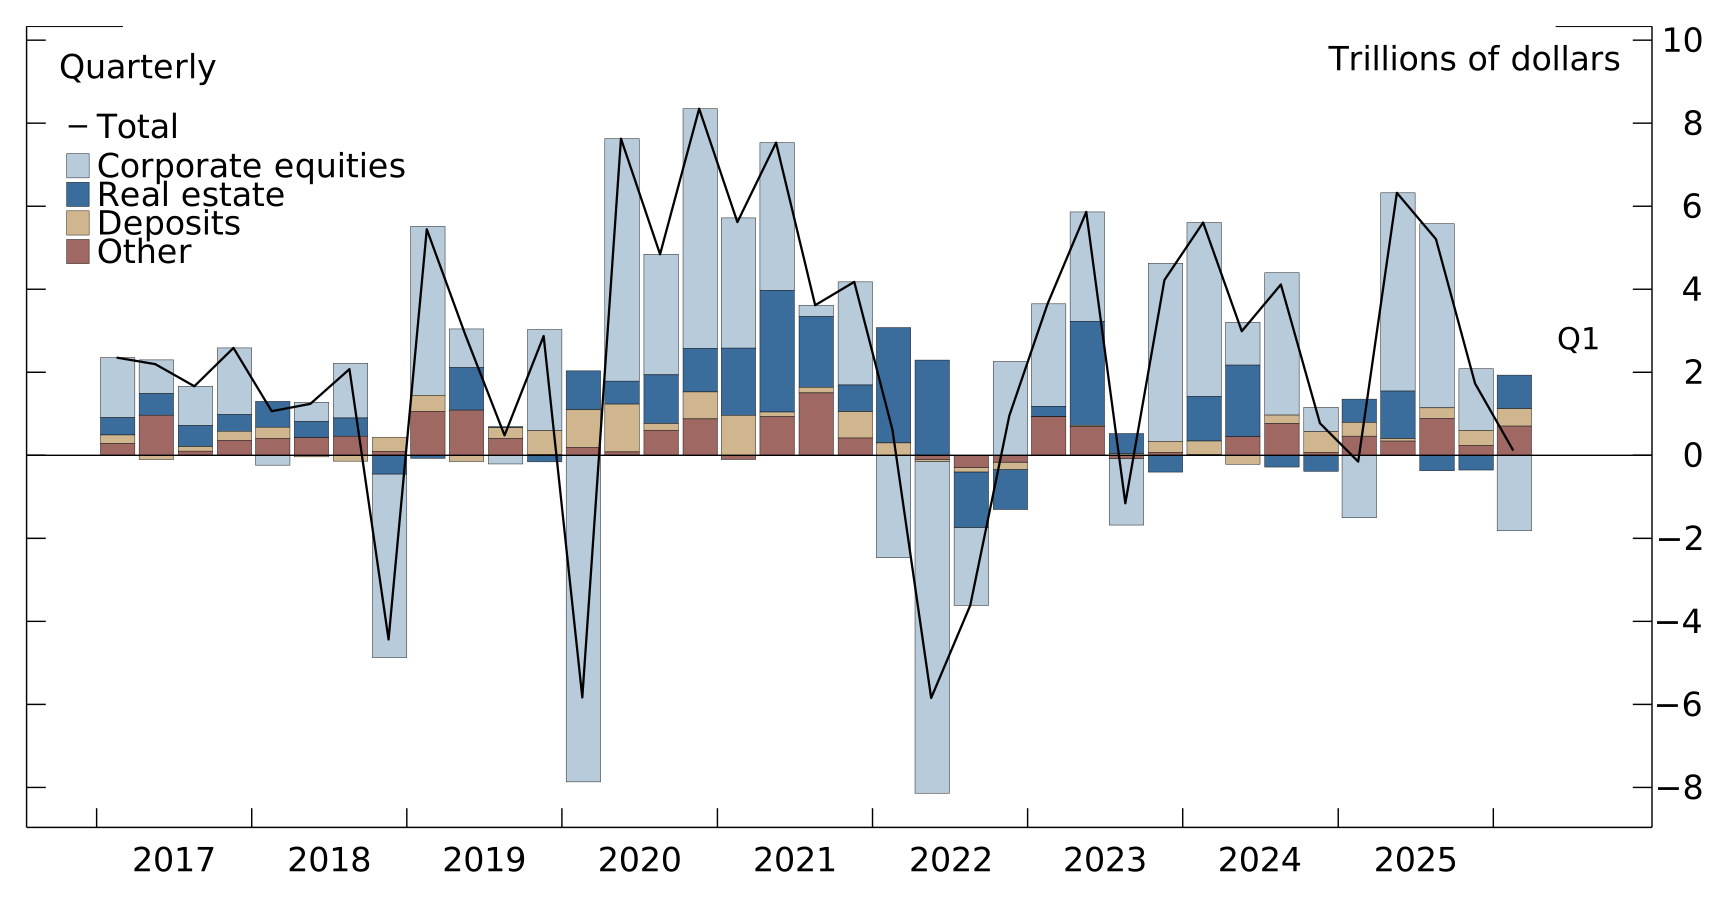
Note: Corporate equities include both directly held securities and securities held indirectly in mutual funds, defined contribution pension plans, and variable life insurance and annuity products. Deposits include money market fund shares. Real estate is owner-occupied real estate. Other includes consumer durable goods, fixed assets of nonprofit organizations, equity in noncorporate business, hedge fund shares, and all other assets apart from those shown, net of liabilities.
Source: Financial Accounts of the United States, September 11, 2026.
Total domestic nonfinancial debt
Total domestic nonfinancial debt expanded 5.2% in the second quarter (this and subsequent rates of growth are reported at a seasonally adjusted annual rate), consistent with its average post-coronavirus (COVID-19) pandemic pace.5
Table 2: Growth of domestic nonfinancial debt by sector
Percent change, seasonally adjusted annual rate
| 2022 | 2023 | 2024 | 2025 | 2025:Q4 | 2026:Q1 | 2026:Q2 | |
|---|---|---|---|---|---|---|---|
| Total | 6 | 5.2 | 4.9 | 5.3 | 5 | 5.9 | 5.2 |
| Households | 7.3 | 2.8 | 2.8 | 3.4 | 3.1 | 3.5 | 5 |
| Nonfinancial business | 5.9 | 2.4 | 3.8 | 4.5 | 3 | 7 | 4.6 |
| Corporate | 5 | 2.4 | 4.2 | 4.9 | 1.7 | 8.4 | 5.5 |
| Noncorporate | 7.6 | 2.4 | 3 | 3.9 | 5.5 | 4.6 | 2.8 |
| Federal government | 6.1 | 9.8 | 7.3 | 7.3 | 8.1 | 6.7 | 5.2 |
| State and local governments | -1.1 | 0.6 | 2.8 | 4.6 | 0.4 | 6.1 | 9.1 |
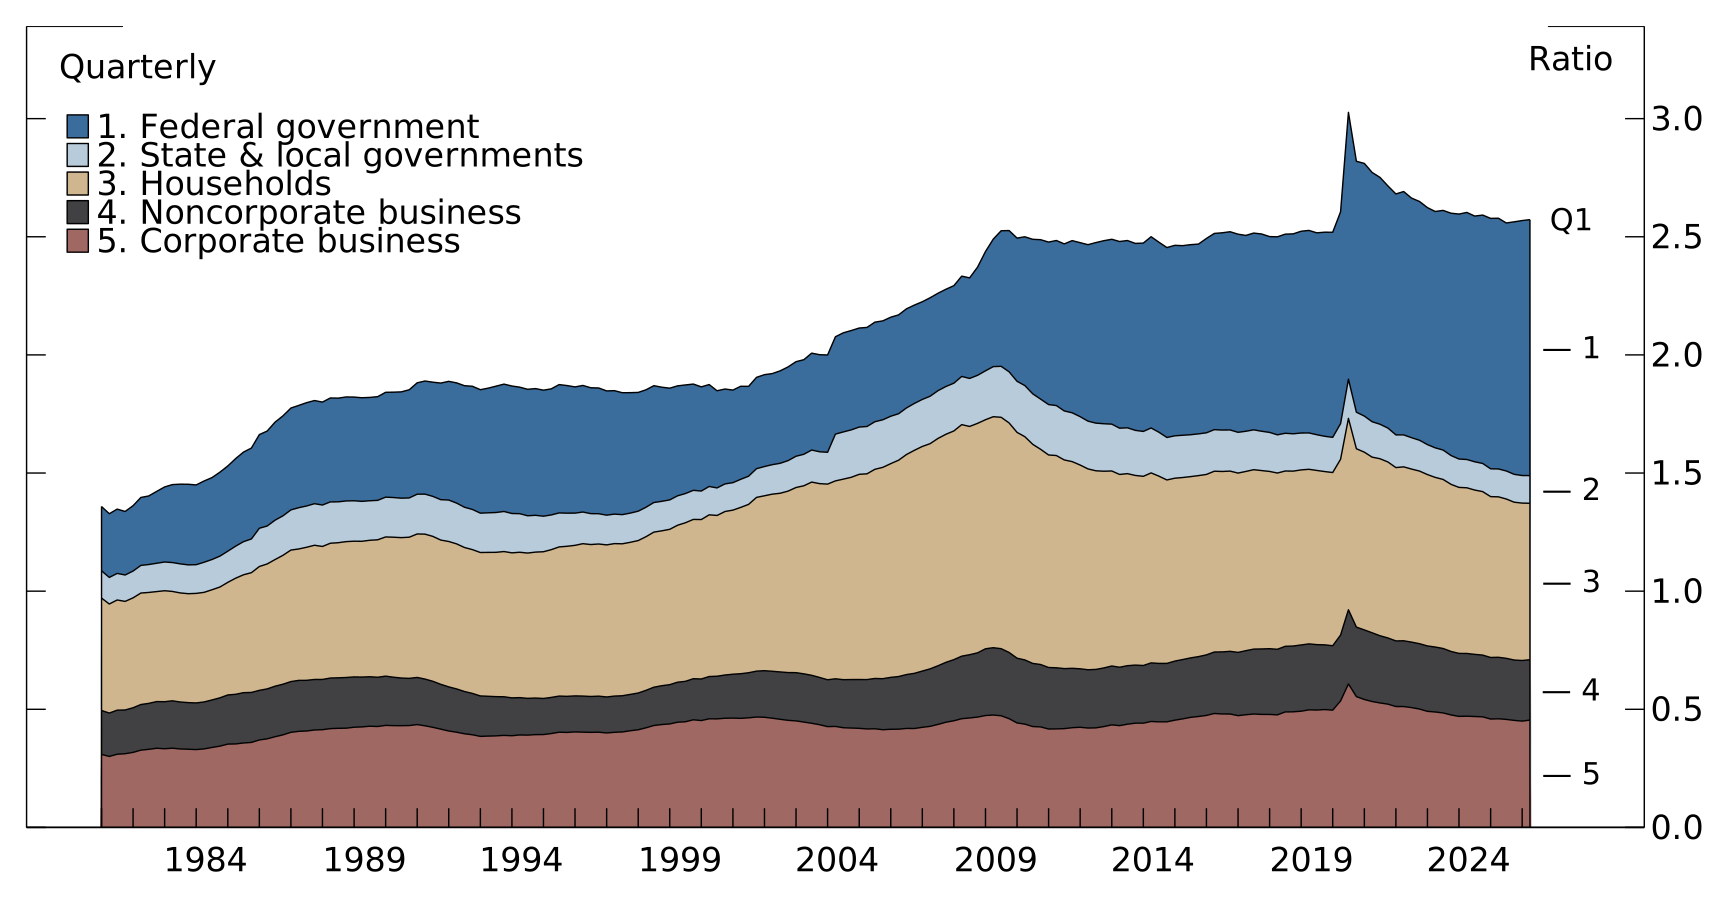
Domestic nonfinancial debt outstanding was $84.1 trillion at the end of the second quarter, of which household debt was $21.4 trillion, nonfinancial business debt was $24.0 trillion, and total government debt was $38.7 trillion. The ratio of total nonfinancial debt to gross domestic product (GDP) stayed flat at 2.59 in the second quarter (figure 4). The ratio has declined substantially since its pandemic-related spike in 2020, but remains slightly above its pre-pandemic average. For more data on nonfinancial debt, see tables D3.g, D3.t, and D3.s.
Table 3: Domestic nonfinancial debt outstanding by sector
Trillions of dollars, seasonally adjusted
| 2022 | 2023 | 2024 | 2025 | 2026:Q1 | 2026:Q2 | |
|---|---|---|---|---|---|---|
| Total | 70.6 | 74.3 | 77.7 | 81.8 | 83 | 84.1 |
| Households | 19.2 | 19.7 | 20.2 | 20.9 | 21.1 | 21.4 |
| Business | 21.2 | 21.7 | 22.4 | 23.3 | 23.7 | 24 |
| Corporate | 13.8 | 14.1 | 14.5 | 15.2 | 15.5 | 15.7 |
| Noncorporate | 7.4 | 7.6 | 7.8 | 8.1 | 8.2 | 8.3 |
| Federal government | 26.9 | 29.5 | 31.6 | 33.9 | 34.5 | 34.9 |
| State and local governments | 3.4 | 3.4 | 3.5 | 3.7 | 3.7 | 3.8 |
Figure 4: Ratio of nonfinancial debt to GDP
Source: Financial Accounts of the United States, September 11, 2026.
Accessible version | CSV | Data DictionaryHousehold debt
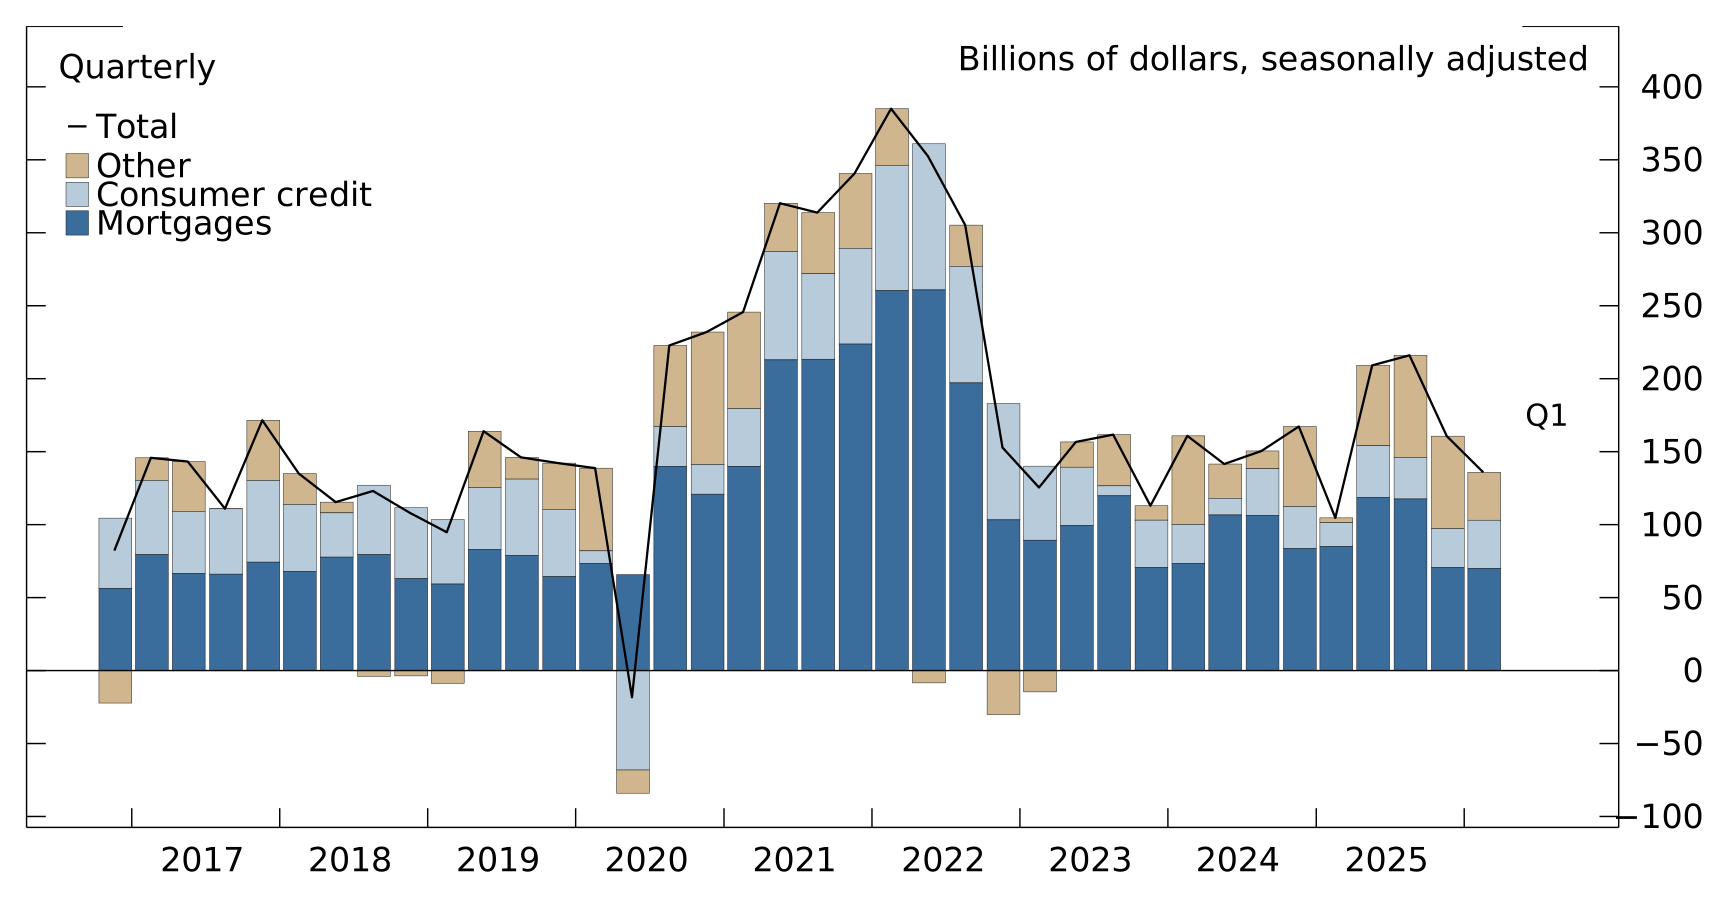
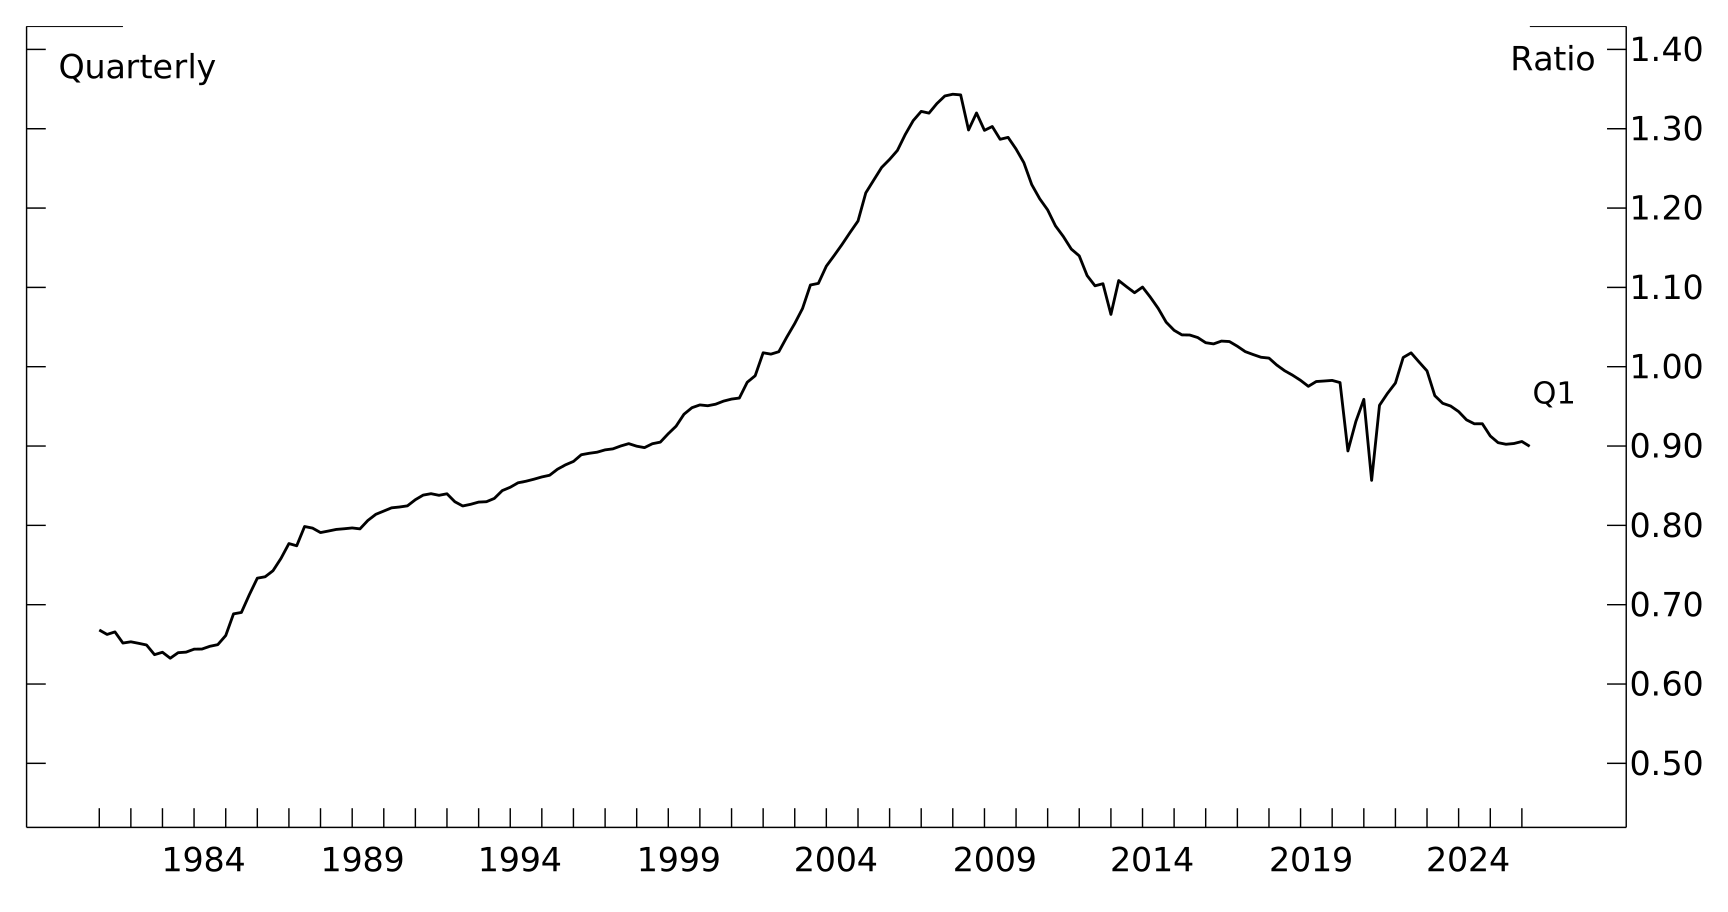
Household debt expanded rapidly in the immediate aftermath of the pandemic, but the pace of growth has slowed substantially over the past few years. In the second quarter, household debt increased by 5.0% as the pace of mortgage borrowing picked up and nonmortgage consumer credit continued to grow at a moderate pace (figure 5). The ratio of household debt to DPI (figure 6) remained flat at 0.90, near its lowest level since the late 1990s (excluding the pandemic-related income effects in 2020 and 2021).
Figure 5: Changes in household debt
Source: Financial Accounts of the United States, September 11, 2026.
Accessible version | CSV | Data DictionaryFigure 6: Ratio of household debt to DPI
Source: Financial Accounts of the United States, September 11, 2026.
Accessible version | CSV | Data DictionaryNonfinancial business debt
In the second quarter of 2026, nonfinancial business debt expanded 4.6%, down from 7.0% in the previous quarter (table 2). This deceleration reflects a net paydown of commercial paper and a slight moderation in the pace of corporate bond issuance and loan growth.
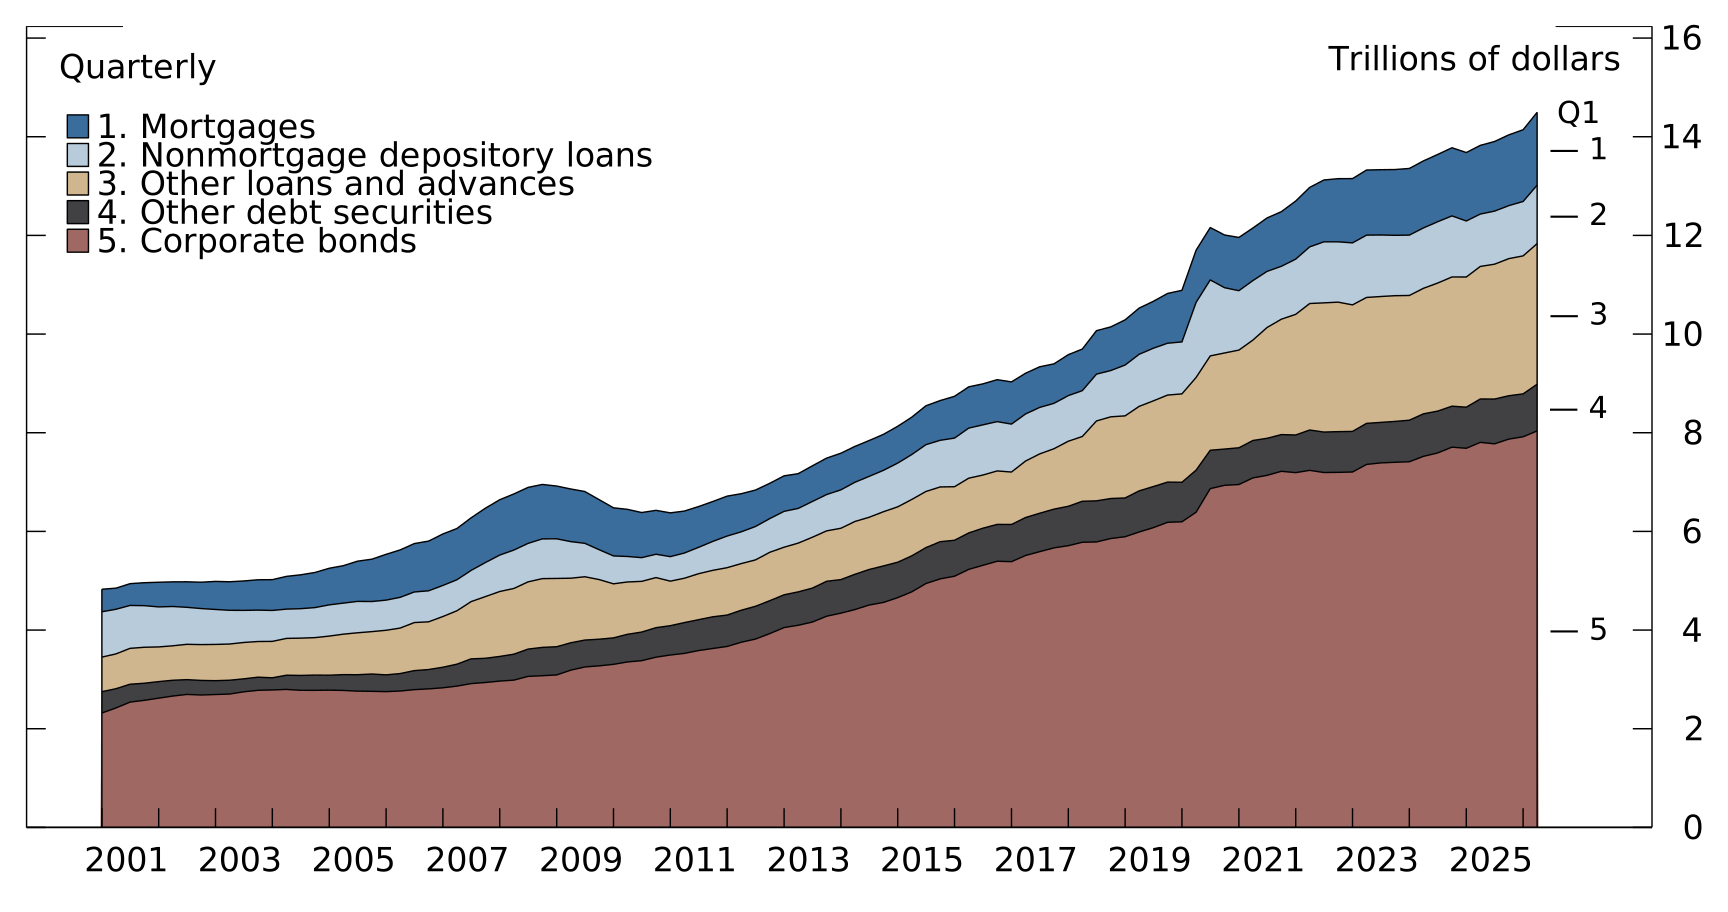
The nonfinancial corporate business sector consists of both publicly traded and privately owned nonfinancial corporations, and accounts for about two-thirds of nonfinancial business debt. Corporate debt was $15.7 trillion in the second quarter (figure 7). Debt securities amounted to $9.2 trillion, accounting for 58.5% of total corporate debt outstanding, while loans—including mortgage loans and nonmortgage loans—accounted for the remainder. Private credit loans, which have grown rapidly in recent years, now represent 7.1% of corporate debt, nearly equal to the share of nonmortgage loans from depository institutions.
Figure 7: Components of nonfinancial corporate business debt
Source: Financial Accounts of the United States, September 11, 2026.
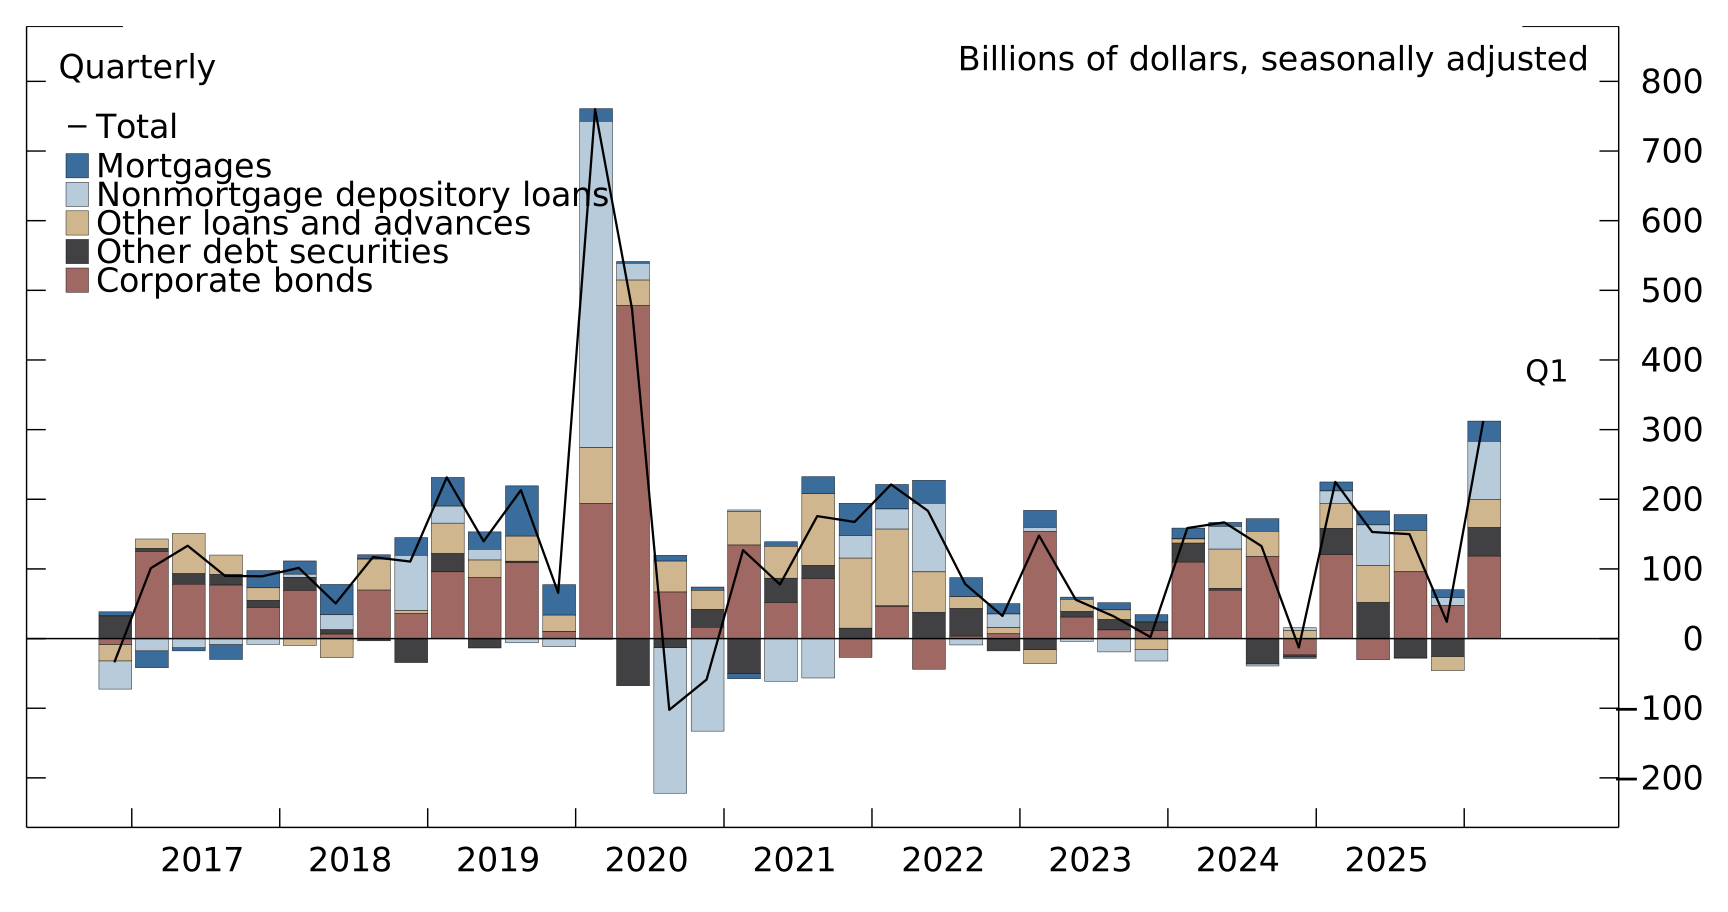
Accessible version | CSV | Data DictionaryNonfinancial corporate debt grew at a 5.5% pace in the second quarter (table 2), down from 8.4% in the previous quarter. On a seasonally adjusted basis, net issuance of debt securities was $50.7 billion (figure 8), while mortgage debt rose by $16.4 billion. Other nonmortgage loans from depository and nondepository financial institutions increased by $128.4 billion, while private credit loans increased by $16.8 billion. Additional detail on the composition of nonfinancial corporate business debt can be found on tables S11.1.t and S11.1.s.
Figure 8: Changes in nonfinancial corporate business debt
Source: Financial Accounts of the United States, September 11, 2026.
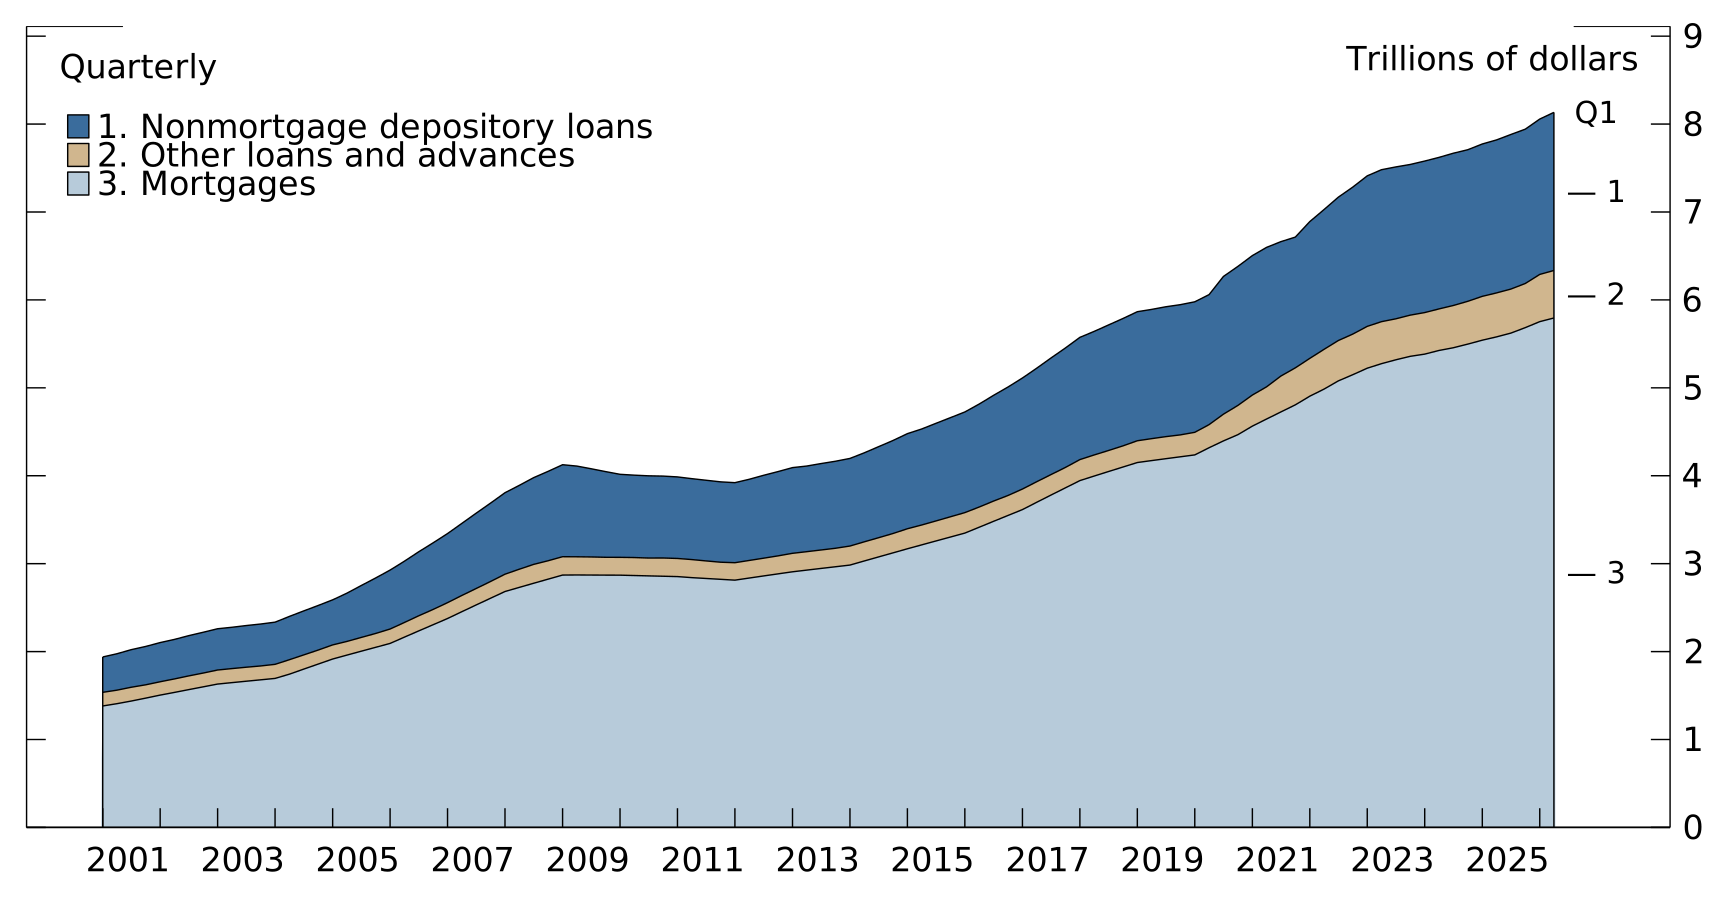
Accessible version | CSV | Data DictionaryThe nonfinancial noncorporate business sector consists mostly of smaller businesses, which are typically unincorporated. Noncorporate debt was $8.3 trillion in the second quarter (figure 9). Noncorporate debt is mainly composed of mortgage loans and nonmortgage depository loans. In the second quarter, mortgage loans accounted for 70.4% of noncorporate business debt, while nonmortgage depository loans accounted for most of the remainder.
Figure 9: Components of nonfinancial noncorporate business debt
Source: Financial Accounts of the United States, September 11, 2026.
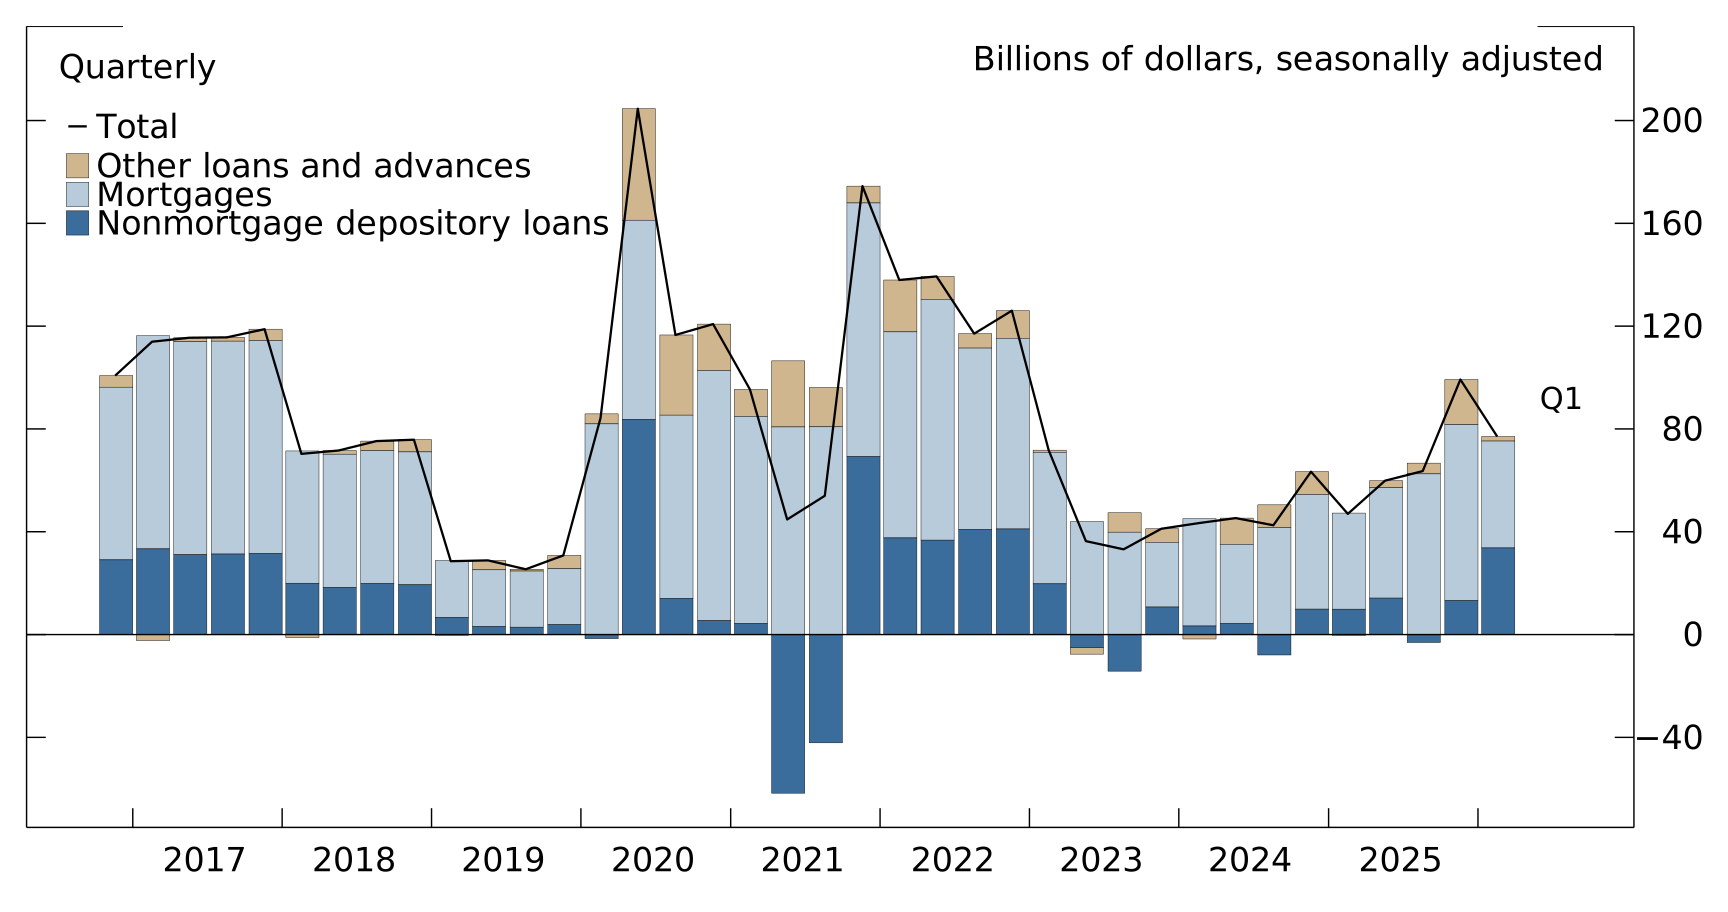
Accessible version | CSV | Data DictionaryNonfinancial noncorporate business debt grew at a 2.8% pace in the second quarter (table 2), down from 4.6% in the previous quarter. Additional detail on the composition of nonfinancial noncorporate business debt can be found on tables S11.2.t and S11.2.s.
Figure 10: Changes in nonfinancial noncorporate business debt
Source: Financial Accounts of the United States, September 11, 2026.
Accessible version | CSV | Data DictionaryGovernment debt
The domestic government sector aggregates the federal government sector and the state and local government sector. The ratio of total government debt to GDP remained flat at 1.2 in the second quarter (figure 4).
Federal government debt, which includes marketable Treasury securities (classified as debt securities) and nonmarketable securities (classified as loans), grew 5.2% in the second quarter (table 2) to $34.9 trillion (table 3), down from 6.7% in the previous quarter.
State and local government debt (table 3), which is mainly composed of long-term municipal securities, totaled $3.8 trillion in the second quarter. State and local government debt grew at a 9.1% pace (table 2) in the second quarter, up substantially from its recent average.
Coming soon
- Enhanced
Financial Accounts projects will be updated on Friday,
September 18, 2026, including the Distributional Financial
Accounts, which provide a quarterly estimate of the
distribution of U.S. household wealth.
- Financial Accounts data for the third quarter of 2026 will be published on Thursday, December 10, 2026, at 12:00 noon.
Because nonprofit organizations account for a small fraction of the assets and liabilities of the households and nonprofit organizations sector, the sector is commonly referred to as the “household sector.”↩︎
Indirectly held equity and debt securities are held in mutual funds, defined contribution pension funds, and life insurance products.↩︎
Consumer credit consists of credit card loans, auto loans, student loans, and other consumer credit.↩︎
Changes in net worth also reflect other changes in volume, which consist of statistical discontinuities and disaster-related losses to fixed assets.↩︎
The term “debt” refers to the aggregation of all debt securities and loans and excludes other liabilities.↩︎