DFA: Distributional Financial Accounts
Distributional Financial Accounts Overview
The Distributional Financial Accounts (DFAs) provide quarterly estimates of the distribution of a comprehensive measure of U.S. household wealth, beginning with the third quarter of 1989 and through the most recent quarter.
These interactive charts and tables allow users to explore the level, composition, and share of U.S. household wealth held by five percentile groups of wealth: the top 0.1 percent, the remaining 0.9 percent of the top 1, the next 9 percent (i.e., 90th to 99th percentile), the next 40 percent (50th to 90th percentile), and the bottom half (below the 50th percentile). Additionally, the data set contains the level and share of aggregate household wealth by income, age, generation, education, and race.
Download the full data set here: Raw Data: CSV (ZIP)
Interactive Data Visualizations
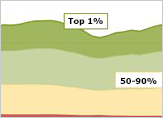
These charts and tables explore the level and the share of aggregate U.S. wealth (as well as selected assets and liabilities) held by various subgroups of the U.S. population.
Accessible Version
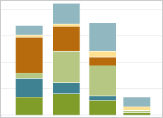
These charts and tables compare the composition of wealth, assets, and debts across subgroups.
Accessible Version
Documentation
The DFAs integrate two data products produced by the Federal Reserve Board: the Financial Accounts of the United States, which provide quarterly data on aggregate balance sheets of major sectors of the U.S. economy, and the Survey of Consumer Finances (SCF), which provides comprehensive triennial microdata on the assets and liabilities of a representative sample of U.S. households.
In addition to downloading the full data set above, users can download a public version of the DFA code to better understand the mechanics and make adjustments as desired.
The DFAs use distributional information from the SCF to allocate the Financial Accounts aggregate measures of assets and liabilities to different wealth, income, and other socioeconomic sub-populations. Because the two datasets use somewhat different wealth concepts and are measured at different frequencies, there are three key steps in constructing the DFAs. The first step is to reconcile the concepts and measures used in the two datasets in order to obtain comparable household balance sheets. The second step is to transform the reconciled SCF balance sheet (which is measured every three years) into an up-to-date, quarterly balance sheet by interpolating the assets and liabilities for each sub-population on a quarterly basis between SCF surveys, and forecasting these balance sheets for each quarter beyond the most recent survey year. The final step is to calculate the shares of assets and liabilities held by the different groups each quarter from this quarterly version of the reconciled SCF data, and then distribute the Financial Accounts aggregates by applying these shares. The associated FEDS Note and FEDS Paper provide details on the construction of the core data set and a discussion of the main findings.