Financial Accounts of the United States - Z.1
Recent Developments RSS Data Download
This release reports data through June 30, 2020.
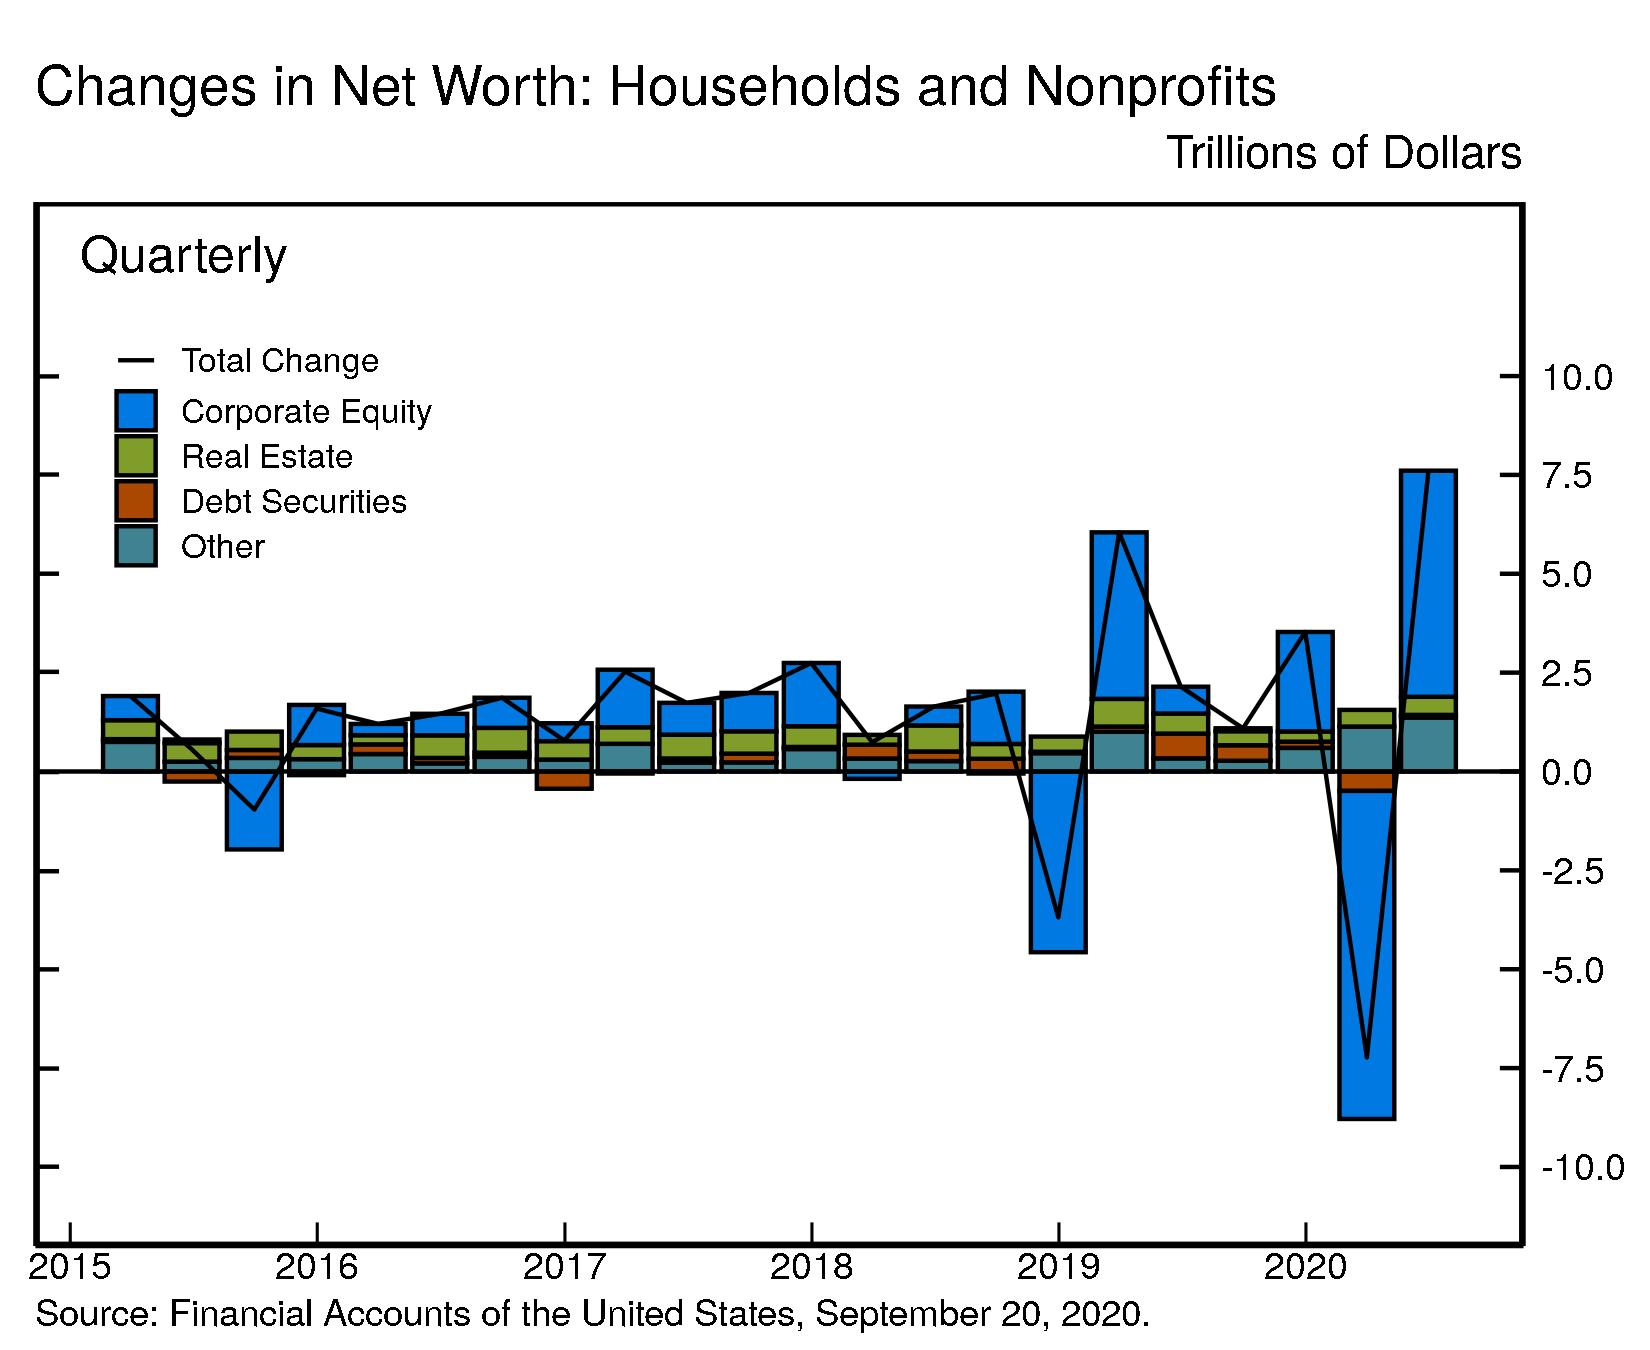
- Household net worth increased $7.6 trillion, owing primarily to a rebound in stock prices. This second quarter increase in net worth offsets the decline in Q1.
- Household debt edged up by 0.5%. While home mortgages increased, nonmortgage consumer credit declined.
- Nonfinancial business debt expanded at an annual rate of 14.0%, driven by Paycheck Protection Program (PPP) loans and by robust bond issuance. Excluding PPP loans, nonfinancial business debt increased at a much smaller rate.
Household Net Worth
The net worth of households and nonprofit organizations surged by $7.6 trillion to $119.0 trillion. The value of directly and indirectly held corporate equities increased by $5.7 trillion due to the rebound in corporate equity prices. The high rate of personal saving also contributed to the increase in net worth. The value of real estate held by households increased modestly. The second quarter increase in net worth was roughly equal to the decline recorded in Q1, leaving net worth about equal to its level at the end of 2019.
View interactive | Accessible version | CSV | Data Dictionary | Chart Note (1) |
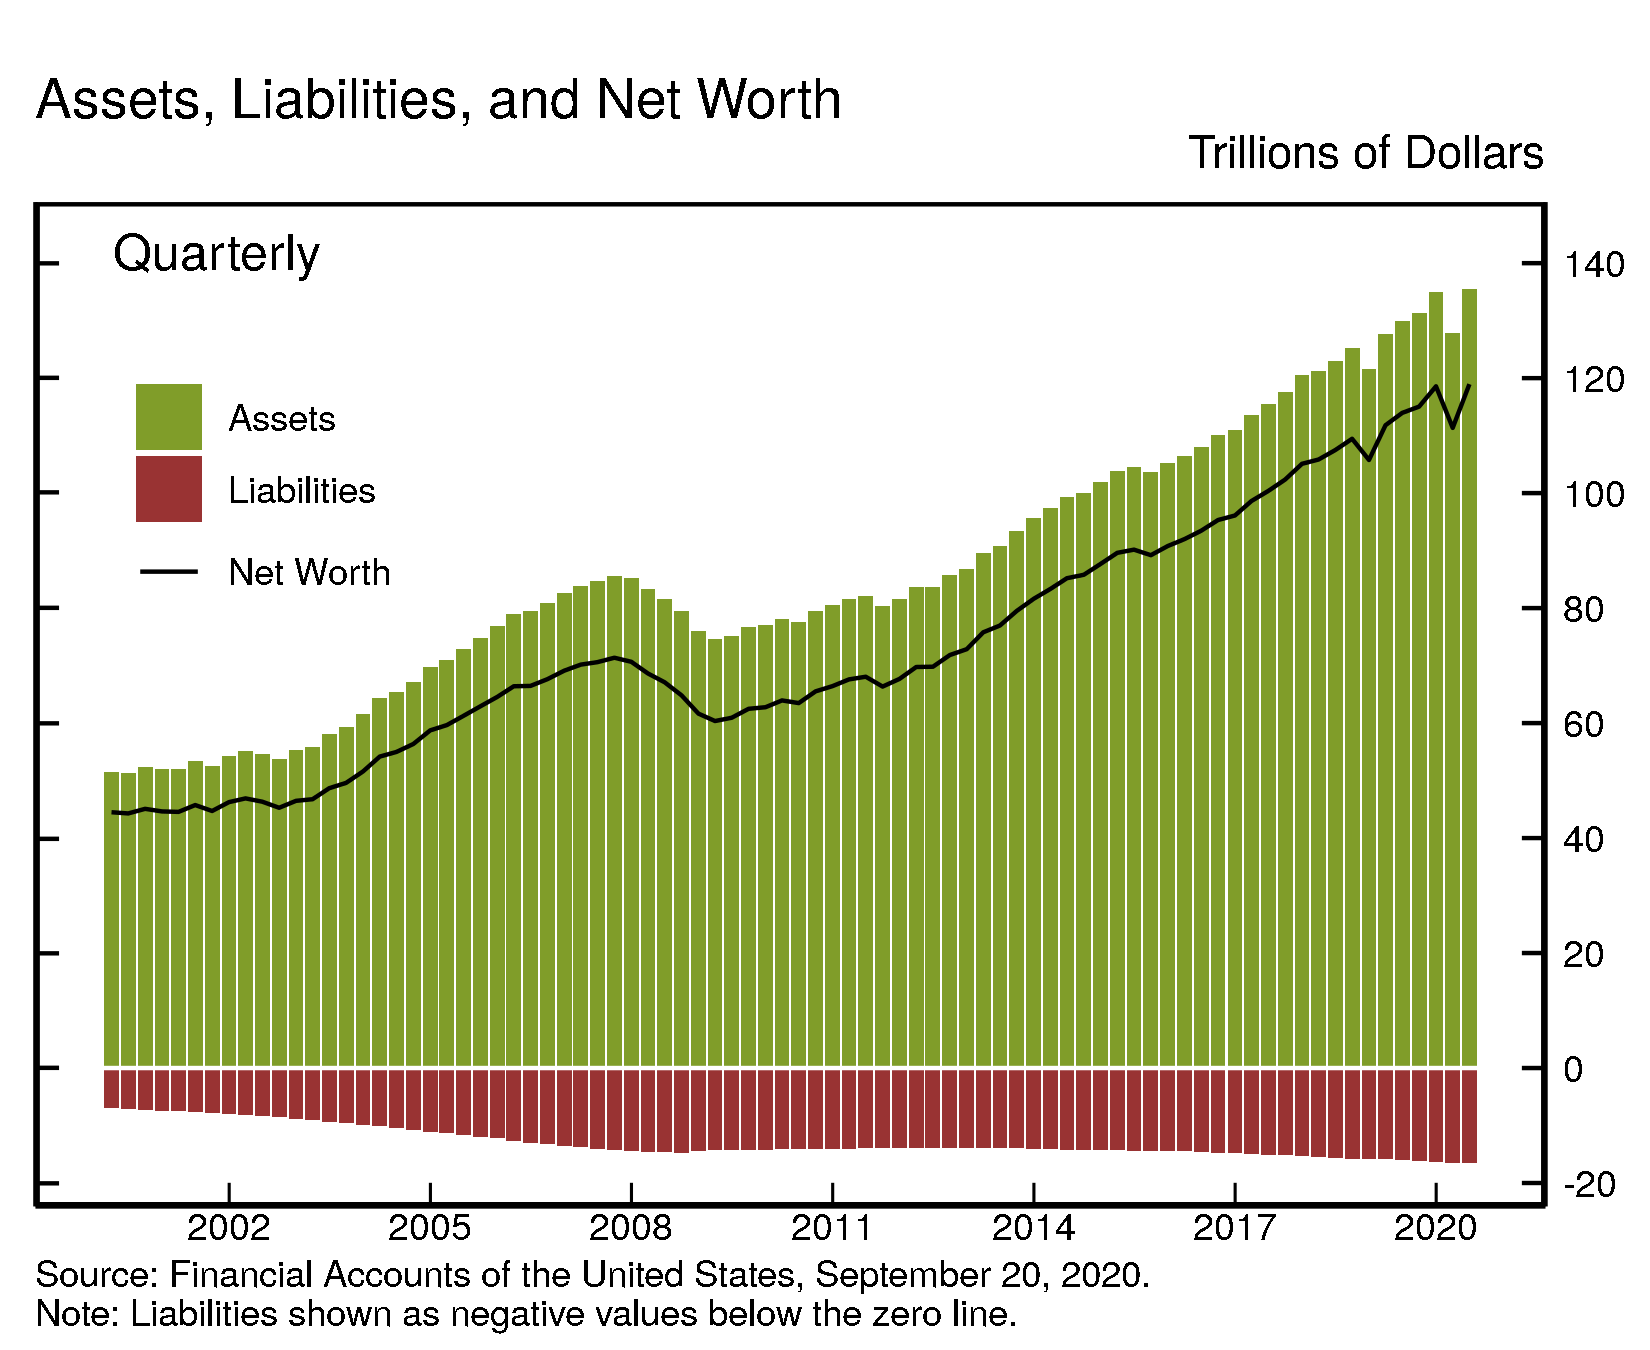
Real estate ($30.8 trillion) and directly and indirectly held corporate equities ($31.9 trillion) were among the largest components of household net worth. Household debt (seasonally adjusted) was $16.1 trillion.
View interactive | Accessible version | CSV | Data Dictionary |
Household Balance Sheet Summary
| Description | 2018 | 2019 | 2019:Q3 | 2019:Q4 | 2020:Q1 | 2020:Q2 |
|---|---|---|---|---|---|---|
| Net Worth | 105.76 | 118.58 | 115.05 | 118.58 | 111.35 | 118.96 |
| Change in Net Worth | 0.66 | 12.81 | 1.09 | 3.53 | -7.23 | 7.61 |
| Equities | 27.00 | 34.47 | 31.96 | 34.47 | 26.18 | 31.90 |
| Change in Equities | -2.95 | 7.48 | 0.07 | 2.52 | -8.29 | 5.72 |
| Real Estate | 28.38 | 29.93 | 29.61 | 29.93 | 30.31 | 30.76 |
| Change in Real Estate | 1.58 | 1.55 | 0.27 | 0.32 | 0.38 | 0.45 |
For more data on household net worth, see table B.101
Nonfinancial debt
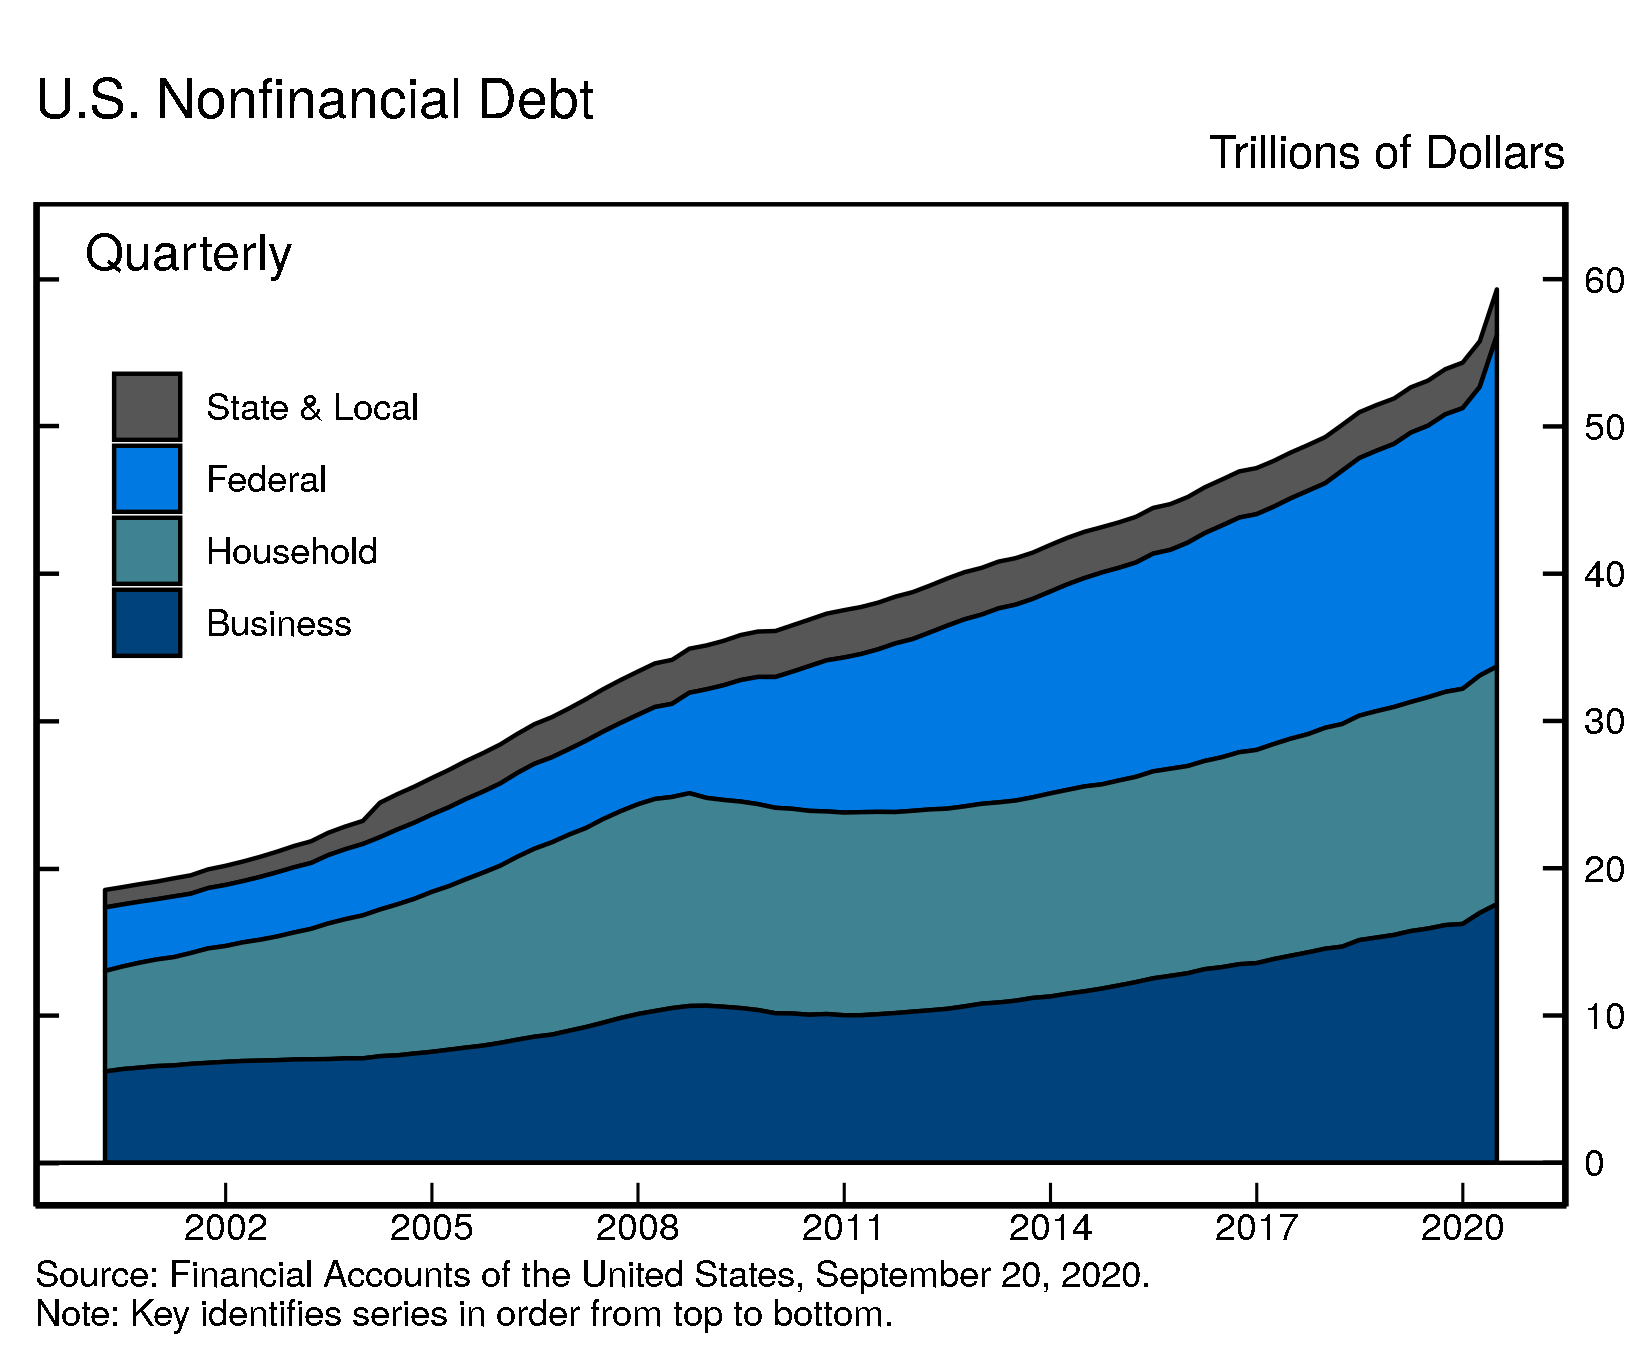
Household debt grew 0.5% in the second quarter of 2020 (this and subsequent rates of growth are reported at a seasonally adjusted annual rate). Home mortgages increased 3.0%, about in line with previous quarters. Nonmortgage consumer credit, however, declined 6.6%, primarily owing to a contraction in credit card balances.
Nonfinancial business debt expanded rapidly at an annual rate of 14.0%, with a notable expansion in depository loans1 associated with the PPP program and robust corporate bond issuance. Federal debt rose sharply, owing to the fiscal stimulus. State and local debt increased 3.5%.
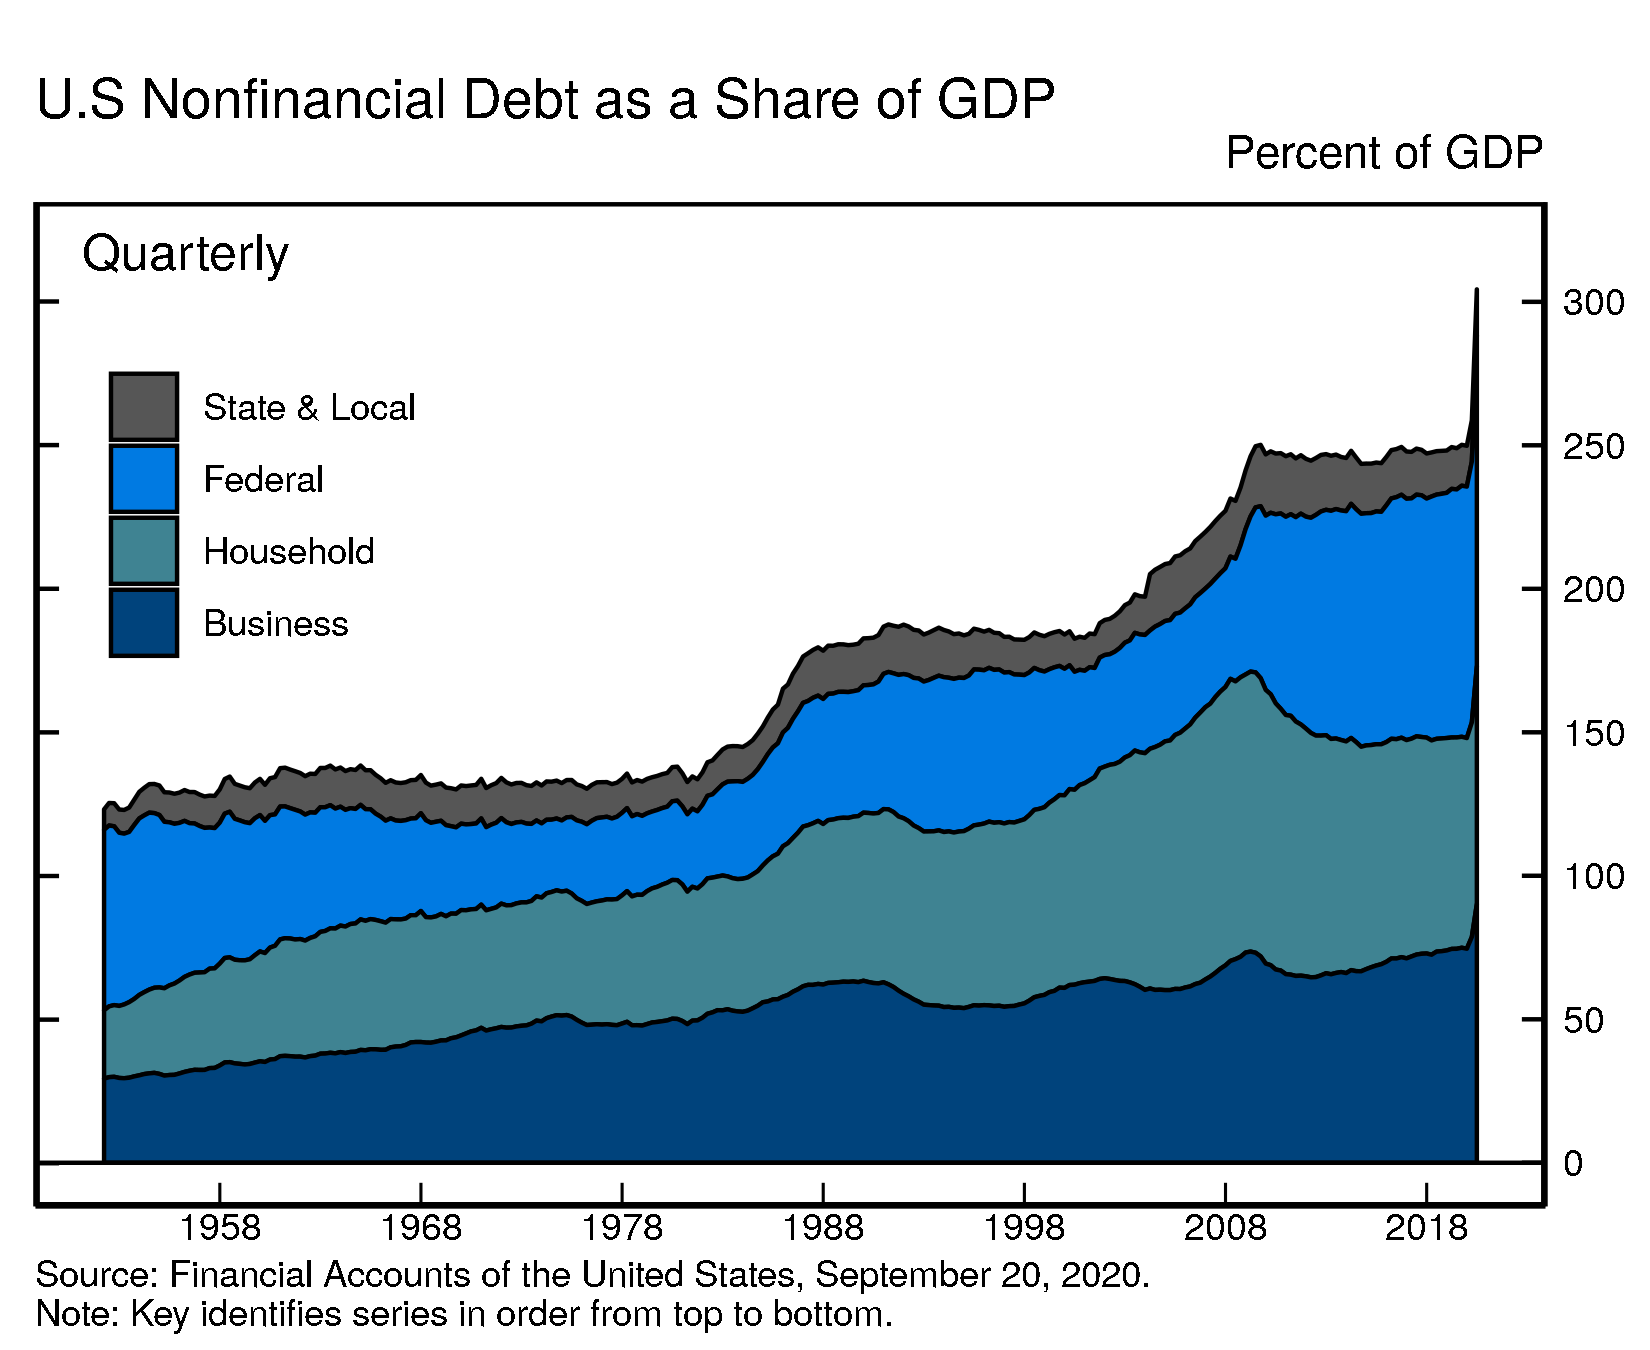
The contraction in GDP in Q2, together with the expansion in federal debt, led to a jump in the ratio of nonfinancial debt to GDP.
For more data on nonfinancial debt, see table D.1 (rates of growth) and table D.3 (outstanding).
Debt Growth by Sector
| Description | 2018 | 2019 | 2019:Q3 | 2019:Q4 | 2020:Q1 | 2020:Q2 |
|---|---|---|---|---|---|---|
| Total Nonfinancial | 4.68 | 4.73 | 5.89 | 3.33 | 10.65 | 25.27 |
| Households and Nonprofits | 3.27 | 3.28 | 3.31 | 3.45 | 3.78 | 0.46 |
| Nonfinancial Business | 4.17 | 4.83 | 5.96 | 1.94 | 18.43 | 14.02 |
| Federal Government | 7.58 | 6.67 | 8.86 | 4.49 | 11.38 | 58.86 |
| State and Local Governments | -1.59 | 0.32 | 0.88 | 2.89 | 0.85 | 3.47 |
Debt Outstanding by Sector
| Description | 2018 | 2019 | 2019:Q3 | 2019:Q4 | 2020:Q1 | 2020:Q2 |
|---|---|---|---|---|---|---|
| Total Nonfinancial | 51.89 | 54.33 | 53.89 | 54.33 | 55.78 | 59.30 |
| Households and Nonprofits | 15.48 | 15.97 | 15.83 | 15.97 | 16.12 | 16.14 |
| Nonfinancial Business | 15.47 | 16.22 | 16.14 | 16.22 | 16.96 | 17.56 |
| Federal Government | 17.87 | 19.06 | 18.84 | 19.06 | 19.60 | 22.48 |
| State and Local Governments | 3.08 | 3.09 | 3.07 | 3.09 | 3.10 | 3.13 |
Accessible version | CSV | Data Dictionary |
Accessible version | CSV | Data Dictionary |
Looking at the various components of nonfinancial business debt, nonmortgage depository loans to nonfinancial business increased $134 billion. The Small Business Administration reports that about $521 billion of PPP loans were authorized through June 30.2 Excluding PPP loans, however, nonmortgage depository loans declined notably. The decline likely reflected a partial payback of the lines of credit that many firms had tapped in Q1, together with reduced origination of new loans outside of PPP. While PPP loans are included in our measure of debt, a large fraction of them is expected to be forgiven. A technical Q&A (www.federalreserve.gov/releases/z1/z1_technical_qa.htm) provides additional details on the treatment of PPP loans in the Financial Accounts.
Excluding the roughly $0.5 trillion of PPP loans disbursed in Q2, nonfinancial business debt would have increased much more modestly, about 2%. This growth was driven by robust net issuance of corporate bonds. Bond issuance rebounded in Q2 after a temporary halt in March.
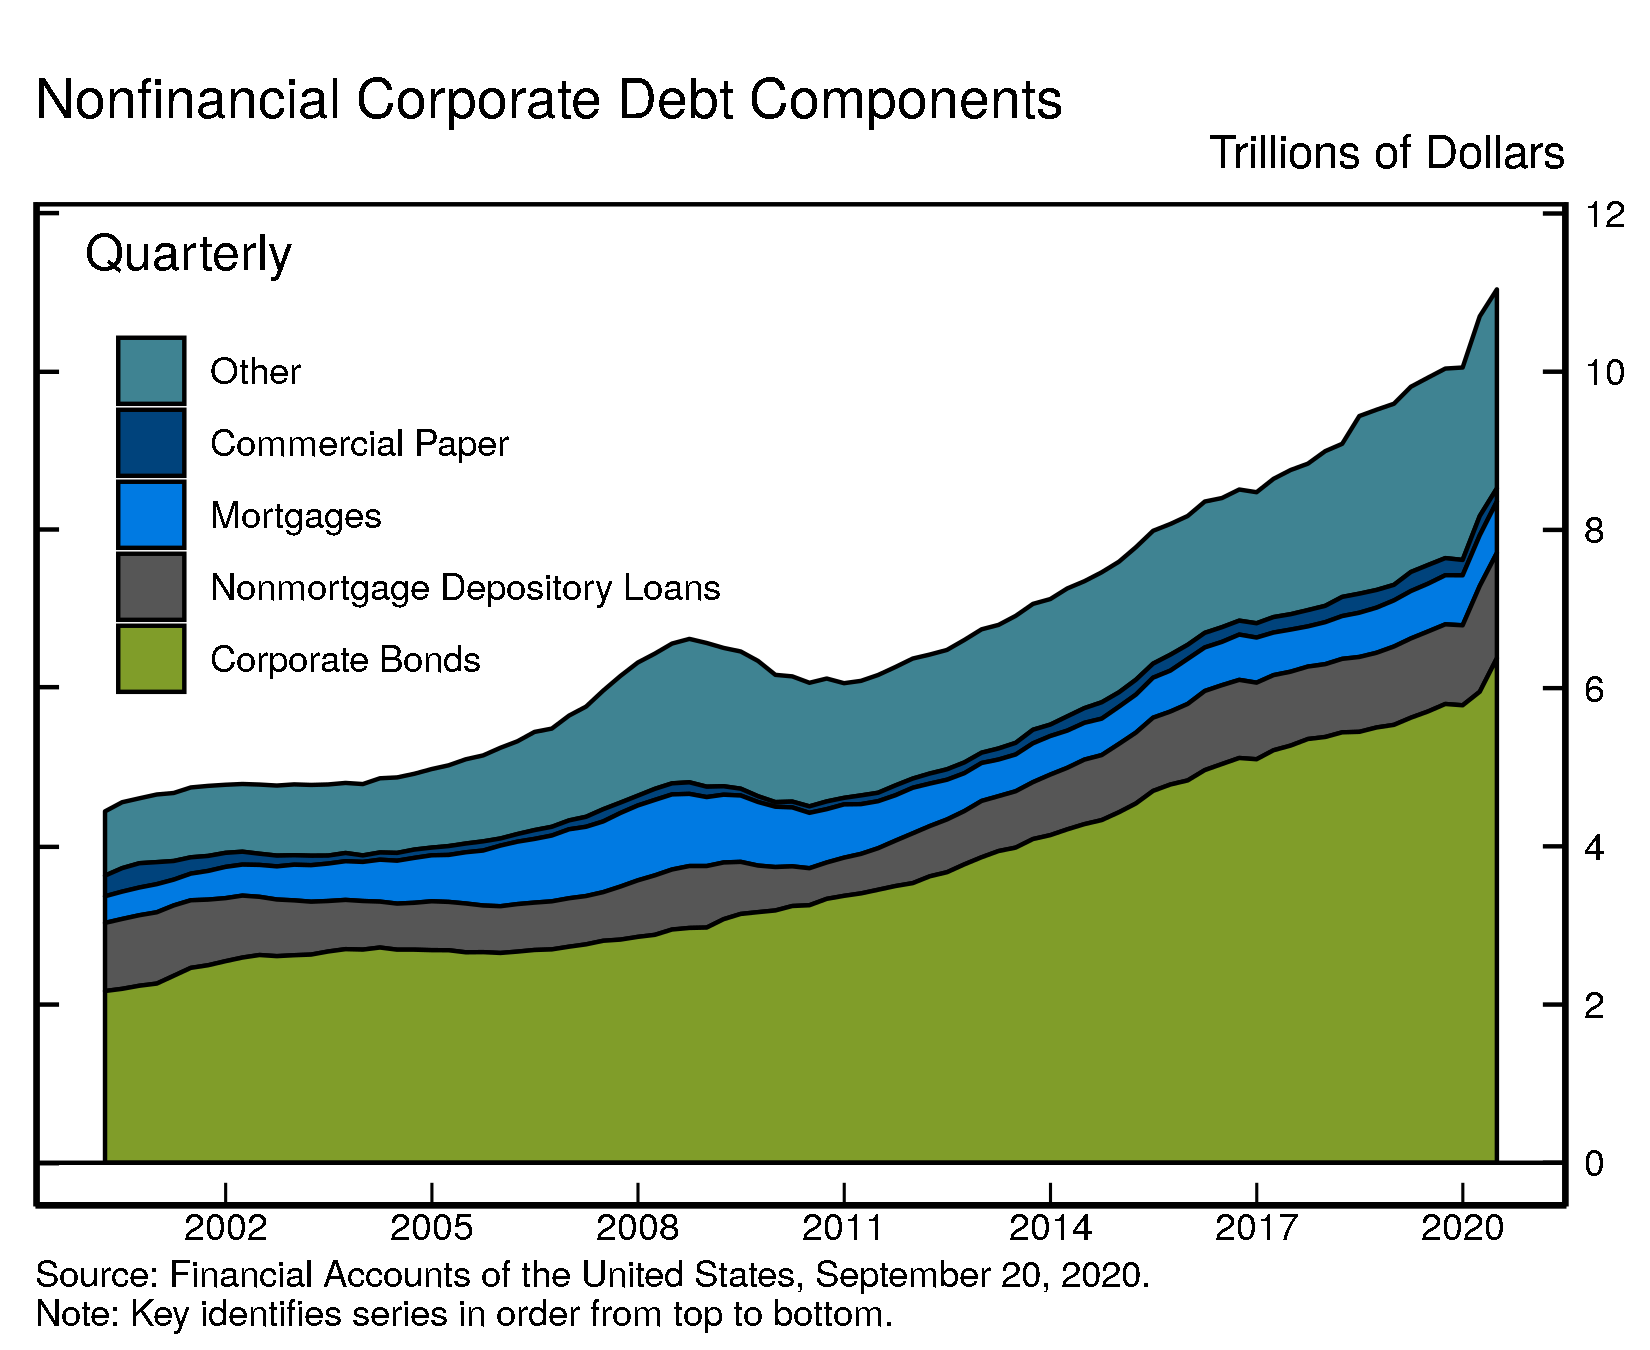
Overall, outstanding nonfinancial corporate debt was nearly $11.0 trillion. Corporate bonds, at roughly $6.4 trillion, accounted for 58% of the total. Nonmortgage depository loans were $1.3 trillion. Other types of debt include loans from nonbank institutions, loans from the federal government, and commercial paper.
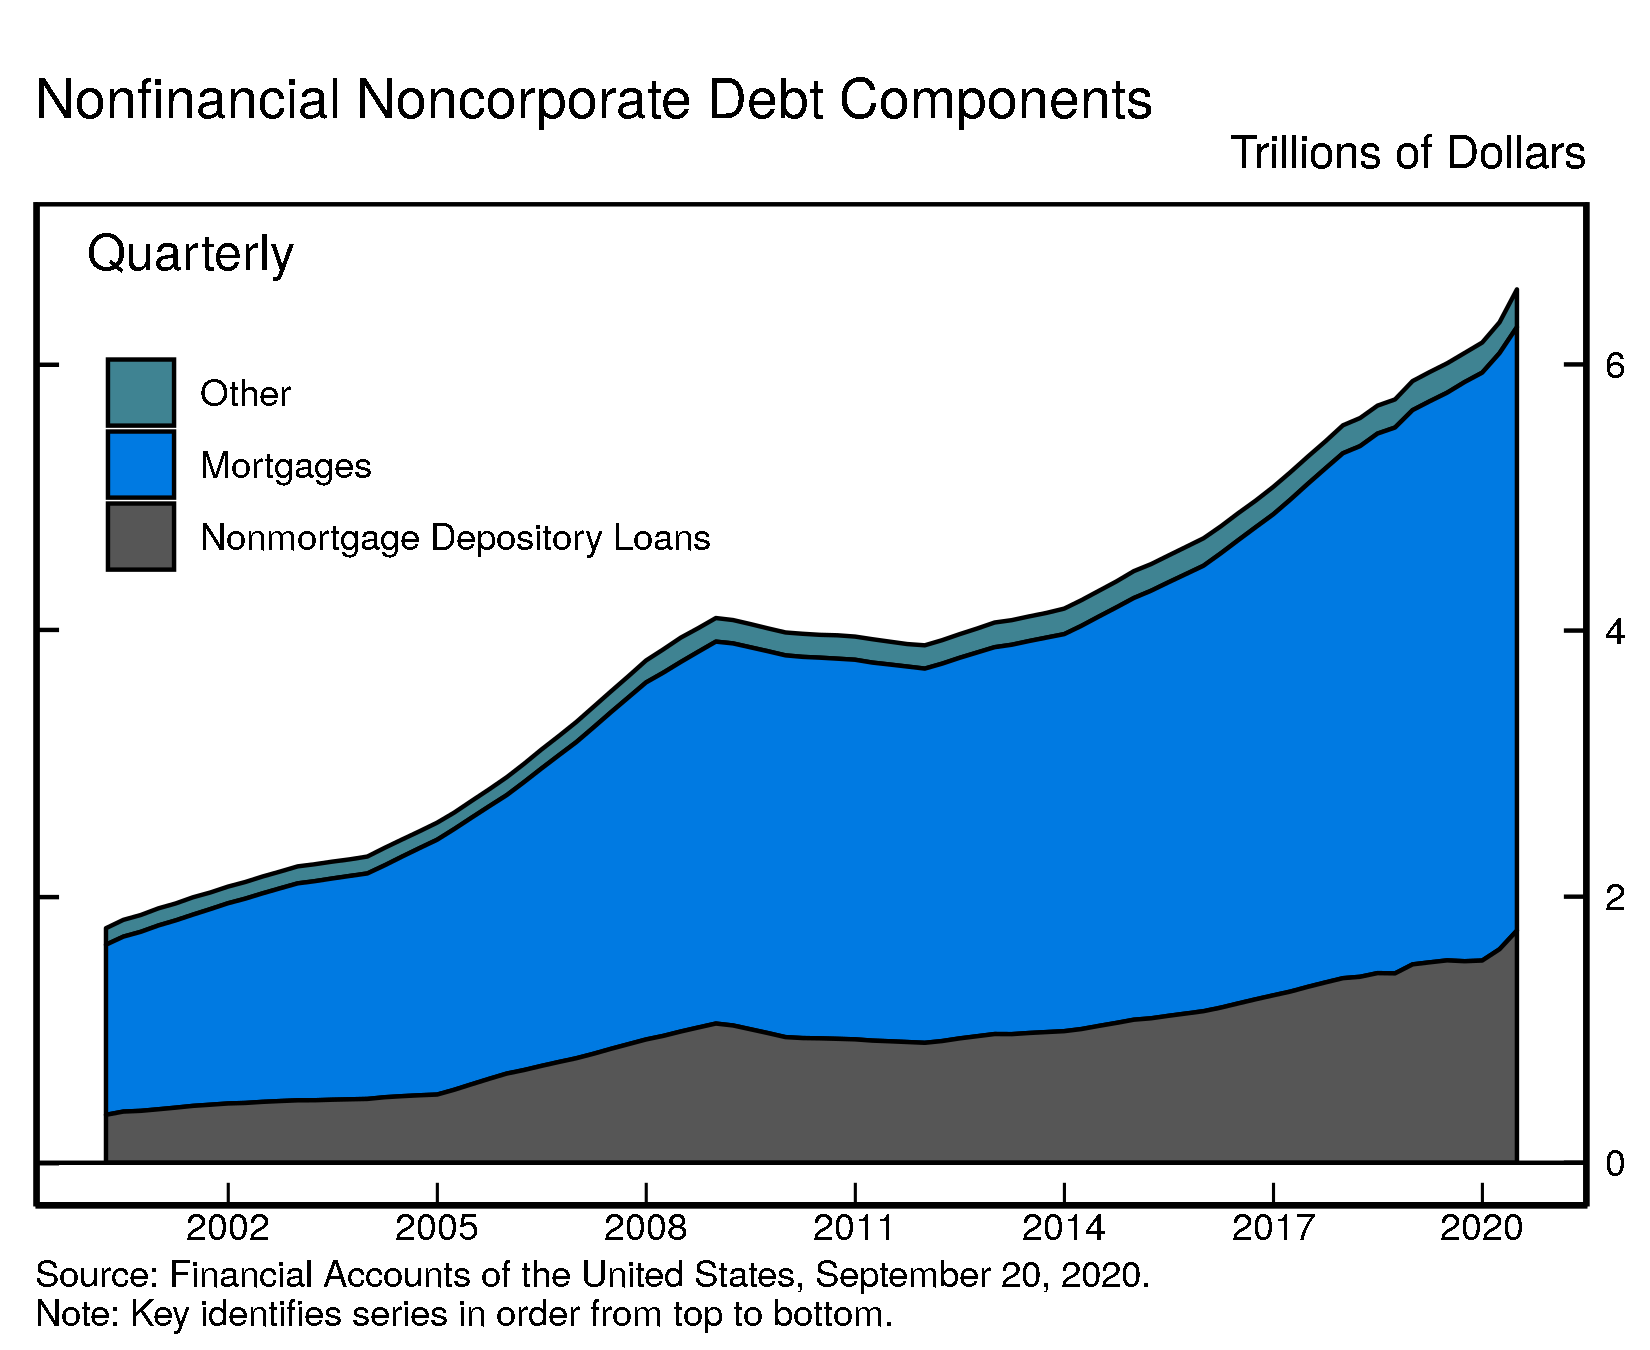
The nonfinancial noncorporate business sector is composed of mostly smaller businesses, which are typically not incorporated. Nonfinancial noncorporate business debt was $6.6 trillion, of which $4.5 trillion were mortgage loans and $1.7 trillion were nonmortgage depository loans.
Accessible version | CSV | Data Dictionary |
Accessible version | CSV | Data Dictionary |
For more data on nonfinancial business balance sheets, including debt, see tables B.103 and B.104
New data features
New facilities. In response to the coronavirus pandemic, the Federal Reserve, the U.S. Congress, and the Administration rapidly established a number of new programs to support the flow of credit to households and businesses. The Monetary Authority tables (F.109 and L.109), as well as other tables, such as the Other Financial Businesses tables (F.132 and L.132), include data on the credit extended by these facilities. For a comprehensive list, see the Financial Accounts release highlights (www.federalreserve.gov/releases/z1/20200921/html/recent_developments.htm). For a description of these facilities, see the main Federal Reserve Board webpage (www.federalreserve.gov).
For timely information on developments in the Federal Reserve’s balance sheet, see the H.4.1 Statistical Release on Factors Affecting Reserve Balances (www.federalreserve.gov/releases/h41/).
Hedge funds. The new supplementary table B.101.f reports assets and liabilities of domestic hedge funds (that is, hedge funds domiciled in the U.S.), starting in 2012Q4. Quarterly data are derived from aggregated Securities and Exchange Commission forms PF and ADV. The table only includes domestic hedge funds because national accounts, including the balance of payments, include hedge funds domiciled abroad in the rest of the world sector. For more information on table B.101.f, see the table description (www.federalreserve.gov/apps/fof/Guide/z1_tables_description.pdf).
For other new data and for methodological data revisions, see current release
Coming soon
- The distributional financial accounts, which provide a quarterly measure of the distribution of U.S. household wealth, will be published on Friday, Oct. 2. Other Enhanced Financial Accounts Projects (www.federalreserve.gov/releases/efa/enhanced-financial-accounts.htm) will also be updated on Oct. 2.
- Financial Accounts data for the third quarter of 2020 will be published on Thursday, December 10, 2020, at 12:00 noon.
Chart Notes
- Changes in net worth consist of transactions, revaluations, and other volume changes. Corporate equity and debt securities include directly and indirectly held securities. Real estate is the value of owner-occupied real estate. Other includes equity in noncorporate businesses, consumer durable goods, fixed assets of nonprofit organizations, and all other financial assets apart from corporate equities and debt securities, net of liabilities, as shown on table B.101 Balance Sheet of Households and Nonprofit Organizations
Depository loans include bank loans (bank credit) and loans from nonbank depository institutions such as credit unions and savings and loans associations.↩
The loans that had been authorized but not yet disbursed, the loans extended to nonprofit organizations and to financial companies, and the loans extended by financial institutions other than depository institutions are not included in nonfinancial business debt. The SBA reports that the vast majority of PPP loans were extended by depository institutions.↩