Senior Credit Officer Opinion Survey on Dealer Financing Terms
Senior Credit Officer Opinion Survey, December 2025
Current Release RSS DDP
Summary
The December 2025 Senior Credit Officer Opinion Survey on Dealer Financing Terms collected qualitative information on changes in credit terms as well as conditions in securities financing and over-the-counter (OTC) derivatives markets between September 2025 and November 2025.1 In addition to the core questions, the survey included a set of special questions on dealers' provision of equity financing and synthetic equity exposure to hedge fund clients.
Core Questions
(Questions 1-79)2
With respect to the credit terms applicable to, and mark and collateral disputes with, different counterparty types across the entire range of securities financing and OTC derivatives transactions, responses to the core questions revealed the following:
- Price and nonprice terms on securities financing transactions and OTC derivatives were largely unchanged, on net, across all counterparty types. Roughly one-fifth of dealers reported that the intensity of efforts by hedge funds to negotiate more favorable price and nonprice terms increased somewhat.
- Attention devoted to managing concentrated credit exposure to dealers and other financial intermediaries (such as large banking institutions) remained basically unchanged. Nearly all dealers reported that changes in the practices of central counterparties, including margin requirements and haircuts, had no or minimal influence on the credit terms they offer to clients on bilateral transactions that are not cleared.
- The volume and duration of mark and collateral disputes remained basically unchanged, on net, over the past three months for all counterparty types.
With respect to clients' use of financial leverage, dealers reported that the use of leverage remained basically unchanged, on net, for all client types (see the exhibit “Use of Financial Leverage”).
In OTC derivatives markets, the volume and duration of mark and collateral disputes remained basically unchanged, on net, for most types of contracts. However, about one-fifth of dealers reported an increase in the volume of such disputes for OTC derivatives contracts referencing equities. Dealers indicated that nonprice terms in master agreements, initial margin requirements, and the posting of nonstandard collateral remained basically unchanged, on net, from the previous quarter.
With respect to securities financing transactions, respondents indicated the following:
- The terms on securities financing were reported as basically unchanged, on net, for all collateral types.
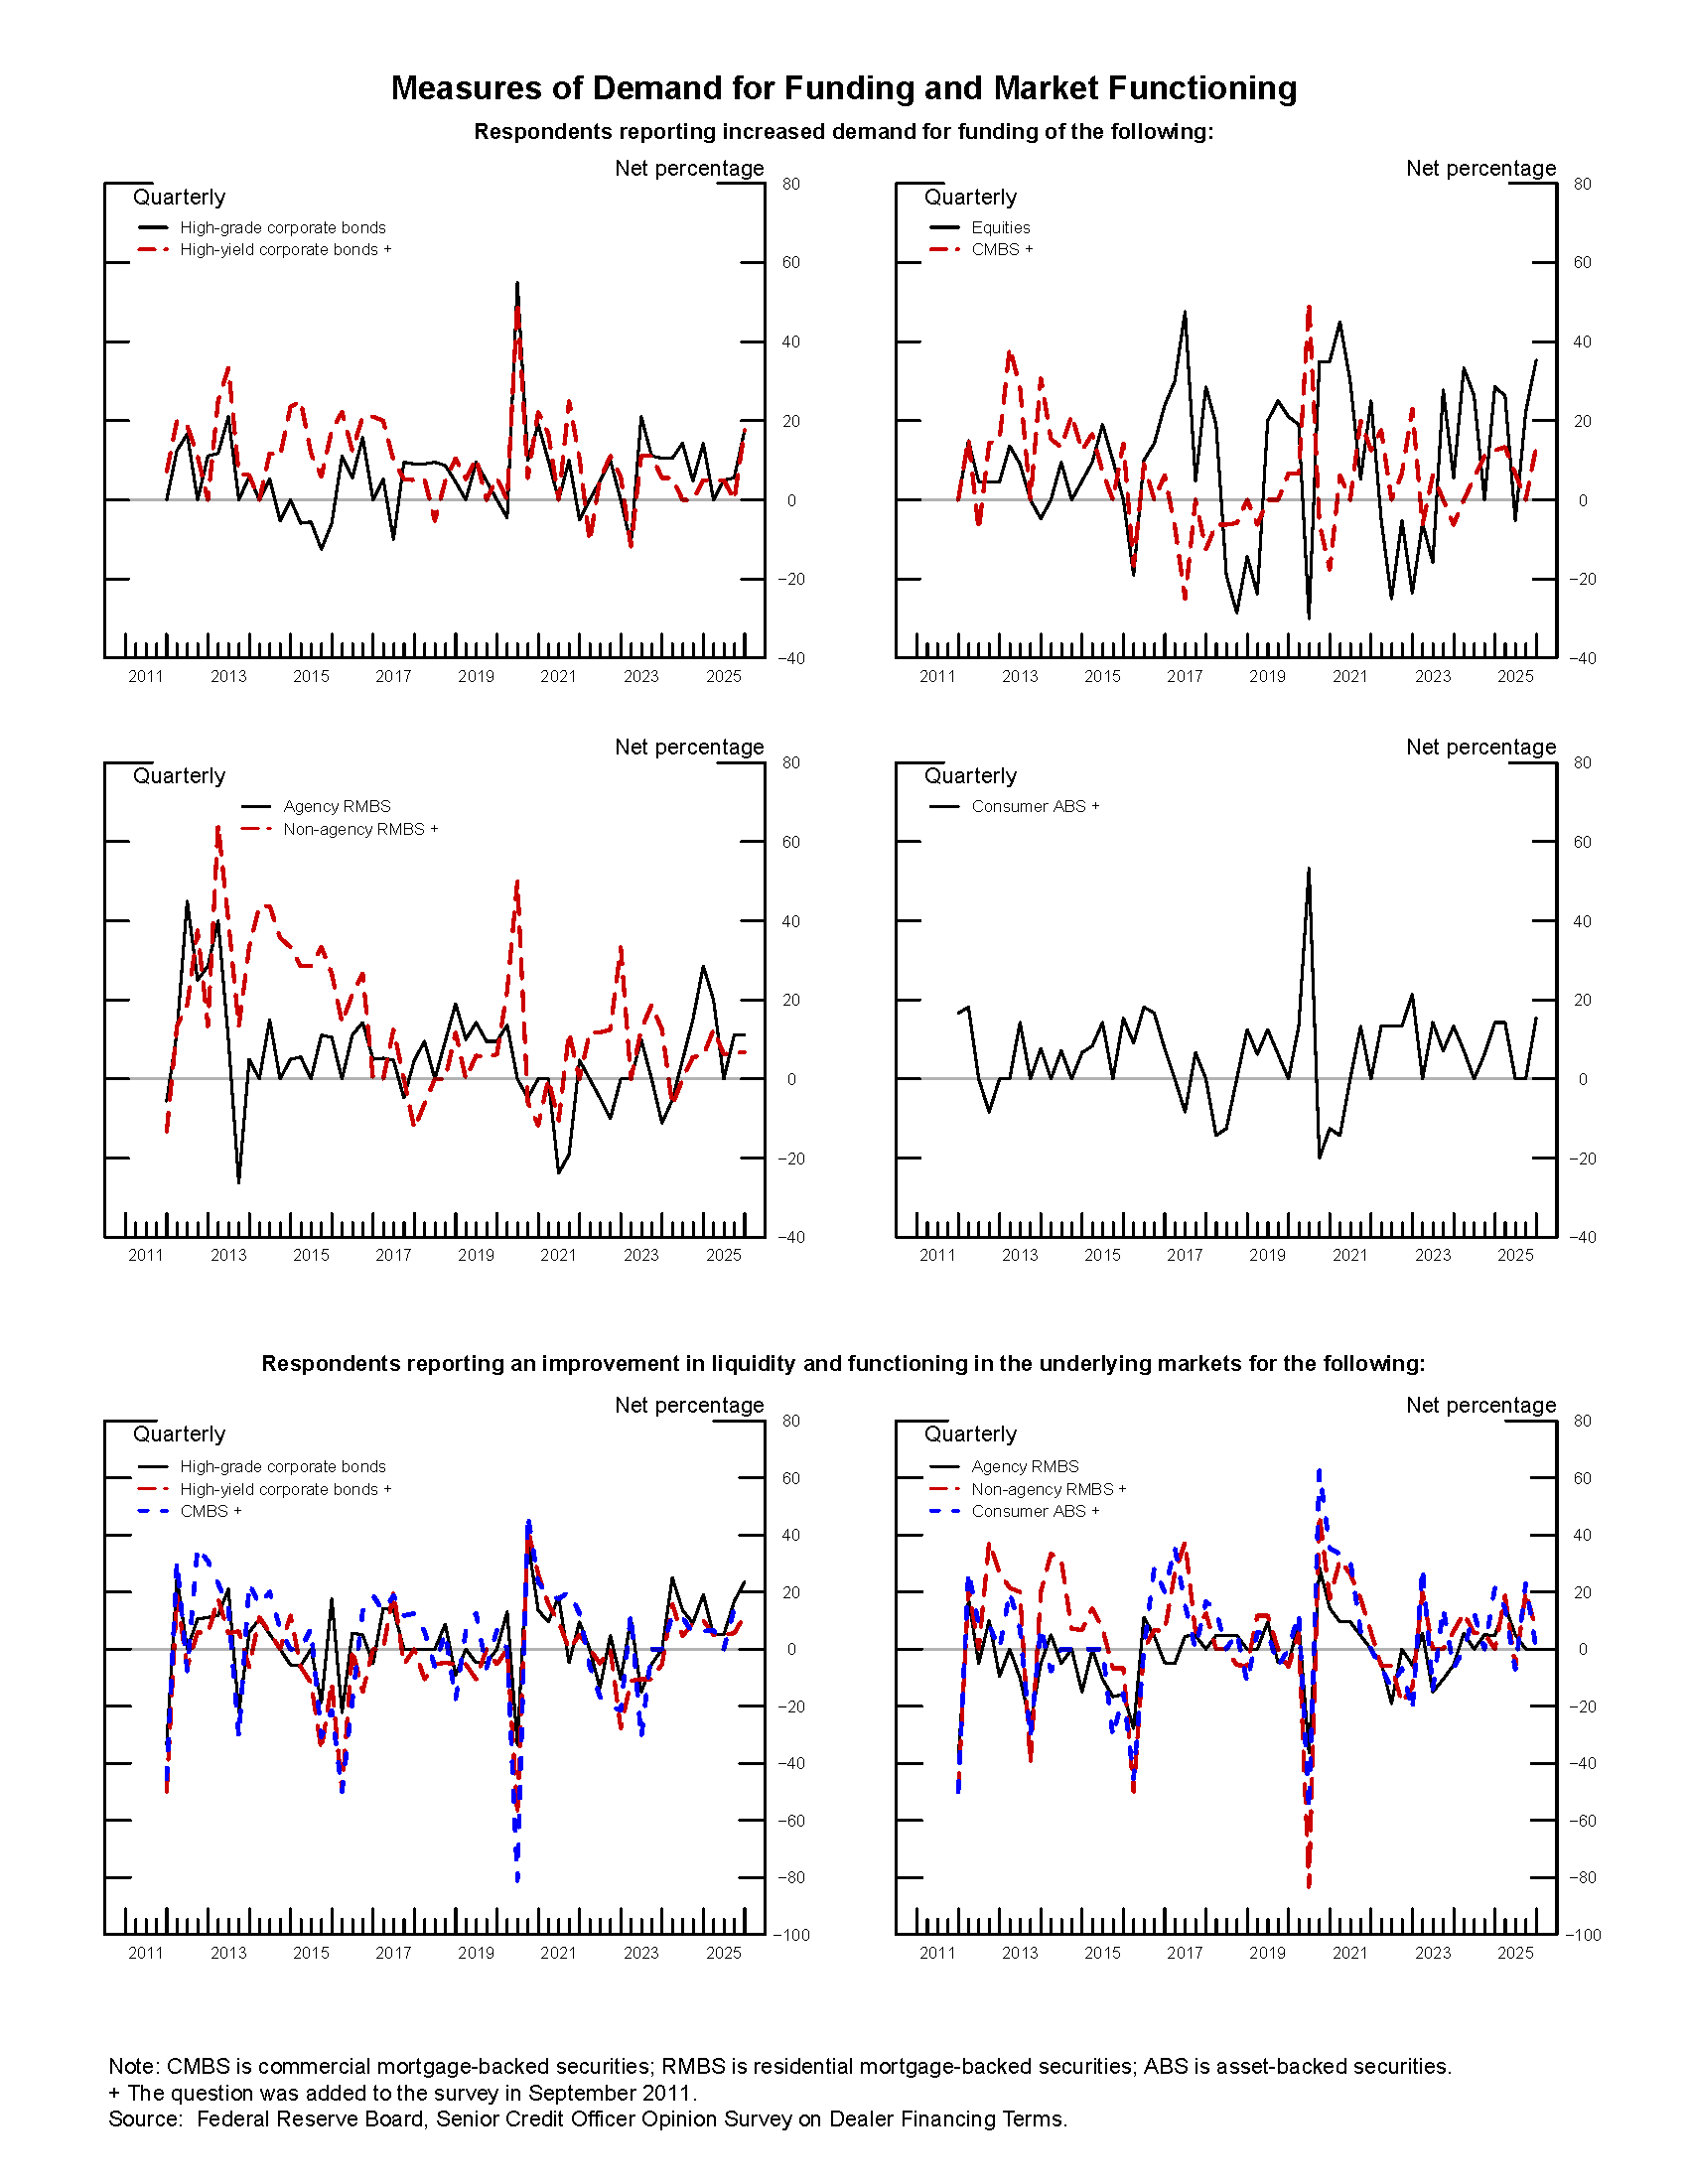
- About one-third of dealers reported an increase in demand for funding of equities, and roughly one-fifth of dealers reported an increase in demand for funding of high-grade and high-yield corporate bonds. Approximately one-fifth of dealers reported that the demand for term funding of high-grade corporate bonds, high-yield corporate bonds, and commercial mortgage-backed securities increased somewhat. The demand for funding, including term funding, of other collateral types remained basically unchanged on net (see the exhibit "Measures of Demand for Funding and Market Functioning").
- About one-fourth of dealers reported that liquidity and market functioning improved somewhat for high-grade corporate bonds.
- The volume, duration, and persistence of mark and collateral disputes remained basically unchanged over the period across all collateral types.
Special Questions on Dealers' Provision of Equity Financing and Synthetic Equity Exposure to Hedge Fund Clients
(Questions 81-88)
Hedge fund equity exposures have reportedly increased significantly over the past two years. In this quarter's special questions, dealers were asked about their provision of equity exposure to hedge fund clients, including through both margin loan financing and the provision of synthetic equity exposure through derivatives.3 The survey included separate questions for single- and multi-manager fund structures; for fundamental, quantitative, and sector-focused equity strategies; and on the financing of equities related to artificial intelligence (AI). Almost all dealers responded to the special questions.
One-half of respondents reported increased demand for equity exposure from single-manager hedge funds over the past two years, compared to about three-fifths reporting increased demand from multi-manager hedge funds. Regarding fund strategies, about one-half of respondents reported increased demand from hedge funds following fundamental equity and quantitative equity strategies, while roughly one-fifth reported that demand from hedge funds following sector-focused/concentrated equity strategies increased somewhat.
On balance, dealers reported that price and nonprice terms offered on equity exposure to single- and multi-manager hedge funds remained basically unchanged over the past two years. For hedge funds following fundamental equity and quantitative equity strategies, dealers reported that price and nonprice terms offered on equity exposure remained basically unchanged on net. For hedge funds following a sector-focused/concentrated equity strategy, dealers reported that price terms remained basically unchanged, on net, but one-third of dealers reported that nonprice terms tightened somewhat over the past two years.
One-third of dealers reported that the notional amount of synthetic equity exposure they provide to hedge fund clients had increased somewhat relative to traditional prime brokerage financing transactions over the past two years. One-half of these dealers indicated that the greater potential for internalization or netting of positions was the most significant factor that contributed to the increase. Improved access to foreign markets for hedge funds was also cited as a contributing factor by most of these dealers.
Two-thirds of dealers indicated that the demand from hedge fund clients for equity exposure to AI-focused stocks had increased relative to other sectors over the past two years.4 Dealers reported that the price and nonprice terms offered to hedge fund clients for exposure to AI-focused stocks remained basically unchanged, on net, relative to other sectors.
Finally, the survey asked about the practice of internalization, in which dealers match customer positions internally with offsetting customer positions:
- Two-thirds of dealers reported that they offer more favorable price terms for clients when the potential for internalization is high. However, dealers reported that the ability to internalize equity positions had no significant impact, on net, on the nonprice terms offered to hedge fund clients.
- All dealers reported that the potential for internalization was at least somewhat important in their decisionmaking process when onboarding new hedge fund clients or expanding relationships with existing clients.
- Almost all dealers reported that their reliance on internalization (as a share of total sourcing for client exposure) remains about the same when providing equity exposure to hedge fund clients in periods of high market volatility.
This document was prepared by Phillip Monin, Division of Monetary Affairs, Board of Governors of the Federal Reserve System. Assistance in developing and administering the survey was provided by staff members in the Capital Markets Function, the Statistics Function, and the Markets Group at the Federal Reserve Bank of New York.
1. The 19 institutions participating in the December survey account for almost all dealer financing of dollar-denominated securities to nondealers and are the most active intermediaries in OTC derivatives markets. The survey was conducted between November 4, 2025, and November 17, 2025. Return to text
2. Question 80, not discussed here, was optional and allowed respondents to provide additional comments. Return to text
3. Equity financing mechanisms typically include margin loans or securities lending transactions. Synthetic equity exposure is usually provided through total return swaps or other OTC derivative contracts referencing equities. Return to text
4. “AI-focused stocks” refers to companies that derive significant revenue from AI-specific products or services, are leaders in developing core AI technologies, have made substantial investments in proprietary AI research, or provide critical infrastructure for AI systems. These companies may span various Global Industry Classification Standard sectors, including but not limited to Information Technology and Communication Services, but exclude those that merely use AI as an ancillary part of their business. Return to text
Exhibit 1: Management of Concentrated Credit Exposures and Indicators of Supply of Credit
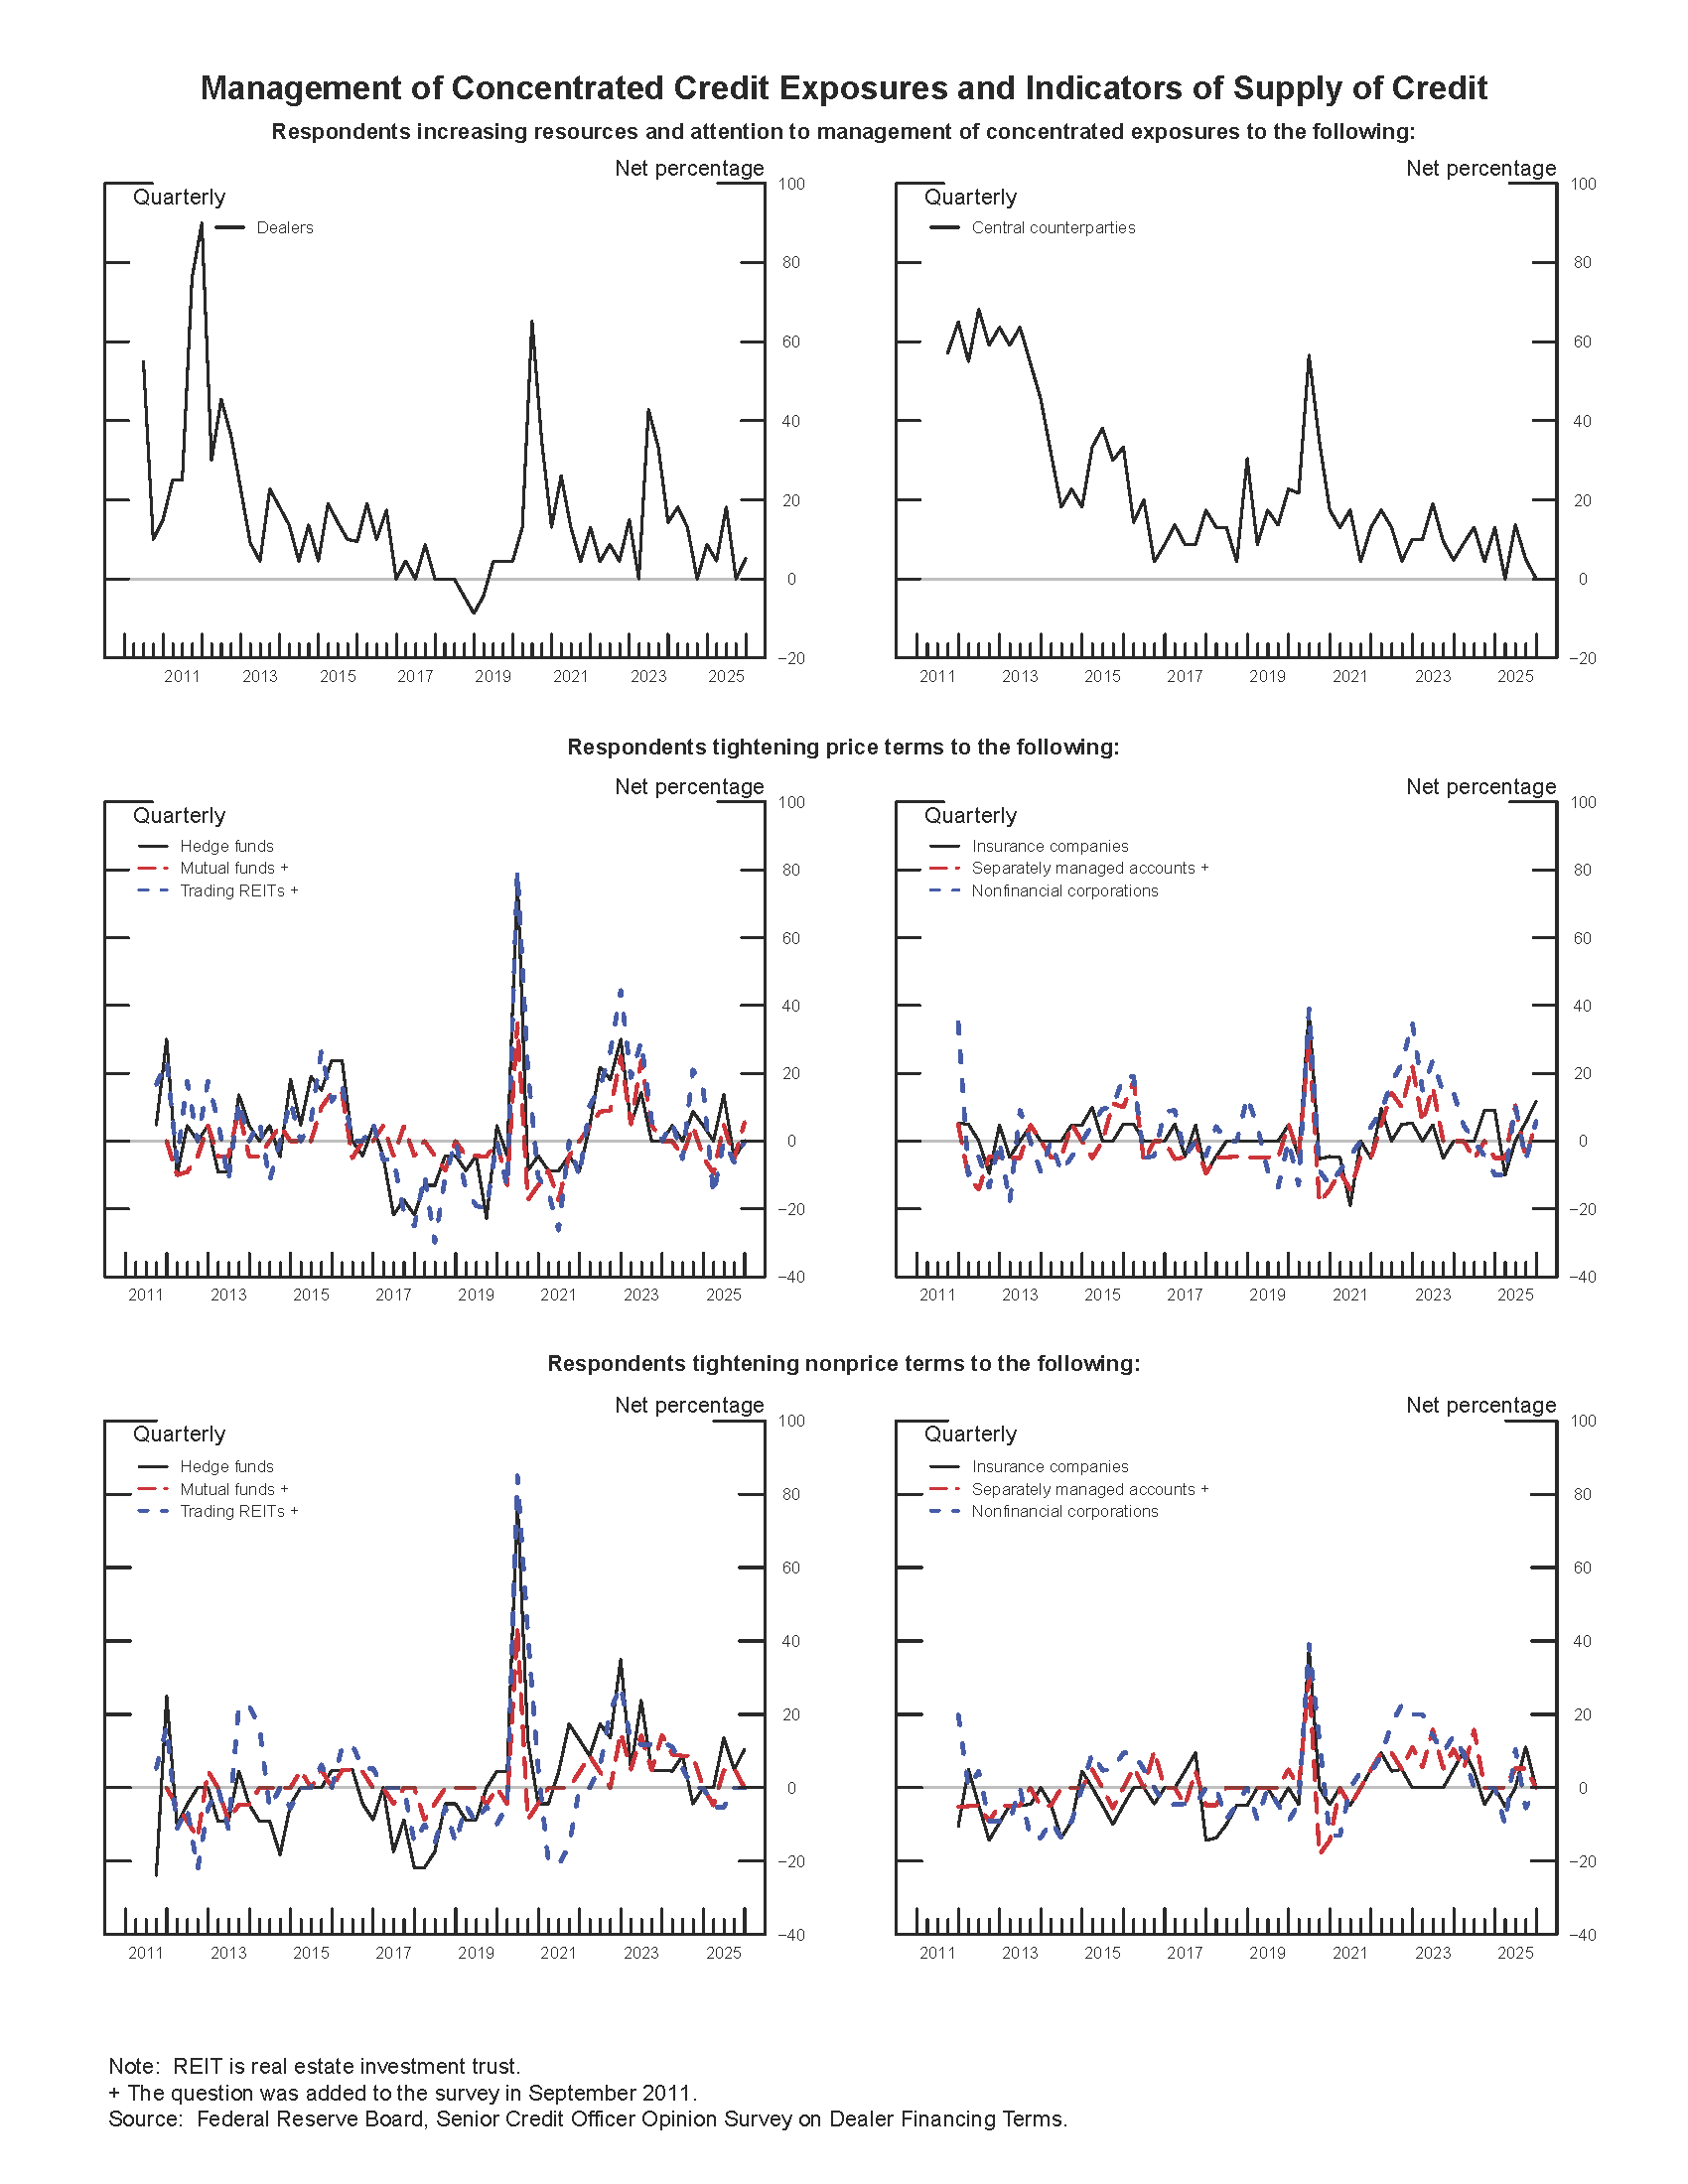
Exhibit 2: Use of Financial Leverage
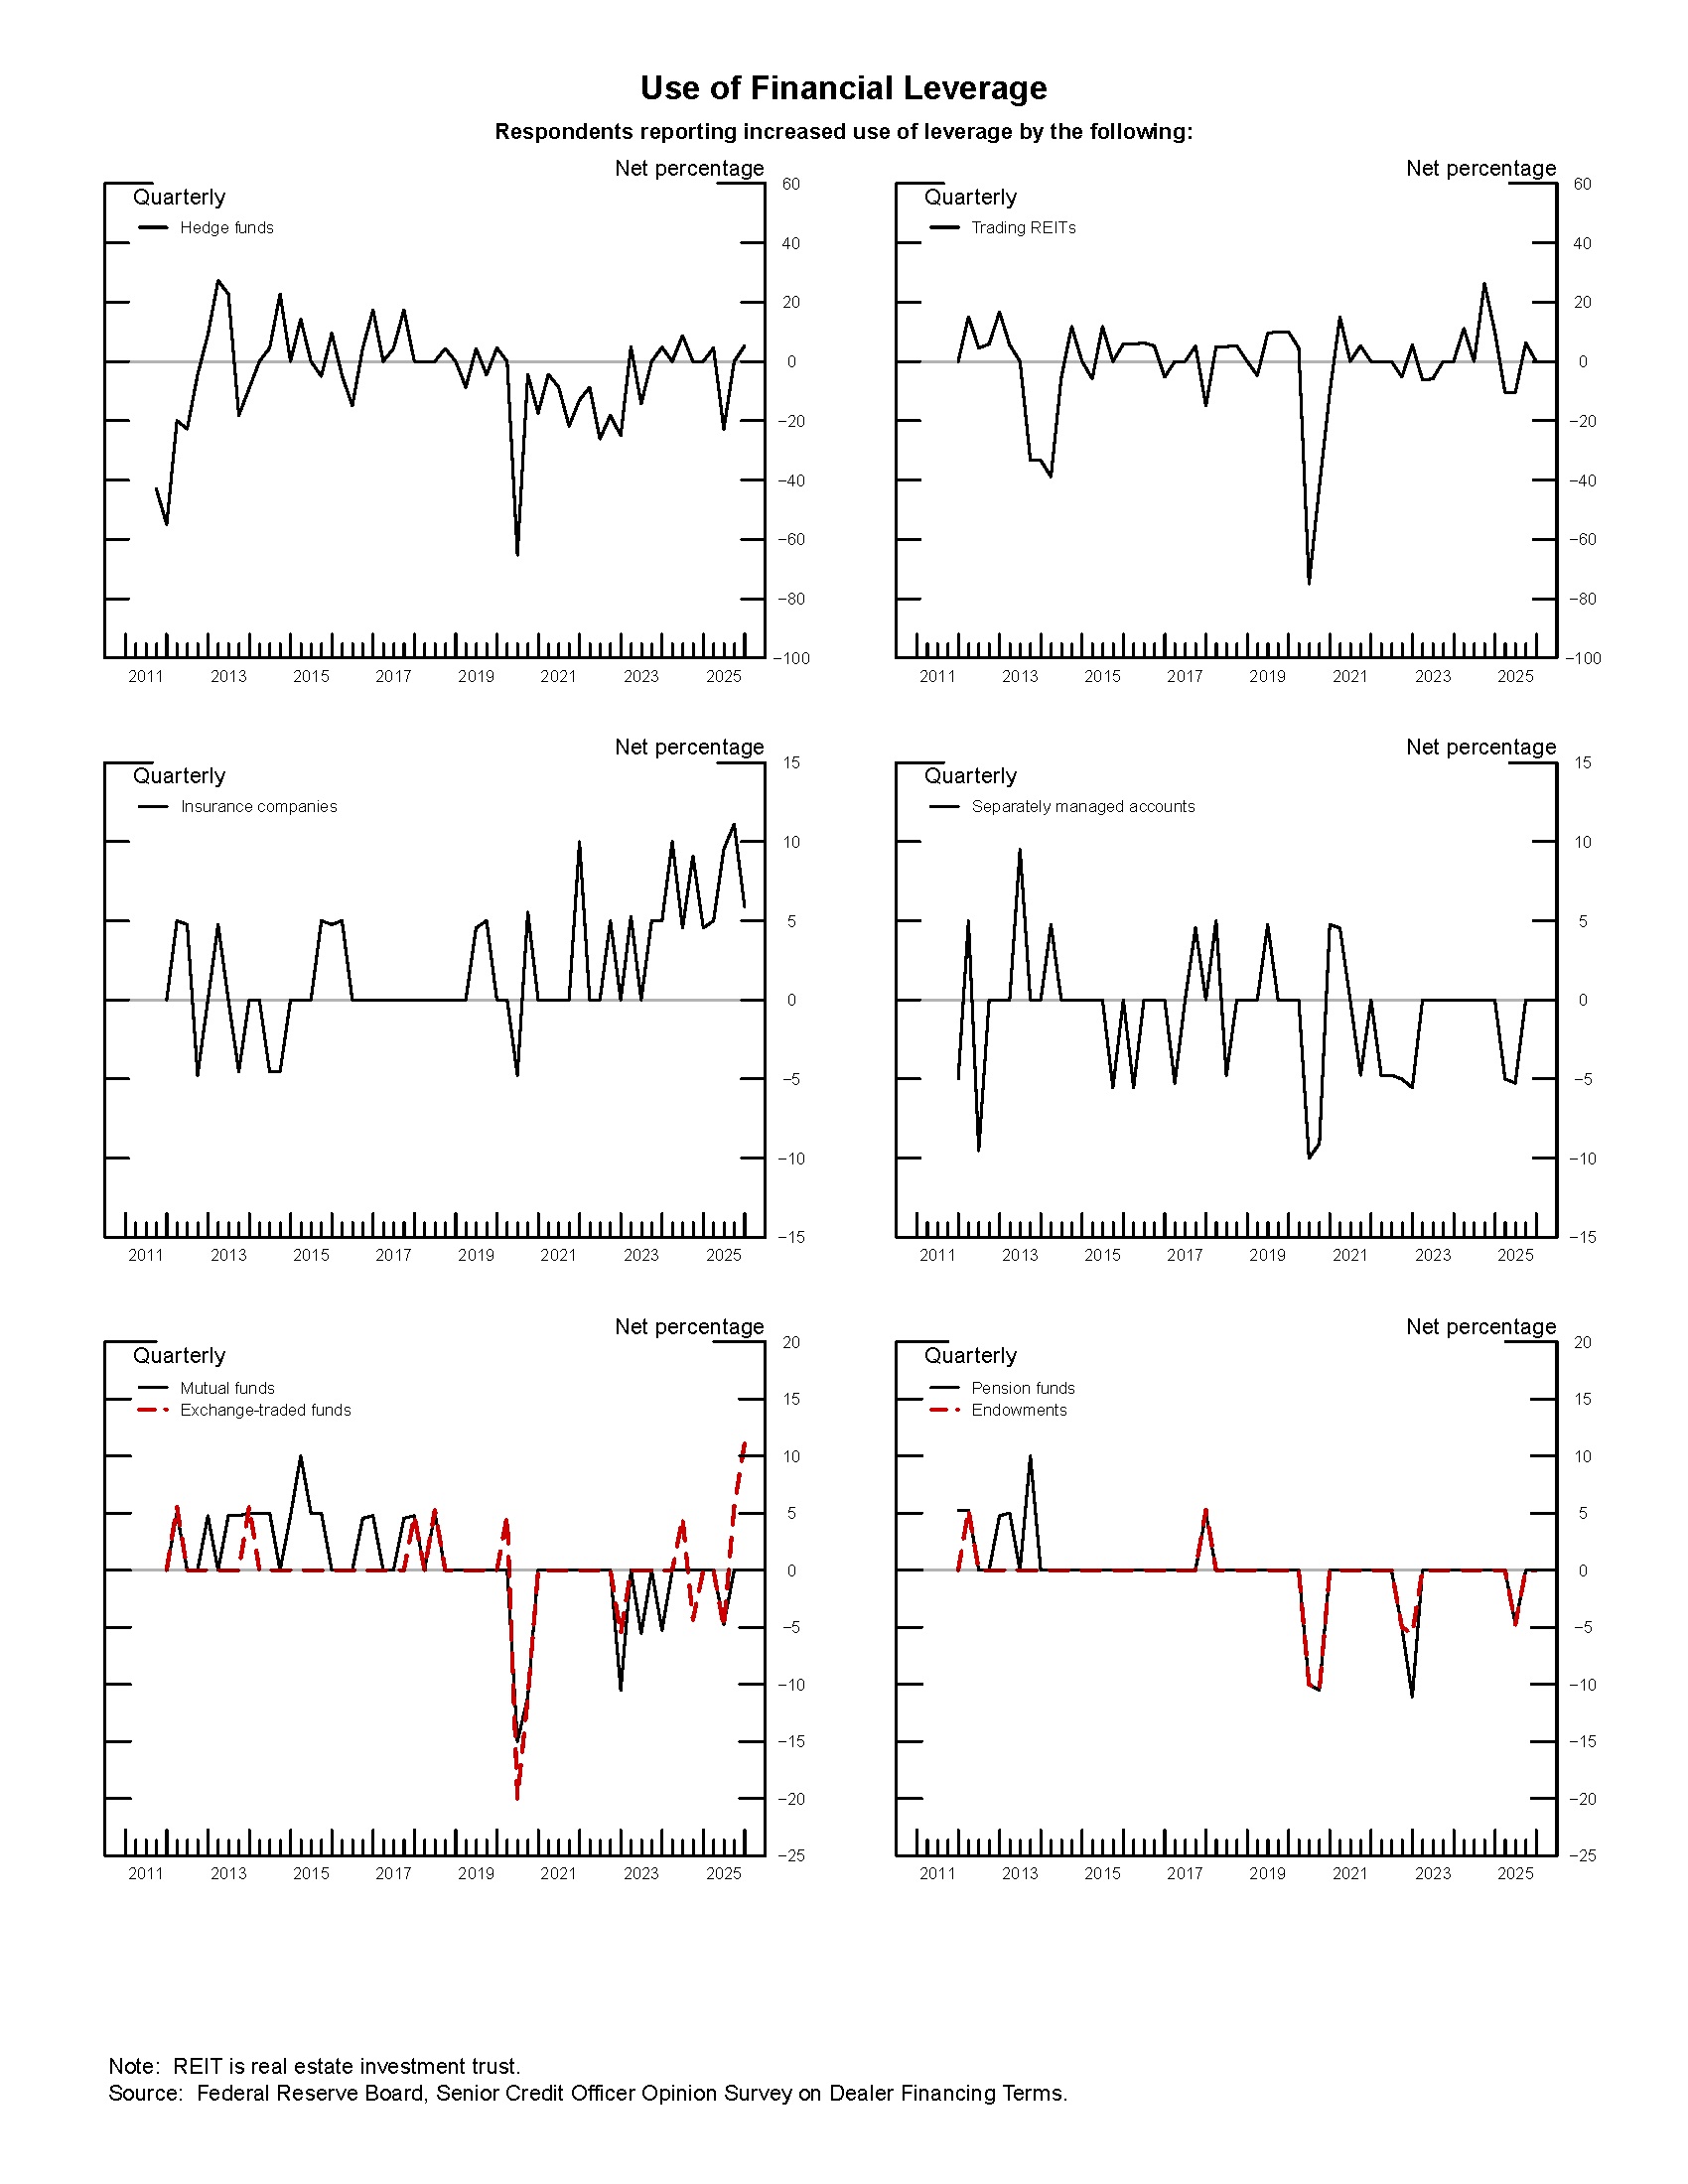
Exhibit 3: Measures of Demand for Funding and Market Functioning
Results of the December 2025 Senior Credit Officer Opinion Survey on Dealer Financing Terms
The following results include the original instructions provided to the survey respondents. Please note that percentages are based on the number of financial institutions that gave responses other than "Not applicable." Components may not add to totals due to rounding.
Counterparty Types
Questions 1 through 40 ask about credit terms applicable to, and mark and collateral disputes with, different counterparty types, considering the entire range of securities financing and over-the-counter (OTC) derivatives transactions. Question 1 focuses on dealers and other financial intermediaries as counterparties; questions 2 and 3 on central counterparties and other financial utilities; questions 4 through 10 focus on hedge funds; questions 11 through 16 on trading real estate investment trusts (REITs); questions 17 through 22 on mutual funds, exchange-traded funds (ETFs), pension plans, and endowments; questions 23 through 28 on insurance companies; questions 29 through 34 on separately managed accounts established with investment advisers; and questions 35 through 38 on nonfinancial corporations. Questions 39 and 40 ask about mark and collateral disputes for each of the aforementioned counterparty types.
In some questions, the survey differentiates between the compensation demanded for bearing credit risk (price terms) and the contractual provisions used to mitigate exposures (nonprice terms). If your institution’s terms have tightened or eased over the past three months, please so report them regardless of how they stand relative to longer-term norms. Please focus your response on dollar-denominated instruments; if material differences exist with respect to instruments denominated in other currencies, please explain in the appropriate comment space. Where material differences exist across different business areas--for example, between traditional prime brokerage and OTC derivatives--please answer with regard to the business area generating the most exposure and explain in the appropriate comment space.
Dealers and Other Financial Intermediaries
1. Over the past three months, how has the amount of resources and attention your firm devotes to management of concentrated credit exposure to dealers and other financial intermediaries (such as large banking institutions) changed?
| Number of Respondents | Percentage | |
|---|---|---|
| Increased Considerably | 0 | 0.0 |
| Increased Somewhat | 1 | 5.3 |
| Remained Basically Unchanged | 18 | 94.7 |
| Decreased Somewhat | 0 | 0.0 |
| Decreased Considerably | 0 | 0.0 |
| Total | 19 | 100.0 |
Central Counterparties and Other Financial Utilities
2. Over the past three months, how has the amount of resources and attention your firm devotes to management of concentrated credit exposure to central counterparties and other financial utilities changed?
| Number of Respondents | Percentage | |
|---|---|---|
| Increased Considerably | 0 | 0.0 |
| Increased Somewhat | 0 | 0.0 |
| Remained Basically Unchanged | 19 | 100.0 |
| Decreased Somewhat | 0 | 0.0 |
| Decreased Considerably | 0 | 0.0 |
| Total | 19 | 100.0 |
3. To what extent have changes in the practices of central counterparties, including margin requirements and haircuts, influenced the credit terms your institution applies to clients on bilateral transactions which are not cleared?
| Number of Respondents | Percentage | |
|---|---|---|
| To A Considerable Extent | 0 | 0.0 |
| To Some Extent | 2 | 10.5 |
| To A Minimal Extent | 8 | 42.1 |
| Not At All | 9 | 47.4 |
| Total | 19 | 100.0 |
Hedge Funds
4. Over the past three months, how have the price terms (for example, financing rates) offered to hedge funds as reflected across the entire spectrum of securities financing and OTC derivatives transaction types changed, regardless of nonprice terms?
| Number of Respondents | Percentage | |
|---|---|---|
| Tightened Considerably | 1 | 5.3 |
| Tightened Somewhat | 0 | 0.0 |
| Remained Basically Unchanged | 17 | 89.5 |
| Eased Somewhat | 1 | 5.3 |
| Eased Considerably | 0 | 0.0 |
| Total | 19 | 100.0 |
5. Over the past three months, how has your use of nonprice terms (for example, haircuts, maximum maturity, covenants, cure periods, cross-default provisions, or other documentation features) with respect to hedge funds across the entire spectrum of securities financing and OTC derivatives transaction types changed, regardless of price terms?
| Number of Respondents | Percentage | |
|---|---|---|
| Tightened Considerably | 0 | 0.0 |
| Tightened Somewhat | 2 | 10.5 |
| Remained Basically Unchanged | 17 | 89.5 |
| Eased Somewhat | 0 | 0.0 |
| Eased Considerably | 0 | 0.0 |
| Total | 19 | 100.0 |
6. To the extent that the price or nonprice terms applied to hedge funds have tightened or eased over the past three months (as reflected in your responses to questions 4 and 5), what are the most important reasons for the change?
- Possible reasons for tightening
- Deterioration in current or expected financial strength of counterparties
Number of Respondents Percentage Most Important 0 0.0 2nd Most Important 1 100.0 3rd Most Important 0 0.0 Total 1 100.0 - Reduced willingness of your institution to take on risk
Number of Respondents Percentage Most Important 0 0.0 2nd Most Important 0 0.0 3rd Most Important 1 100.0 Total 1 100.0 - Adoption of more-stringent market conventions (that is, collateral terms and agreements, ISDA protocols)
Number of Respondents Percentage Most Important 0 0.0 2nd Most Important 0 0.0 3rd Most Important 0 0.0 Total 0 0.0 - Higher internal treasury charges for funding
Number of Respondents Percentage Most Important 0 0.0 2nd Most Important 0 0.0 3rd Most Important 0 0.0 Total 0 0.0 - Diminished availability of balance sheet or capital at your institution
Number of Respondents Percentage Most Important 0 0.0 2nd Most Important 0 0.0 3rd Most Important 0 0.0 Total 0 0.0 - Worsening in general market liquidity and functioning
Number of Respondents Percentage Most Important 1 100.0 2nd Most Important 0 0.0 3rd Most Important 0 0.0 Total 1 100.0 - Less-aggressive competition from other institutions
Number of Respondents Percentage Most Important 0 0.0 2nd Most Important 0 0.0 3rd Most Important 0 0.0 Total 0 0.0 - Other (please specify)
Number of Respondents Percentage Most Important 2 100.0 2nd Most Important 0 0.0 3rd Most Important 0 0.0 Total 2 100.0
- Deterioration in current or expected financial strength of counterparties
- Possible reasons for easing
- Improvement in current or expected financial strength of counterparties
Number of Respondents Percentage Most Important 0 0.0 2nd Most Important 0 0.0 3rd Most Important 0 0.0 Total 0 0.0 - Increased willingness of your institution to take on risk
Number of Respondents Percentage Most Important 0 0.0 2nd Most Important 0 0.0 3rd Most Important 0 0.0 Total 0 0.0 - Adoption of less-stringent market conventions (that is, collateral terms and agreements, ISDA protocols)
Number of Respondents Percentage Most Important 0 0.0 2nd Most Important 0 0.0 3rd Most Important 0 0.0 Total 0 0.0 - Lower internal treasury charges for funding
Number of Respondents Percentage Most Important 0 0.0 2nd Most Important 0 0.0 3rd Most Important 0 0.0 Total 0 0.0 - Increased availability of balance sheet or capital at your institution
Number of Respondents Percentage Most Important 0 0.0 2nd Most Important 0 0.0 3rd Most Important 0 0.0 Total 0 0.0 - Improvement in general market liquidity and functioning
Number of Respondents Percentage Most Important 1 100.0 2nd Most Important 0 0.0 3rd Most Important 0 0.0 Total 1 100.0 - More-aggressive competition from other institutions
Number of Respondents Percentage Most Important 0 0.0 2nd Most Important 0 0.0 3rd Most Important 0 0.0 Total 0 0.0 - Other (please specify)
Number of Respondents Percentage Most Important 0 0.0 2nd Most Important 0 0.0 3rd Most Important 0 0.0 Total 0 0.0
- Improvement in current or expected financial strength of counterparties
7. How has the intensity of efforts by hedge funds to negotiate more-favorable price and nonprice terms changed over the past three months?
| Number of Respondents | Percentage | |
|---|---|---|
| Increased Considerably | 0 | 0.0 |
| Increased Somewhat | 4 | 21.1 |
| Remained Basically Unchanged | 15 | 78.9 |
| Decreased Somewhat | 0 | 0.0 |
| Decreased Considerably | 0 | 0.0 |
| Total | 19 | 100.0 |
8. Considering the entire range of transactions facilitated by your institution for such clients, how has the use of financial leverage by hedge funds changed over the past three months?
| Number of Respondents | Percentage | |
|---|---|---|
| Increased Considerably | 0 | 0.0 |
| Increased Somewhat | 1 | 5.3 |
| Remained Basically Unchanged | 18 | 94.7 |
| Decreased Somewhat | 0 | 0.0 |
| Decreased Considerably | 0 | 0.0 |
| Total | 19 | 100.0 |
9. Considering the entire range of transactions facilitated by your institution for such clients, how has the availability of additional (and currently unutilized) financial leverage under agreements currently in place with hedge funds (for example, under prime broker, warehouse agreements, and other committed but undrawn or partly drawn facilities) changed over the past three months?
| Number of Respondents | Percentage | |
|---|---|---|
| Increased Considerably | 0 | 0.0 |
| Increased Somewhat | 1 | 5.3 |
| Remained Basically Unchanged | 18 | 94.7 |
| Decreased Somewhat | 0 | 0.0 |
| Decreased Considerably | 0 | 0.0 |
| Total | 19 | 100.0 |
10. How has the provision of differential terms by your institution to most-favored (as a function of breadth, duration, and extent of relationship) hedge funds changed over the past three months?
| Number of Respondents | Percentage | |
|---|---|---|
| Increased Considerably | 0 | 0.0 |
| Increased Somewhat | 1 | 5.6 |
| Remained Basically Unchanged | 17 | 94.4 |
| Decreased Somewhat | 0 | 0.0 |
| Decreased Considerably | 0 | 0.0 |
| Total | 18 | 100.0 |
Trading Real Estate Investment Trusts
11. Over the past three months, how have the price terms (for example, financing rates) offered to trading REITs as reflected across the entire spectrum of securities financing and OTC derivatives transaction types changed, regardless of nonprice terms?
| Number of Respondents | Percentage | |
|---|---|---|
| Tightened Considerably | 0 | 0.0 |
| Tightened Somewhat | 1 | 7.1 |
| Remained Basically Unchanged | 12 | 85.7 |
| Eased Somewhat | 1 | 7.1 |
| Eased Considerably | 0 | 0.0 |
| Total | 14 | 100.0 |
12. Over the past three months, how has your use of nonprice terms (for example, haircuts, maximum maturity, covenants, cure periods, cross-default provisions or other documentation features) with respect to trading REITs across the entire spectrum of securities financing and OTC derivatives transaction types changed, regardless of price terms?
| Number of Respondents | Percentage | |
|---|---|---|
| Tightened Considerably | 0 | 0.0 |
| Tightened Somewhat | 0 | 0.0 |
| Remained Basically Unchanged | 14 | 100.0 |
| Eased Somewhat | 0 | 0.0 |
| Eased Considerably | 0 | 0.0 |
| Total | 14 | 100.0 |
13. To the extent that the price or nonprice terms applied to trading REITs have tightened or eased over the past three months (as reflected in your responses to questions 11 and 12), what are the most important reasons for the change?
- Possible reasons for tightening
- Deterioration in current or expected financial strength of counterparties
Number of Respondents Percentage Most Important 0 0.0 2nd Most Important 0 0.0 3rd Most Important 0 0.0 Total 0 0.0 - Reduced willingness of your institution to take on risk
Number of Respondents Percentage Most Important 0 0.0 2nd Most Important 0 0.0 3rd Most Important 0 0.0 Total 0 0.0 - Adoption of more-stringent market conventions (that is, collateral terms and agreements, ISDA protocols)
Number of Respondents Percentage Most Important 0 0.0 2nd Most Important 0 0.0 3rd Most Important 0 0.0 Total 0 0.0 - Higher internal treasury charges for funding
Number of Respondents Percentage Most Important 0 0.0 2nd Most Important 0 0.0 3rd Most Important 0 0.0 Total 0 0.0 - Diminished availability of balance sheet or capital at your institution
Number of Respondents Percentage Most Important 0 0.0 2nd Most Important 0 0.0 3rd Most Important 0 0.0 Total 0 0.0 - Worsening in general market liquidity and functioning
Number of Respondents Percentage Most Important 0 0.0 2nd Most Important 0 0.0 3rd Most Important 0 0.0 Total 0 0.0 - Less-aggressive competition from other institutions
Number of Respondents Percentage Most Important 0 0.0 2nd Most Important 0 0.0 3rd Most Important 0 0.0 Total 0 0.0 - Other (please specify)
Number of Respondents Percentage Most Important 1 100.0 2nd Most Important 0 0.0 3rd Most Important 0 0.0 Total 1 100.0
- Deterioration in current or expected financial strength of counterparties
- Possible reasons for easing
- Improvement in current or expected financial strength of counterparties
Number of Respondents Percentage Most Important 0 0.0 2nd Most Important 0 0.0 3rd Most Important 0 0.0 Total 0 0.0 - Increased willingness of your institution to take on risk
Number of Respondents Percentage Most Important 0 0.0 2nd Most Important 0 0.0 3rd Most Important 0 0.0 Total 0 0.0 - Adoption of less-stringent market conventions (that is, collateral terms and agreements, ISDA protocols)
Number of Respondents Percentage Most Important 0 0.0 2nd Most Important 0 0.0 3rd Most Important 0 0.0 Total 0 0.0 - Lower internal treasury charges for funding
Number of Respondents Percentage Most Important 0 0.0 2nd Most Important 0 0.0 3rd Most Important 0 0.0 Total 0 0.0 - Increased availability of balance sheet or capital at your institution
Number of Respondents Percentage Most Important 0 0.0 2nd Most Important 0 0.0 3rd Most Important 0 0.0 Total 0 0.0 - Improvement in general market liquidity and functioning
Number of Respondents Percentage Most Important 1 100.0 2nd Most Important 0 0.0 3rd Most Important 0 0.0 Total 1 100.0 - More-aggressive competition from other institutions
Number of Respondents Percentage Most Important 0 0.0 2nd Most Important 0 0.0 3rd Most Important 0 0.0 Total 0 0.0 - Other (please specify)
Number of Respondents Percentage Most Important 0 0.0 2nd Most Important 0 0.0 3rd Most Important 0 0.0 Total 0 0.0
- Improvement in current or expected financial strength of counterparties
14. How has the intensity of efforts by trading REITs to negotiate more-favorable price and nonprice terms changed over the past three months?
| Number of Respondents | Percentage | |
|---|---|---|
| Increased Considerably | 0 | 0.0 |
| Increased Somewhat | 0 | 0.0 |
| Remained Basically Unchanged | 14 | 100.0 |
| Decreased Somewhat | 0 | 0.0 |
| Decreased Considerably | 0 | 0.0 |
| Total | 14 | 100.0 |
15. Considering the entire range of transactions facilitated by your institution for such clients, how has the use of financial leverage by trading REITs changed over the past three months?
| Number of Respondents | Percentage | |
|---|---|---|
| Increased Considerably | 0 | 0.0 |
| Increased Somewhat | 0 | 0.0 |
| Remained Basically Unchanged | 14 | 100.0 |
| Decreased Somewhat | 0 | 0.0 |
| Decreased Considerably | 0 | 0.0 |
| Total | 14 | 100.0 |
16. How has the provision of differential terms by your institution to most-favored (as a function of breadth, duration, and extent of relationship) trading REITs changed over the past three months?
| Number of Respondents | Percentage | |
|---|---|---|
| Increased Considerably | 0 | 0.0 |
| Increased Somewhat | 0 | 0.0 |
| Remained Basically Unchanged | 14 | 100.0 |
| Decreased Somewhat | 0 | 0.0 |
| Decreased Considerably | 0 | 0.0 |
| Total | 14 | 100.0 |
Mutual Funds, Exchange-Traded Funds, Pension Plans, and Endowments
17. Over the past three months, how have the price terms (for example, financing rates) offered to mutual funds, ETFs, pension plans, and endowments as reflected across the entire spectrum of securities financing and OTC derivatives transaction types changed, regardless of nonprice terms?
| Number of Respondents | Percentage | |
|---|---|---|
| Tightened Considerably | 0 | 0.0 |
| Tightened Somewhat | 2 | 11.1 |
| Remained Basically Unchanged | 15 | 83.3 |
| Eased Somewhat | 1 | 5.6 |
| Eased Considerably | 0 | 0.0 |
| Total | 18 | 100.0 |
18. Over the past three months, how has your use of nonprice terms (for example, haircuts, maximum maturity, covenants, cure periods, cross-default provisions or other documentation features) with respect to mutual funds, ETFs, pension plans, and endowments across the entire spectrum of securities financing and OTC derivatives transaction types changed, regardless of price terms?
| Number of Respondents | Percentage | |
|---|---|---|
| Tightened Considerably | 0 | 0.0 |
| Tightened Somewhat | 0 | 0.0 |
| Remained Basically Unchanged | 18 | 100.0 |
| Eased Somewhat | 0 | 0.0 |
| Eased Considerably | 0 | 0.0 |
| Total | 18 | 100.0 |
19. To the extent that the price or nonprice terms applied to mutual funds, ETFs, pension plans, and endowments have tightened or eased over the past three months (as reflected in your responses to questions 17 and 18), what are the most important reasons for the change?
- Possible reasons for tightening
- Deterioration in current or expected financial strength of counterparties
Number of Respondents Percentage Most Important 0 0.0 2nd Most Important 0 0.0 3rd Most Important 0 0.0 Total 0 0.0 - Reduced willingness of your institution to take on risk
Number of Respondents Percentage Most Important 0 0.0 2nd Most Important 0 0.0 3rd Most Important 0 0.0 Total 0 0.0 - Adoption of more-stringent market conventions (that is, collateral terms and agreements, ISDA protocols)
Number of Respondents Percentage Most Important 0 0.0 2nd Most Important 0 0.0 3rd Most Important 0 0.0 Total 0 0.0 - Higher internal treasury charges for funding
Number of Respondents Percentage Most Important 0 0.0 2nd Most Important 0 0.0 3rd Most Important 0 0.0 Total 0 0.0 - Diminished availability of balance sheet or capital at your institution
Number of Respondents Percentage Most Important 0 0.0 2nd Most Important 0 0.0 3rd Most Important 0 0.0 Total 0 0.0 - Worsening in general market liquidity and functioning
Number of Respondents Percentage Most Important 1 100.0 2nd Most Important 0 0.0 3rd Most Important 0 0.0 Total 1 100.0 - Less-aggressive competition from other institutions
Number of Respondents Percentage Most Important 0 0.0 2nd Most Important 0 0.0 3rd Most Important 0 0.0 Total 0 0.0 - Other (please specify)
Number of Respondents Percentage Most Important 1 100.0 2nd Most Important 0 0.0 3rd Most Important 0 0.0 Total 1 100.0
- Deterioration in current or expected financial strength of counterparties
- Possible reasons for easing
- Improvement in current or expected financial strength of counterparties
Number of Respondents Percentage Most Important 0 0.0 2nd Most Important 0 0.0 3rd Most Important 0 0.0 Total 0 0.0 - Increased willingness of your institution to take on risk
Number of Respondents Percentage Most Important 0 0.0 2nd Most Important 0 0.0 3rd Most Important 0 0.0 Total 0 0.0 - Adoption of less-stringent market conventions (that is, collateral terms and agreements, ISDA protocols)
Number of Respondents Percentage Most Important 0 0.0 2nd Most Important 0 0.0 3rd Most Important 0 0.0 Total 0 0.0 - Lower internal treasury charges for funding
Number of Respondents Percentage Most Important 0 0.0 2nd Most Important 0 0.0 3rd Most Important 0 0.0 Total 0 0.0 - Increased availability of balance sheet or capital at your institution
Number of Respondents Percentage Most Important 0 0.0 2nd Most Important 0 0.0 3rd Most Important 0 0.0 Total 0 0.0 - Improvement in general market liquidity and functioning
Number of Respondents Percentage Most Important 1 100.0 2nd Most Important 0 0.0 3rd Most Important 0 0.0 Total 1 100.0 - More-aggressive competition from other institutions
Number of Respondents Percentage Most Important 0 0.0 2nd Most Important 0 0.0 3rd Most Important 0 0.0 Total 0 0.0 - Other (please specify)
Number of Respondents Percentage Most Important 0 0.0 2nd Most Important 0 0.0 3rd Most Important 0 0.0 Total 0 0.0
- Improvement in current or expected financial strength of counterparties
20. How has the intensity of efforts by mutual funds, ETFs, pension plans, and endowments to negotiate more-favorable price and nonprice terms changed over the past three months?
| Number of Respondents | Percentage | |
|---|---|---|
| Increased Considerably | 0 | 0.0 |
| Increased Somewhat | 0 | 0.0 |
| Remained Basically Unchanged | 18 | 100.0 |
| Decreased Somewhat | 0 | 0.0 |
| Decreased Considerably | 0 | 0.0 |
| Total | 18 | 100.0 |
21. Considering the entire range of transactions facilitated by your institution, how has the use of financial leverage by each of the following types of clients changed over the past three months?
- Mutual funds
Number of Respondents Percentage Increased Considerably 0 0.0 Increased Somewhat 0 0.0 Remained Basically Unchanged 18 100.0 Decreased Somewhat 0 0.0 Decreased Considerably 0 0.0 Total 18 100.0 - ETFs
Number of Respondents Percentage Increased Considerably 0 0.0 Increased Somewhat 2 11.1 Remained Basically Unchanged 16 88.9 Decreased Somewhat 0 0.0 Decreased Considerably 0 0.0 Total 18 100.0 - Pension plans
Number of Respondents Percentage Increased Considerably 0 0.0 Increased Somewhat 0 0.0 Remained Basically Unchanged 18 100.0 Decreased Somewhat 0 0.0 Decreased Considerably 0 0.0 Total 18 100.0 - Endowments
Number of Respondents Percentage Increased Considerably 0 0.0 Increased Somewhat 0 0.0 Remained Basically Unchanged 17 100.0 Decreased Somewhat 0 0.0 Decreased Considerably 0 0.0 Total 17 100.0
22. How has the provision of differential terms by your institution to most-favored (as a function of breadth, duration, and extent of relationship) mutual funds, ETFs, pension plans, and endowments changed over the past three months?
| Number of Respondents | Percentage | |
|---|---|---|
| Increased Considerably | 0 | 0.0 |
| Increased Somewhat | 0 | 0.0 |
| Remained Basically Unchanged | 18 | 100.0 |
| Decreased Somewhat | 0 | 0.0 |
| Decreased Considerably | 0 | 0.0 |
| Total | 18 | 100.0 |
Insurance Companies
23. Over the past three months, how have the price terms (for example, financing rates) offered to insurance companies as reflected across the entire spectrum of securities financing and OTC derivatives transaction types changed, regardless of nonprice terms?
| Number of Respondents | Percentage | |
|---|---|---|
| Tightened Considerably | 0 | 0.0 |
| Tightened Somewhat | 2 | 11.8 |
| Remained Basically Unchanged | 15 | 88.2 |
| Eased Somewhat | 0 | 0.0 |
| Eased Considerably | 0 | 0.0 |
| Total | 17 | 100.0 |
24. Over the past three months, how has your use of nonprice terms (for example, haircuts, maximum maturity, covenants, cure periods, cross-default provisions or other documentation features) with respect to insurance companies across the entire spectrum of securities financing and OTC derivatives transaction types changed, regardless of price terms?
| Number of Respondents | Percentage | |
|---|---|---|
| Tightened Considerably | 0 | 0.0 |
| Tightened Somewhat | 0 | 0.0 |
| Remained Basically Unchanged | 17 | 100.0 |
| Eased Somewhat | 0 | 0.0 |
| Eased Considerably | 0 | 0.0 |
| Total | 17 | 100.0 |
25. To the extent that the price or nonprice terms applied to insurance companies have tightened or eased over the past three months (as reflected in your responses to questions 23 and 24), what are the most important reasons for the change?
- Possible reasons for tightening
- Deterioration in current or expected financial strength of counterparties
Number of Respondents Percentage Most Important 0 0.0 2nd Most Important 0 0.0 3rd Most Important 0 0.0 Total 0 0.0 - Reduced willingness of your institution to take on risk
Number of Respondents Percentage Most Important 0 0.0 2nd Most Important 0 0.0 3rd Most Important 0 0.0 Total 0 0.0 - Adoption of more-stringent market conventions (that is, collateral terms and agreements, ISDA protocols)
Number of Respondents Percentage Most Important 0 0.0 2nd Most Important 0 0.0 3rd Most Important 0 0.0 Total 0 0.0 - Higher internal treasury charges for funding
Number of Respondents Percentage Most Important 0 0.0 2nd Most Important 0 0.0 3rd Most Important 0 0.0 Total 0 0.0 - Diminished availability of balance sheet or capital at your institution
Number of Respondents Percentage Most Important 0 0.0 2nd Most Important 0 0.0 3rd Most Important 0 0.0 Total 0 0.0 - Worsening in general market liquidity and functioning
Number of Respondents Percentage Most Important 1 100.0 2nd Most Important 0 0.0 3rd Most Important 0 0.0 Total 1 100.0 - Less-aggressive competition from other institutions
Number of Respondents Percentage Most Important 0 0.0 2nd Most Important 0 0.0 3rd Most Important 0 0.0 Total 0 0.0 - Other (please specify)
Number of Respondents Percentage Most Important 1 100.0 2nd Most Important 0 0.0 3rd Most Important 0 0.0 Total 1 100.0
- Deterioration in current or expected financial strength of counterparties
- Possible reasons for easing
- Improvement in current or expected financial strength of counterparties
Number of Respondents Percentage Most Important 0 0.0 2nd Most Important 0 0.0 3rd Most Important 0 0.0 Total 0 0.0 - Increased willingness of your institution to take on risk
Number of Respondents Percentage Most Important 0 0.0 2nd Most Important 0 0.0 3rd Most Important 0 0.0 Total 0 0.0 - Adoption of less-stringent market conventions (that is, collateral terms and agreements, ISDA protocols)
Number of Respondents Percentage Most Important 0 0.0 2nd Most Important 0 0.0 3rd Most Important 0 0.0 Total 0 0.0 - Lower internal treasury charges for funding
Number of Respondents Percentage Most Important 0 0.0 2nd Most Important 0 0.0 3rd Most Important 0 0.0 Total 0 0.0 - Increased availability of balance sheet or capital at your institution
Number of Respondents Percentage Most Important 0 0.0 2nd Most Important 0 0.0 3rd Most Important 0 0.0 Total 0 0.0 - Improvement in general market liquidity and functioning
Number of Respondents Percentage Most Important 0 0.0 2nd Most Important 0 0.0 3rd Most Important 0 0.0 Total 0 0.0 - More-aggressive competition from other institutions
Number of Respondents Percentage Most Important 0 0.0 2nd Most Important 0 0.0 3rd Most Important 0 0.0 Total 0 0.0 - Other (please specify)
Number of Respondents Percentage Most Important 0 0.0 2nd Most Important 0 0.0 3rd Most Important 0 0.0 Total 0 0.0
- Improvement in current or expected financial strength of counterparties
26. How has the intensity of efforts by insurance companies to negotiate more favorable price and nonprice terms changed over the past three months?
| Number of Respondents | Percentage | |
|---|---|---|
| Increased Considerably | 0 | 0.0 |
| Increased Somewhat | 1 | 5.9 |
| Remained Basically Unchanged | 16 | 94.1 |
| Decreased Somewhat | 0 | 0.0 |
| Decreased Considerably | 0 | 0.0 |
| Total | 17 | 100.0 |
27. Considering the entire range of transactions facilitated by your institution for such clients, how has the use of financial leverage by insurance companies changed over the past three months?
| Number of Respondents | Percentage | |
|---|---|---|
| Increased Considerably | 0 | 0.0 |
| Increased Somewhat | 1 | 5.9 |
| Remained Basically Unchanged | 16 | 94.1 |
| Decreased Somewhat | 0 | 0.0 |
| Decreased Considerably | 0 | 0.0 |
| Total | 17 | 100.0 |
28. How has the provision of differential terms by your institution to most-favored (as a function of breadth, duration, and extent of relationship) insurance companies changed over the past three months?
| Number of Respondents | Percentage | |
|---|---|---|
| Increased Considerably | 0 | 0.0 |
| Increased Somewhat | 0 | 0.0 |
| Remained Basically Unchanged | 16 | 100.0 |
| Decreased Somewhat | 0 | 0.0 |
| Decreased Considerably | 0 | 0.0 |
| Total | 16 | 100.0 |
Investment Advisers to Separately Managed Accounts
29. Over the past three months, how have the price terms (for example, financing rates) offered to separately managed accounts established with investment advisers as reflected across the entire spectrum of securities financing and OTC derivatives transaction types changed, regardless of nonprice terms?
| Number of Respondents | Percentage | |
|---|---|---|
| Tightened Considerably | 0 | 0.0 |
| Tightened Somewhat | 2 | 11.8 |
| Remained Basically Unchanged | 14 | 82.4 |
| Eased Somewhat | 1 | 5.9 |
| Eased Considerably | 0 | 0.0 |
| Total | 17 | 100.0 |
30. Over the past three months, how has your use of nonprice terms (for example, haircuts, maximum maturity, covenants, cure periods, cross-default provisions or other documentation features) with respect to separately managed accounts established with investment advisers across the entire spectrum of securities financing and OTC derivatives transaction types changed, regardless of price terms?
| Number of Respondents | Percentage | |
|---|---|---|
| Tightened Considerably | 0 | 0.0 |
| Tightened Somewhat | 0 | 0.0 |
| Remained Basically Unchanged | 17 | 100.0 |
| Eased Somewhat | 0 | 0.0 |
| Eased Considerably | 0 | 0.0 |
| Total | 17 | 100.0 |
31. To the extent that the price or nonprice terms applied to separately managed accounts established with investment advisers have tightened or eased over the past three months (as reflected in your responses to questions 29 and 30), what are the most important reasons for the change?
- Possible reasons for tightening
- Deterioration in current or expected financial strength of counterparties
Number of Respondents Percentage Most Important 0 0.0 2nd Most Important 0 0.0 3rd Most Important 0 0.0 Total 0 0.0 - Reduced willingness of your institution to take on risk
Number of Respondents Percentage Most Important 0 0.0 2nd Most Important 0 0.0 3rd Most Important 0 0.0 Total 0 0.0 - Adoption of more-stringent market conventions (that is, collateral terms and agreements, ISDA protocols)
Number of Respondents Percentage Most Important 0 0.0 2nd Most Important 0 0.0 3rd Most Important 0 0.0 Total 0 0.0 - Higher internal treasury charges for funding
Number of Respondents Percentage Most Important 0 0.0 2nd Most Important 0 0.0 3rd Most Important 0 0.0 Total 0 0.0 - Diminished availability of balance sheet or capital at your institution
Number of Respondents Percentage Most Important 0 0.0 2nd Most Important 0 0.0 3rd Most Important 0 0.0 Total 0 0.0 - Worsening in general market liquidity and functioning
Number of Respondents Percentage Most Important 1 100.0 2nd Most Important 0 0.0 3rd Most Important 0 0.0 Total 1 100.0 - Less-aggressive competition from other institutions
Number of Respondents Percentage Most Important 0 0.0 2nd Most Important 0 0.0 3rd Most Important 0 0.0 Total 0 0.0 - Other (please specify)
Number of Respondents Percentage Most Important 1 100.0 2nd Most Important 0 0.0 3rd Most Important 0 0.0 Total 1 100.0
- Deterioration in current or expected financial strength of counterparties
- Possible reasons for easing
- Improvement in current or expected financial strength of counterparties
Number of Respondents Percentage Most Important 0 0.0 2nd Most Important 0 0.0 3rd Most Important 0 0.0 Total 0 0.0 - Increased willingness of your institution to take on risk
Number of Respondents Percentage Most Important 0 0.0 2nd Most Important 0 0.0 3rd Most Important 0 0.0 Total 0 0.0 - Adoption of less-stringent market conventions (that is, collateral terms and agreements, ISDA protocols)
Number of Respondents Percentage Most Important 0 0.0 2nd Most Important 0 0.0 3rd Most Important 0 0.0 Total 0 0.0 - Lower internal treasury charges for funding
Number of Respondents Percentage Most Important 0 0.0 2nd Most Important 0 0.0 3rd Most Important 0 0.0 Total 0 0.0 - Increased availability of balance sheet or capital at your institution
Number of Respondents Percentage Most Important 0 0.0 2nd Most Important 0 0.0 3rd Most Important 0 0.0 Total 0 0.0 - Improvement in general market liquidity and functioning
Number of Respondents Percentage Most Important 1 100.0 2nd Most Important 0 0.0 3rd Most Important 0 0.0 Total 1 100.0 - More-aggressive competition from other institutions
Number of Respondents Percentage Most Important 0 0.0 2nd Most Important 0 0.0 3rd Most Important 0 0.0 Total 0 0.0 - Other (please specify)
Number of Respondents Percentage Most Important 0 0.0 2nd Most Important 0 0.0 3rd Most Important 0 0.0 Total 0 0.0
- Improvement in current or expected financial strength of counterparties
32. How has the intensity of efforts by investment advisers to negotiate more-favorable price and nonprice terms on behalf of separately managed accounts changed over the past three months?
| Number of Respondents | Percentage | |
|---|---|---|
| Increased Considerably | 0 | 0.0 |
| Increased Somewhat | 1 | 5.9 |
| Remained Basically Unchanged | 16 | 94.1 |
| Decreased Somewhat | 0 | 0.0 |
| Decreased Considerably | 0 | 0.0 |
| Total | 17 | 100.0 |
33. Considering the entire range of transactions facilitated by your institution for such clients, how has the use of financial leverage by separately managed accounts established with investment advisers changed over the past three months?
| Number of Respondents | Percentage | |
|---|---|---|
| Increased Considerably | 0 | 0.0 |
| Increased Somewhat | 0 | 0.0 |
| Remained Basically Unchanged | 17 | 100.0 |
| Decreased Somewhat | 0 | 0.0 |
| Decreased Considerably | 0 | 0.0 |
| Total | 17 | 100.0 |
34. How has the provision of differential terms by your institution to separately managed accounts established with most-favored (as a function of breadth, duration, and extent of relationship) investment advisers changed over the past three months?
| Number of Respondents | Percentage | |
|---|---|---|
| Increased Considerably | 0 | 0.0 |
| Increased Somewhat | 0 | 0.0 |
| Remained Basically Unchanged | 17 | 100.0 |
| Decreased Somewhat | 0 | 0.0 |
| Decreased Considerably | 0 | 0.0 |
| Total | 17 | 100.0 |
Nonfinancial Corporations
35. Over the past three months, how have the price terms (for example, financing rates) offered to nonfinancial corporations as reflected across the entire spectrum of securities financing and OTC derivatives transaction types changed, regardless of nonprice terms?
| Number of Respondents | Percentage | |
|---|---|---|
| Tightened Considerably | 0 | 0.0 |
| Tightened Somewhat | 1 | 5.9 |
| Remained Basically Unchanged | 16 | 94.1 |
| Eased Somewhat | 0 | 0.0 |
| Eased Considerably | 0 | 0.0 |
| Total | 17 | 100.0 |
36. Over the past three months, how has your use of nonprice terms (for example, haircuts, maximum maturity, covenants, cure periods, cross-default provisions or other documentation features) with respect to nonfinancial corporations across the entire spectrum of securities financing and OTC derivatives transaction types changed, regardless of price terms?
| Number of Respondents | Percentage | |
|---|---|---|
| Tightened Considerably | 0 | 0.0 |
| Tightened Somewhat | 0 | 0.0 |
| Remained Basically Unchanged | 17 | 100.0 |
| Eased Somewhat | 0 | 0.0 |
| Eased Considerably | 0 | 0.0 |
| Total | 17 | 100.0 |
37. To the extent that the price or nonprice terms applied to nonfinancial corporations have tightened or eased over the past three months (as reflected in your responses to questions 35 and 36), what are the most important reasons for the change?
- Possible reasons for tightening
- Deterioration in current or expected financial strength of counterparties
Number of Respondents Percentage Most Important 0 0.0 2nd Most Important 0 0.0 3rd Most Important 0 0.0 Total 0 0.0 - Reduced willingness of your institution to take on risk
Number of Respondents Percentage Most Important 0 0.0 2nd Most Important 0 0.0 3rd Most Important 0 0.0 Total 0 0.0 - Adoption of more-stringent market conventions (that is, collateral terms and agreements, ISDA protocols)
Number of Respondents Percentage Most Important 0 0.0 2nd Most Important 0 0.0 3rd Most Important 0 0.0 Total 0 0.0 - Higher internal treasury charges for funding
Number of Respondents Percentage Most Important 0 0.0 2nd Most Important 0 0.0 3rd Most Important 0 0.0 Total 0 0.0 - Diminished availability of balance sheet or capital at your institution
Number of Respondents Percentage Most Important 0 0.0 2nd Most Important 0 0.0 3rd Most Important 0 0.0 Total 0 0.0 - Worsening in general market liquidity and functioning
Number of Respondents Percentage Most Important 0 0.0 2nd Most Important 0 0.0 3rd Most Important 0 0.0 Total 0 0.0 - Less-aggressive competition from other institutions
Number of Respondents Percentage Most Important 0 0.0 2nd Most Important 0 0.0 3rd Most Important 0 0.0 Total 0 0.0 - Other (please specify)
Number of Respondents Percentage Most Important 1 100.0 2nd Most Important 0 0.0 3rd Most Important 0 0.0 Total 1 100.0
- Deterioration in current or expected financial strength of counterparties
- Possible reasons for easing
- Improvement in current or expected financial strength of counterparties
Number of Respondents Percentage Most Important 0 0.0 2nd Most Important 0 0.0 3rd Most Important 0 0.0 Total 0 0.0 - Increased willingness of your institution to take on risk
Number of Respondents Percentage Most Important 0 0.0 2nd Most Important 0 0.0 3rd Most Important 0 0.0 Total 0 0.0 - Adoption of less-stringent market conventions (that is, collateral terms and agreements, ISDA protocols)
Number of Respondents Percentage Most Important 0 0.0 2nd Most Important 0 0.0 3rd Most Important 0 0.0 Total 0 0.0 - Lower internal treasury charges for funding
Number of Respondents Percentage Most Important 0 0.0 2nd Most Important 0 0.0 3rd Most Important 0 0.0 Total 0 0.0 - Increased availability of balance sheet or capital at your institution
Number of Respondents Percentage Most Important 0 0.0 2nd Most Important 0 0.0 3rd Most Important 0 0.0 Total 0 0.0 - Improvement in general market liquidity and functioning
Number of Respondents Percentage Most Important 0 0.0 2nd Most Important 0 0.0 3rd Most Important 0 0.0 Total 0 0.0 - More-aggressive competition from other institutions
Number of Respondents Percentage Most Important 0 0.0 2nd Most Important 0 0.0 3rd Most Important 0 0.0 Total 0 0.0 - Other (please specify)
Number of Respondents Percentage Most Important 0 0.0 2nd Most Important 0 0.0 3rd Most Important 0 0.0 Total 0 0.0
- Improvement in current or expected financial strength of counterparties
38. How has the intensity of efforts by nonfinancial corporations to negotiate more favorable price and nonprice terms changed over the past three months?
| Number of Respondents | Percentage | |
|---|---|---|
| Increased Considerably | 0 | 0.0 |
| Increased Somewhat | 0 | 0.0 |
| Remained Basically Unchanged | 17 | 100.0 |
| Decreased Somewhat | 0 | 0.0 |
| Decreased Considerably | 0 | 0.0 |
| Total | 17 | 100.0 |
Mark and Collateral Disputes
39. Over the past three months, how has the volume of mark and collateral disputes with clients of each of the following types changed?
- Dealers and other financial intermediaries
Number of Respondents Percentage Increased Considerably 0 0.0 Increased Somewhat 1 5.3 Remained Basically Unchanged 16 84.2 Decreased Somewhat 2 10.5 Decreased Considerably 0 0.0 Total 19 100.0 - Hedge funds
Number of Respondents Percentage Increased Considerably 1 5.3 Increased Somewhat 0 0.0 Remained Basically Unchanged 18 94.7 Decreased Somewhat 0 0.0 Decreased Considerably 0 0.0 Total 19 100.0 - Trading REITs
Number of Respondents Percentage Increased Considerably 0 0.0 Increased Somewhat 0 0.0 Remained Basically Unchanged 13 92.9 Decreased Somewhat 0 0.0 Decreased Considerably 1 7.1 Total 14 100.0 - Mutual funds, ETFs, pension plans, and endowments
Number of Respondents Percentage Increased Considerably 1 5.6 Increased Somewhat 1 5.6 Remained Basically Unchanged 15 83.3 Decreased Somewhat 1 5.6 Decreased Considerably 0 0.0 Total 18 100.0 - Insurance companies
Number of Respondents Percentage Increased Considerably 0 0.0 Increased Somewhat 0 0.0 Remained Basically Unchanged 15 88.2 Decreased Somewhat 2 11.8 Decreased Considerably 0 0.0 Total 17 100.0 - Separately managed accounts established with investment advisers
Number of Respondents Percentage Increased Considerably 0 0.0 Increased Somewhat 0 0.0 Remained Basically Unchanged 17 100.0 Decreased Somewhat 0 0.0 Decreased Considerably 0 0.0 Total 17 100.0 - Nonfinancial corporations
Number of Respondents Percentage Increased Considerably 0 0.0 Increased Somewhat 0 0.0 Remained Basically Unchanged 17 100.0 Decreased Somewhat 0 0.0 Decreased Considerably 0 0.0 Total 17 100.0
40. Over the past three months, how has the duration and persistence of mark and collateral disputes with clients of each of the following types changed?
- Dealers and other financial intermediaries
Number of Respondents Percentage Increased Considerably 0 0.0 Increased Somewhat 1 5.3 Remained Basically Unchanged 18 94.7 Decreased Somewhat 0 0.0 Decreased Considerably 0 0.0 Total 19 100.0 - Hedge funds
Number of Respondents Percentage Increased Considerably 0 0.0 Increased Somewhat 0 0.0 Remained Basically Unchanged 18 94.7 Decreased Somewhat 1 5.3 Decreased Considerably 0 0.0 Total 19 100.0 - Trading REITs
Number of Respondents Percentage Increased Considerably 0 0.0 Increased Somewhat 0 0.0 Remained Basically Unchanged 14 100.0 Decreased Somewhat 0 0.0 Decreased Considerably 0 0.0 Total 14 100.0 - Mutual funds, ETFs, pension plans, and endowments
Number of Respondents Percentage Increased Considerably 0 0.0 Increased Somewhat 0 0.0 Remained Basically Unchanged 18 100.0 Decreased Somewhat 0 0.0 Decreased Considerably 0 0.0 Total 18 100.0 - Insurance companies
Number of Respondents Percentage Increased Considerably 0 0.0 Increased Somewhat 1 5.9 Remained Basically Unchanged 16 94.1 Decreased Somewhat 0 0.0 Decreased Considerably 0 0.0 Total 17 100.0 - Separately managed accounts established with investment advisers
Number of Respondents Percentage Increased Considerably 0 0.0 Increased Somewhat 0 0.0 Remained Basically Unchanged 17 100.0 Decreased Somewhat 0 0.0 Decreased Considerably 0 0.0 Total 17 100.0 - Nonfinancial corporations
Number of Respondents Percentage Increased Considerably 0 0.0 Increased Somewhat 0 0.0 Remained Basically Unchanged 16 94.1 Decreased Somewhat 1 5.9 Decreased Considerably 0 0.0 Total 17 100.0
Over-the-Counter Derivatives
Questions 41 through 51 ask about OTC derivatives trades. Question 41 focuses on nonprice terms applicable to new and renegotiated master agreements. Questions 42 through 48 ask about the initial margin requirements for most-favored and average clients applicable to different types of contracts: Question 42 focuses on foreign exchange (FX); question 43 on interest rates; question 44 on equity; question 45 on contracts referencing corporate credits (single-name and indexes); question 46 on credit derivatives referencing structured products such as mortgage-backed securities (MBS) and asset-backed securities (ABS) (specific tranches and indexes); question 47 on commodities; and question 48 on total return swaps (TRS) referencing nonsecurities (such as bank loans, including, for example, commercial and industrial loans and mortgage whole loans). Question 49 asks about posting of nonstandard collateral pursuant to OTC derivative contracts. Questions 50 and 51 focus on mark and collateral disputes involving contracts of each of the aforementioned types.
If your institution’s terms have tightened or eased over the past three months, please so report them regardless of how they stand relative to longer-term norms. Please focus your response on dollar-denominated instruments; if material differences exist with respect to instruments denominated in other currencies, please explain in the appropriate comment space.
New and Renegotiated Master Agreements
41. Over the past three months, how have nonprice terms incorporated in new or renegotiated OTC derivatives master agreements put in place with your institution's clients changed?
- Requirements, timelines, and thresholds for posting additional margin
Number of Respondents Percentage Tightened Considerably 0 0.0 Tightened Somewhat 0 0.0 Remained Basically Unchanged 17 100.0 Eased Somewhat 0 0.0 Eased Considerably 0 0.0 Total 17 100.0 - Acceptable collateral
Number of Respondents Percentage Tightened Considerably 0 0.0 Tightened Somewhat 0 0.0 Remained Basically Unchanged 17 100.0 Eased Somewhat 0 0.0 Eased Considerably 0 0.0 Total 17 100.0 - Recognition of portfolio or diversification benefits (including from securities financing trades where appropriate agreements are in place)
Number of Respondents Percentage Tightened Considerably 0 0.0 Tightened Somewhat 0 0.0 Remained Basically Unchanged 17 100.0 Eased Somewhat 0 0.0 Eased Considerably 0 0.0 Total 17 100.0 - Triggers and covenants
Number of Respondents Percentage Tightened Considerably 0 0.0 Tightened Somewhat 0 0.0 Remained Basically Unchanged 15 88.2 Eased Somewhat 2 11.8 Eased Considerably 0 0.0 Total 17 100.0 - Other documentation features (including cure periods and cross-default provisions)
Number of Respondents Percentage Tightened Considerably 0 0.0 Tightened Somewhat 0 0.0 Remained Basically Unchanged 15 88.2 Eased Somewhat 2 11.8 Eased Considerably 0 0.0 Total 17 100.0 - Other (please specify)
Number of Respondents Percentage Tightened Considerably 0 0.0 Tightened Somewhat 0 0.0 Remained Basically Unchanged 1 100.0 Eased Somewhat 0 0.0 Eased Considerably 0 0.0 Total 1 100.0
Initial Margin
42. Over the past three months, how have initial margin requirements set by your institution with respect to OTC FX derivatives changed?
- Initial margin requirements for average clients
Number of Respondents Percentage Increased Considerably 0 0.0 Increased Somewhat 1 6.3 Remained Basically Unchanged 15 93.8 Decreased Somewhat 0 0.0 Decreased Considerably 0 0.0 Total 16 100.0 - Initial margin requirements for most favored clients, as a consequence of breadth, duration, and/or extent of relationship
Number of Respondents Percentage Increased Considerably 0 0.0 Increased Somewhat 1 6.3 Remained Basically Unchanged 14 87.5 Decreased Somewhat 1 6.3 Decreased Considerably 0 0.0 Total 16 100.0
43. Over the past three months, how have initial margin requirements set by your institution with respect to OTC interest rate derivatives changed?
- Initial margin requirements for average clients
Number of Respondents Percentage Increased Considerably 1 6.7 Increased Somewhat 0 0.0 Remained Basically Unchanged 14 93.3 Decreased Somewhat 0 0.0 Decreased Considerably 0 0.0 Total 15 100.0 - Initial margin requirements for most favored clients, as a consequence of breadth, duration, and/or extent of relationship
Number of Respondents Percentage Increased Considerably 1 6.7 Increased Somewhat 0 0.0 Remained Basically Unchanged 14 93.3 Decreased Somewhat 0 0.0 Decreased Considerably 0 0.0 Total 15 100.0
44. Over the past three months, how have initial margin requirements set by your institution with respect to OTC equity derivatives changed?
- Initial margin requirements for average clients
Number of Respondents Percentage Increased Considerably 0 0.0 Increased Somewhat 1 6.7 Remained Basically Unchanged 14 93.3 Decreased Somewhat 0 0.0 Decreased Considerably 0 0.0 Total 15 100.0 - Initial margin requirements for most favored clients, as a consequence of breadth, duration, and/or extent of relationship
Number of Respondents Percentage Increased Considerably 0 0.0 Increased Somewhat 0 0.0 Remained Basically Unchanged 15 100.0 Decreased Somewhat 0 0.0 Decreased Considerably 0 0.0 Total 15 100.0
45. Over the past three months, how have initial margin requirements set by your institution with respect to OTC credit derivatives referencing corporates (single-name corporates or corporate indexes) changed?
- Initial margin requirements for average clients
Number of Respondents Percentage Increased Considerably 0 0.0 Increased Somewhat 0 0.0 Remained Basically Unchanged 13 100.0 Decreased Somewhat 0 0.0 Decreased Considerably 0 0.0 Total 13 100.0 - Initial margin requirements for most favored clients, as a consequence of breadth, duration, and/or extent of relationship
Number of Respondents Percentage Increased Considerably 0 0.0 Increased Somewhat 0 0.0 Remained Basically Unchanged 13 100.0 Decreased Somewhat 0 0.0 Decreased Considerably 0 0.0 Total 13 100.0
46. Over the past three months, how have initial margin requirements set by your institution with respect to OTC credit derivatives referencing securitized products (such as specific ABS or MBS tranches and associated indexes) changed?
- Initial margin requirements for average clients
Number of Respondents Percentage Increased Considerably 0 0.0 Increased Somewhat 0 0.0 Remained Basically Unchanged 11 100.0 Decreased Somewhat 0 0.0 Decreased Considerably 0 0.0 Total 11 100.0 - Initial margin requirements for most favored clients, as a consequence of breadth, duration, and/or extent of relationship
Number of Respondents Percentage Increased Considerably 0 0.0 Increased Somewhat 0 0.0 Remained Basically Unchanged 11 100.0 Decreased Somewhat 0 0.0 Decreased Considerably 0 0.0 Total 11 100.0
47. Over the past three months, how have initial margin requirements set by your institution with respect to OTC commodity derivatives changed?
- Initial margin requirements for average clients
Number of Respondents Percentage Increased Considerably 0 0.0 Increased Somewhat 0 0.0 Remained Basically Unchanged 13 100.0 Decreased Somewhat 0 0.0 Decreased Considerably 0 0.0 Total 13 100.0 - Initial margin requirements for most favored clients, as a consequence of breadth, duration, and/or extent of relationship
Number of Respondents Percentage Increased Considerably 0 0.0 Increased Somewhat 0 0.0 Remained Basically Unchanged 13 100.0 Decreased Somewhat 0 0.0 Decreased Considerably 0 0.0 Total 13 100.0
48. Over the past three months, how have initial margin requirements set by your institution with respect to TRS referencing non-securities (such as bank loans, including, for example, commercial and industrial loans and mortgage whole loans) changed?
- Initial margin requirements for average clients
Number of Respondents Percentage Increased Considerably 0 0.0 Increased Somewhat 0 0.0 Remained Basically Unchanged 14 100.0 Decreased Somewhat 0 0.0 Decreased Considerably 0 0.0 Total 14 100.0 - Initial margin requirements for most favored clients, as a consequence of breadth, duration, and/or extent of relationship
Number of Respondents Percentage Increased Considerably 0 0.0 Increased Somewhat 0 0.0 Remained Basically Unchanged 14 100.0 Decreased Somewhat 0 0.0 Decreased Considerably 0 0.0 Total 14 100.0
Nonstandard Collateral
49. Over the past three months, how has the posting of nonstandard collateral (that is, other than cash and U.S. Treasury securities) as permitted under relevant agreements changed?
| Number of Respondents | Percentage | |
|---|---|---|
| Increased Considerably | 0 | 0.0 |
| Increased Somewhat | 2 | 10.5 |
| Remained Basically Unchanged | 17 | 89.5 |
| Decreased Somewhat | 0 | 0.0 |
| Decreased Considerably | 0 | 0.0 |
| Total | 19 | 100.0 |
Mark and Collateral Disputes
50. Over the past three months, how has the volume of mark and collateral disputes relating to contracts of each of the following types changed?
- FX
Number of Respondents Percentage Increased Considerably 1 7.1 Increased Somewhat 0 0.0 Remained Basically Unchanged 12 85.7 Decreased Somewhat 1 7.1 Decreased Considerably 0 0.0 Total 14 100.0 - Interest rate
Number of Respondents Percentage Increased Considerably 0 0.0 Increased Somewhat 0 0.0 Remained Basically Unchanged 14 93.3 Decreased Somewhat 1 6.7 Decreased Considerably 0 0.0 Total 15 100.0 - Equity
Number of Respondents Percentage Increased Considerably 1 7.1 Increased Somewhat 2 14.3 Remained Basically Unchanged 11 78.6 Decreased Somewhat 0 0.0 Decreased Considerably 0 0.0 Total 14 100.0 - Credit referencing corporates
Number of Respondents Percentage Increased Considerably 1 7.1 Increased Somewhat 0 0.0 Remained Basically Unchanged 12 85.7 Decreased Somewhat 1 7.1 Decreased Considerably 0 0.0 Total 14 100.0 - Credit referencing securitized products including MBS and ABS
Number of Respondents Percentage Increased Considerably 0 0.0 Increased Somewhat 0 0.0 Remained Basically Unchanged 11 91.7 Decreased Somewhat 0 0.0 Decreased Considerably 1 8.3 Total 12 100.0 - Commodity
Number of Respondents Percentage Increased Considerably 1 7.7 Increased Somewhat 0 0.0 Remained Basically Unchanged 12 92.3 Decreased Somewhat 0 0.0 Decreased Considerably 0 0.0 Total 13 100.0 - TRS referencing non-securities (such as bank loans, including, for example, commercial and industrial loans and mortgage whole loans)
Number of Respondents Percentage Increased Considerably 0 0.0 Increased Somewhat 0 0.0 Remained Basically Unchanged 11 100.0 Decreased Somewhat 0 0.0 Decreased Considerably 0 0.0 Total 11 100.0
51. Over the past three months, how has the duration and persistence of mark and collateral disputes relating to contracts of each of the following types changed?
- FX
Number of Respondents Percentage Increased Considerably 1 7.1 Increased Somewhat 0 0.0 Remained Basically Unchanged 13 92.9 Decreased Somewhat 0 0.0 Decreased Considerably 0 0.0 Total 14 100.0 - Interest rate
Number of Respondents Percentage Increased Considerably 0 0.0 Increased Somewhat 1 6.7 Remained Basically Unchanged 14 93.3 Decreased Somewhat 0 0.0 Decreased Considerably 0 0.0 Total 15 100.0 - Equity
Number of Respondents Percentage Increased Considerably 0 0.0 Increased Somewhat 1 7.1 Remained Basically Unchanged 11 78.6 Decreased Somewhat 2 14.3 Decreased Considerably 0 0.0 Total 14 100.0 - Credit referencing corporates
Number of Respondents Percentage Increased Considerably 0 0.0 Increased Somewhat 0 0.0 Remained Basically Unchanged 13 92.9 Decreased Somewhat 0 0.0 Decreased Considerably 1 7.1 Total 14 100.0 - Credit referencing securitized products including MBS and ABS
Number of Respondents Percentage Increased Considerably 0 0.0 Increased Somewhat 0 0.0 Remained Basically Unchanged 12 100.0 Decreased Somewhat 0 0.0 Decreased Considerably 0 0.0 Total 12 100.0 - Commodity
Number of Respondents Percentage Increased Considerably 1 7.7 Increased Somewhat 0 0.0 Remained Basically Unchanged 12 92.3 Decreased Somewhat 0 0.0 Decreased Considerably 0 0.0 Total 13 100.0 - TRS referencing non-securities (such as bank loans, including, for example, commercial and industrial loans and mortgage whole loans)
Number of Respondents Percentage Increased Considerably 0 0.0 Increased Somewhat 0 0.0 Remained Basically Unchanged 11 100.0 Decreased Somewhat 0 0.0 Decreased Considerably 0 0.0 Total 11 100.0
Securities Financing
Questions 52 through 79 ask about securities funding at your institution--that is, lending to clients collateralized by securities. Such activities may be conducted on a "repo" desk, on a trading desk engaged in facilitation for institutional clients and/or proprietary transactions, on a funding desk, or on a prime brokerage platform. Questions 52 through 55 focus on lending against high-grade corporate bonds; questions 56 through 59 on lending against high-yield corporate bonds; questions 60 and 61 on lending against equities (including through stock loan); questions 62 through 65 on lending against agency residential mortgage-backed securities (agency RMBS); questions 66 through 69 on lending against non-agency residential mortgage-backed securities (non-agency RMBS); questions 70 through 73 on lending against commercial mortgage-backed securities (CMBS); and questions 74 through 77 on consumer ABS (for example, backed by credit card receivables or auto loans). Questions 78 and 79 ask about mark and collateral disputes for lending backed by each of the aforementioned contract types.
If your institution’s terms have tightened or eased over the past three months, please so report them regardless of how they stand relative to longer-term norms. Please focus your response on dollar-denominated instruments; if material differences exist with respect to instruments denominated in other currencies, please explain in the appropriate comment space.
High-Grade Corporate Bonds
52. Over the past three months, how have the terms under which high-grade corporate bonds are funded changed?
- Terms for average clients
- Maximum amount of funding
Number of Respondents Percentage Tightened Considerably 0 0.0 Tightened Somewhat 2 11.8 Remained Basically Unchanged 14 82.4 Eased Somewhat 1 5.9 Eased Considerably 0 0.0 Total 17 100.0 - Maximum maturity
Number of Respondents Percentage Tightened Considerably 0 0.0 Tightened Somewhat 1 5.9 Remained Basically Unchanged 15 88.2 Eased Somewhat 1 5.9 Eased Considerably 0 0.0 Total 17 100.0 - Haircuts
Number of Respondents Percentage Tightened Considerably 0 0.0 Tightened Somewhat 1 5.9 Remained Basically Unchanged 15 88.2 Eased Somewhat 1 5.9 Eased Considerably 0 0.0 Total 17 100.0 - Collateral spreads over relevant benchmark (effective financing rates)
Number of Respondents Percentage Tightened Considerably 1 5.9 Tightened Somewhat 2 11.8 Remained Basically Unchanged 13 76.5 Eased Somewhat 1 5.9 Eased Considerably 0 0.0 Total 17 100.0 - Other (please specify)
Number of Respondents Percentage Tightened Considerably 0 0.0 Tightened Somewhat 1 33.3 Remained Basically Unchanged 2 66.7 Eased Somewhat 0 0.0 Eased Considerably 0 0.0 Total 3 100.0
- Maximum amount of funding
- Terms for most favored clients, as a consequence of breadth, duration and/or extent of relationship
- Maximum amount of funding
Number of Respondents Percentage Tightened Considerably 1 5.9 Tightened Somewhat 1 5.9 Remained Basically Unchanged 14 82.4 Eased Somewhat 1 5.9 Eased Considerably 0 0.0 Total 17 100.0 - Maximum maturity
Number of Respondents Percentage Tightened Considerably 0 0.0 Tightened Somewhat 1 5.9 Remained Basically Unchanged 15 88.2 Eased Somewhat 1 5.9 Eased Considerably 0 0.0 Total 17 100.0 - Haircuts
Number of Respondents Percentage Tightened Considerably 0 0.0 Tightened Somewhat 1 5.9 Remained Basically Unchanged 14 82.4 Eased Somewhat 2 11.8 Eased Considerably 0 0.0 Total 17 100.0 - Collateral spreads over relevant benchmark (effective financing rates)
Number of Respondents Percentage Tightened Considerably 0 0.0 Tightened Somewhat 2 11.8 Remained Basically Unchanged 14 82.4 Eased Somewhat 1 5.9 Eased Considerably 0 0.0 Total 17 100.0 - Other (please specify)
Number of Respondents Percentage Tightened Considerably 0 0.0 Tightened Somewhat 1 33.3 Remained Basically Unchanged 2 66.7 Eased Somewhat 0 0.0 Eased Considerably 0 0.0 Total 3 100.0
- Maximum amount of funding
53. Over the past three months, how has demand for funding of high-grade corporate bonds by your institution's clients changed?
| Number of Respondents | Percentage | |
|---|---|---|
| Increased Considerably | 1 | 5.9 |
| Increased Somewhat | 2 | 11.8 |
| Remained Basically Unchanged | 14 | 82.4 |
| Decreased Somewhat | 0 | 0.0 |
| Decreased Considerably | 0 | 0.0 |
| Total | 17 | 100.0 |
54. Over the past three months, how has demand for term funding with a maturity greater than 30 days of high-grade corporate bonds by your institution's clients changed?
| Number of Respondents | Percentage | |
|---|---|---|
| Increased Considerably | 0 | 0.0 |
| Increased Somewhat | 3 | 17.6 |
| Remained Basically Unchanged | 14 | 82.4 |
| Decreased Somewhat | 0 | 0.0 |
| Decreased Considerably | 0 | 0.0 |
| Total | 17 | 100.0 |
55. Over the past three months, how have liquidity and functioning in the high-grade corporate bond market changed?
| Number of Respondents | Percentage | |
|---|---|---|
| Improved Considerably | 0 | 0.0 |
| Improved Somewhat | 4 | 23.5 |
| Remained Basically Unchanged | 13 | 76.5 |
| Deteriorated Somewhat | 0 | 0.0 |
| Deteriorated Considerably | 0 | 0.0 |
| Total | 17 | 100.0 |
Funding of High-Yield Corporate Bonds
56. Over the past three months, how have the terms under which high-yield corporate bonds are funded changed?
- Terms for average clients
- Maximum amount of funding
Number of Respondents Percentage Tightened Considerably 0 0.0 Tightened Somewhat 2 11.8 Remained Basically Unchanged 14 82.4 Eased Somewhat 1 5.9 Eased Considerably 0 0.0 Total 17 100.0 - Maximum maturity
Number of Respondents Percentage Tightened Considerably 0 0.0 Tightened Somewhat 2 11.8 Remained Basically Unchanged 14 82.4 Eased Somewhat 1 5.9 Eased Considerably 0 0.0 Total 17 100.0 - Haircuts
Number of Respondents Percentage Tightened Considerably 0 0.0 Tightened Somewhat 3 17.6 Remained Basically Unchanged 13 76.5 Eased Somewhat 1 5.9 Eased Considerably 0 0.0 Total 17 100.0 - Collateral spreads over relevant benchmark (effective financing rates)
Number of Respondents Percentage Tightened Considerably 0 0.0 Tightened Somewhat 3 17.6 Remained Basically Unchanged 13 76.5 Eased Somewhat 1 5.9 Eased Considerably 0 0.0 Total 17 100.0 - Other (please specify)
Number of Respondents Percentage Tightened Considerably 0 0.0 Tightened Somewhat 1 33.3 Remained Basically Unchanged 2 66.7 Eased Somewhat 0 0.0 Eased Considerably 0 0.0 Total 3 100.0
- Maximum amount of funding
- Terms for most favored clients, as a consequence of breadth, duration and/or extent of relationship
- Maximum amount of funding
Number of Respondents Percentage Tightened Considerably 0 0.0 Tightened Somewhat 2 11.8 Remained Basically Unchanged 14 82.4 Eased Somewhat 1 5.9 Eased Considerably 0 0.0 Total 17 100.0 - Maximum maturity
Number of Respondents Percentage Tightened Considerably 0 0.0 Tightened Somewhat 1 5.9 Remained Basically Unchanged 15 88.2 Eased Somewhat 1 5.9 Eased Considerably 0 0.0 Total 17 100.0 - Haircuts
Number of Respondents Percentage Tightened Considerably 0 0.0 Tightened Somewhat 2 11.8 Remained Basically Unchanged 14 82.4 Eased Somewhat 1 5.9 Eased Considerably 0 0.0 Total 17 100.0 - Collateral spreads over relevant benchmark (effective financing rates)
Number of Respondents Percentage Tightened Considerably 0 0.0 Tightened Somewhat 3 17.6 Remained Basically Unchanged 13 76.5 Eased Somewhat 1 5.9 Eased Considerably 0 0.0 Total 17 100.0 - Other (please specify)
Number of Respondents Percentage Tightened Considerably 0 0.0 Tightened Somewhat 1 33.3 Remained Basically Unchanged 2 66.7 Eased Somewhat 0 0.0 Eased Considerably 0 0.0 Total 3 100.0
- Maximum amount of funding
57. Over the past three months, how has demand for funding of high-yield corporate bonds by your institution's clients changed?
| Number of Respondents | Percentage | |
|---|---|---|
| Increased Considerably | 1 | 5.9 |
| Increased Somewhat | 2 | 11.8 |
| Remained Basically Unchanged | 14 | 82.4 |
| Decreased Somewhat | 0 | 0.0 |
| Decreased Considerably | 0 | 0.0 |
| Total | 17 | 100.0 |
58. Over the past three months, how has demand for term funding with a maturity greater than 30 days of high-yield corporate bonds by your institution's clients changed?
| Number of Respondents | Percentage | |
|---|---|---|
| Increased Considerably | 0 | 0.0 |
| Increased Somewhat | 3 | 17.6 |
| Remained Basically Unchanged | 14 | 82.4 |
| Decreased Somewhat | 0 | 0.0 |
| Decreased Considerably | 0 | 0.0 |
| Total | 17 | 100.0 |
59. Over the past three months, how have liquidity and functioning in the high-yield corporate bond market changed?
| Number of Respondents | Percentage | |
|---|---|---|
| Improved Considerably | 0 | 0.0 |
| Improved Somewhat | 3 | 17.6 |
| Remained Basically Unchanged | 13 | 76.5 |
| Deteriorated Somewhat | 1 | 5.9 |
| Deteriorated Considerably | 0 | 0.0 |
| Total | 17 | 100.0 |
Equities (Including through Stock Loan)
60. Over the past three months, how have the terms under which equities are funded (including through stock loan) changed?
- Terms for average clients
- Maximum amount of funding
Number of Respondents Percentage Tightened Considerably 0 0.0 Tightened Somewhat 0 0.0 Remained Basically Unchanged 16 94.1 Eased Somewhat 1 5.9 Eased Considerably 0 0.0 Total 17 100.0 - Maximum maturity
Number of Respondents Percentage Tightened Considerably 0 0.0 Tightened Somewhat 0 0.0 Remained Basically Unchanged 17 100.0 Eased Somewhat 0 0.0 Eased Considerably 0 0.0 Total 17 100.0 - Haircuts
Number of Respondents Percentage Tightened Considerably 0 0.0 Tightened Somewhat 0 0.0 Remained Basically Unchanged 17 100.0 Eased Somewhat 0 0.0 Eased Considerably 0 0.0 Total 17 100.0 - Collateral spreads over relevant benchmark (effective financing rates)
Number of Respondents Percentage Tightened Considerably 0 0.0 Tightened Somewhat 2 11.8 Remained Basically Unchanged 14 82.4 Eased Somewhat 1 5.9 Eased Considerably 0 0.0 Total 17 100.0 - Other (please specify)
Number of Respondents Percentage Tightened Considerably 0 0.0 Tightened Somewhat 0 0.0 Remained Basically Unchanged 1 100.0 Eased Somewhat 0 0.0 Eased Considerably 0 0.0 Total 1 100.0
- Maximum amount of funding
- Terms for most favored clients, as a consequence of breadth, duration and/or extent of relationship
- Maximum amount of funding
Number of Respondents Percentage Tightened Considerably 0 0.0 Tightened Somewhat 0 0.0 Remained Basically Unchanged 17 100.0 Eased Somewhat 0 0.0 Eased Considerably 0 0.0 Total 17 100.0 - Maximum maturity
Number of Respondents Percentage Tightened Considerably 0 0.0 Tightened Somewhat 0 0.0 Remained Basically Unchanged 17 100.0 Eased Somewhat 0 0.0 Eased Considerably 0 0.0 Total 17 100.0 - Haircuts
Number of Respondents Percentage Tightened Considerably 0 0.0 Tightened Somewhat 0 0.0 Remained Basically Unchanged 17 100.0 Eased Somewhat 0 0.0 Eased Considerably 0 0.0 Total 17 100.0 - Collateral spreads over relevant benchmark (effective financing rates)
Number of Respondents Percentage Tightened Considerably 0 0.0 Tightened Somewhat 1 5.9 Remained Basically Unchanged 15 88.2 Eased Somewhat 1 5.9 Eased Considerably 0 0.0 Total 17 100.0 - Other (please specify)
Number of Respondents Percentage Tightened Considerably 0 0.0 Tightened Somewhat 0 0.0 Remained Basically Unchanged 1 100.0 Eased Somewhat 0 0.0 Eased Considerably 0 0.0 Total 1 100.0
- Maximum amount of funding
61. Over the past three months, how has demand for funding of equities (including through stock loan) by your institution's clients changed?
| Number of Respondents | Percentage | |
|---|---|---|
| Increased Considerably | 1 | 5.9 |
| Increased Somewhat | 5 | 29.4 |
| Remained Basically Unchanged | 11 | 64.7 |
| Decreased Somewhat | 0 | 0.0 |
| Decreased Considerably | 0 | 0.0 |
| Total | 17 | 100.0 |
Agency Residential Mortgage-Backed Securities
62. Over the past three months, how have the terms under which agency RMBS are funded changed?
- Terms for average clients
- Maximum amount of funding
Number of Respondents Percentage Tightened Considerably 0 0.0 Tightened Somewhat 2 11.1 Remained Basically Unchanged 16 88.9 Eased Somewhat 0 0.0 Eased Considerably 0 0.0 Total 18 100.0 - Maximum maturity
Number of Respondents Percentage Tightened Considerably 0 0.0 Tightened Somewhat 1 5.6 Remained Basically Unchanged 17 94.4 Eased Somewhat 0 0.0 Eased Considerably 0 0.0 Total 18 100.0 - Haircuts
Number of Respondents Percentage Tightened Considerably 0 0.0 Tightened Somewhat 0 0.0 Remained Basically Unchanged 18 100.0 Eased Somewhat 0 0.0 Eased Considerably 0 0.0 Total 18 100.0 - Collateral spreads over relevant benchmark (effective financing rates)
Number of Respondents Percentage Tightened Considerably 0 0.0 Tightened Somewhat 2 11.1 Remained Basically Unchanged 15 83.3 Eased Somewhat 1 5.6 Eased Considerably 0 0.0 Total 18 100.0 - Other (please specify)
Number of Respondents Percentage Tightened Considerably 0 0.0 Tightened Somewhat 0 0.0 Remained Basically Unchanged 2 100.0 Eased Somewhat 0 0.0 Eased Considerably 0 0.0 Total 2 100.0
- Maximum amount of funding
- Terms for most favored clients, as a consequence of breadth, duration and/or extent of relationship
- Maximum amount of funding
Number of Respondents Percentage Tightened Considerably 0 0.0 Tightened Somewhat 1 5.6 Remained Basically Unchanged 17 94.4 Eased Somewhat 0 0.0 Eased Considerably 0 0.0 Total 18 100.0 - Maximum maturity
Number of Respondents Percentage Tightened Considerably 0 0.0 Tightened Somewhat 1 5.6 Remained Basically Unchanged 17 94.4 Eased Somewhat 0 0.0 Eased Considerably 0 0.0 Total 18 100.0 - Haircuts
Number of Respondents Percentage Tightened Considerably 0 0.0 Tightened Somewhat 0 0.0 Remained Basically Unchanged 18 100.0 Eased Somewhat 0 0.0 Eased Considerably 0 0.0 Total 18 100.0 - Collateral spreads over relevant benchmark (effective financing rates)
Number of Respondents Percentage Tightened Considerably 0 0.0 Tightened Somewhat 2 11.1 Remained Basically Unchanged 15 83.3 Eased Somewhat 1 5.6 Eased Considerably 0 0.0 Total 18 100.0 - Other (please specify)
Number of Respondents Percentage Tightened Considerably 0 0.0 Tightened Somewhat 0 0.0 Remained Basically Unchanged 2 100.0 Eased Somewhat 0 0.0 Eased Considerably 0 0.0 Total 2 100.0
- Maximum amount of funding
63. Over the past three months, how has demand for funding of agency RMBS by your institution's clients changed?
| Number of Respondents | Percentage | |
|---|---|---|
| Increased Considerably | 1 | 5.6 |
| Increased Somewhat | 1 | 5.6 |
| Remained Basically Unchanged | 16 | 88.9 |
| Decreased Somewhat | 0 | 0.0 |
| Decreased Considerably | 0 | 0.0 |
| Total | 18 | 100.0 |
64. Over the past three months, how has demand for term funding with a maturity greater than 30 days of agency RMBS by your institution's clients changed?
| Number of Respondents | Percentage | |
|---|---|---|
| Increased Considerably | 0 | 0.0 |
| Increased Somewhat | 2 | 11.1 |
| Remained Basically Unchanged | 16 | 88.9 |
| Decreased Somewhat | 0 | 0.0 |
| Decreased Considerably | 0 | 0.0 |
| Total | 18 | 100.0 |
65. Over the past three months, how have liquidity and functioning in the agency RMBS market changed?
| Number of Respondents | Percentage | |
|---|---|---|
| Improved Considerably | 0 | 0.0 |
| Improved Somewhat | 1 | 5.6 |
| Remained Basically Unchanged | 16 | 88.9 |
| Deteriorated Somewhat | 1 | 5.6 |
| Deteriorated Considerably | 0 | 0.0 |
| Total | 18 | 100.0 |
Non-agency Residential Mortgage-Backed Securities
66. Over the past three months, how have the terms under which non-agency RMBS are funded changed?
- Terms for average clients
- Maximum amount of funding
Number of Respondents Percentage Tightened Considerably 0 0.0 Tightened Somewhat 1 6.7 Remained Basically Unchanged 14 93.3 Eased Somewhat 0 0.0 Eased Considerably 0 0.0 Total 15 100.0 - Maximum maturity
Number of Respondents Percentage Tightened Considerably 0 0.0 Tightened Somewhat 1 6.7 Remained Basically Unchanged 14 93.3 Eased Somewhat 0 0.0 Eased Considerably 0 0.0 Total 15 100.0 - Haircuts
Number of Respondents Percentage Tightened Considerably 0 0.0 Tightened Somewhat 0 0.0 Remained Basically Unchanged 13 86.7 Eased Somewhat 2 13.3 Eased Considerably 0 0.0 Total 15 100.0 - Collateral spreads over relevant benchmark (effective financing rates)
Number of Respondents Percentage Tightened Considerably 0 0.0 Tightened Somewhat 1 6.7 Remained Basically Unchanged 13 86.7 Eased Somewhat 1 6.7 Eased Considerably 0 0.0 Total 15 100.0 - Other (please specify)
Number of Respondents Percentage Tightened Considerably 0 0.0 Tightened Somewhat 0 0.0 Remained Basically Unchanged 2 100.0 Eased Somewhat 0 0.0 Eased Considerably 0 0.0 Total 2 100.0
- Maximum amount of funding
- Terms for most favored clients, as a consequence of breadth, duration and/or extent of relationship
- Maximum amount of funding
Number of Respondents Percentage Tightened Considerably 0 0.0 Tightened Somewhat 0 0.0 Remained Basically Unchanged 15 100.0 Eased Somewhat 0 0.0 Eased Considerably 0 0.0 Total 15 100.0 - Maximum maturity
Number of Respondents Percentage Tightened Considerably 0 0.0 Tightened Somewhat 0 0.0 Remained Basically Unchanged 15 100.0 Eased Somewhat 0 0.0 Eased Considerably 0 0.0 Total 15 100.0 - Haircuts
Number of Respondents Percentage Tightened Considerably 0 0.0 Tightened Somewhat 0 0.0 Remained Basically Unchanged 14 93.3 Eased Somewhat 1 6.7 Eased Considerably 0 0.0 Total 15 100.0 - Collateral spreads over relevant benchmark (effective financing rates)
Number of Respondents Percentage Tightened Considerably 0 0.0 Tightened Somewhat 0 0.0 Remained Basically Unchanged 14 93.3 Eased Somewhat 1 6.7 Eased Considerably 0 0.0 Total 15 100.0 - Other (please specify)
Number of Respondents Percentage Tightened Considerably 0 0.0 Tightened Somewhat 0 0.0 Remained Basically Unchanged 1 100.0 Eased Somewhat 0 0.0 Eased Considerably 0 0.0 Total 1 100.0
- Maximum amount of funding
67. Over the past three months, how has demand for funding of non-agency RMBS by your institution's clients changed?
| Number of Respondents | Percentage | |
|---|---|---|
| Increased Considerably | 0 | 0.0 |
| Increased Somewhat | 1 | 6.7 |
| Remained Basically Unchanged | 14 | 93.3 |
| Decreased Somewhat | 0 | 0.0 |
| Decreased Considerably | 0 | 0.0 |
| Total | 15 | 100.0 |
68. Over the past three months, how has demand for term funding with a maturity greater than 30 days of non-agency RMBS by your institution's clients changed?
| Number of Respondents | Percentage | |
|---|---|---|
| Increased Considerably | 0 | 0.0 |
| Increased Somewhat | 1 | 6.7 |
| Remained Basically Unchanged | 14 | 93.3 |
| Decreased Somewhat | 0 | 0.0 |
| Decreased Considerably | 0 | 0.0 |
| Total | 15 | 100.0 |
69. Over the past three months, how have liquidity and functioning in the non-agency RMBS market changed?
| Number of Respondents | Percentage | |
|---|---|---|
| Improved Considerably | 0 | 0.0 |
| Improved Somewhat | 1 | 6.7 |
| Remained Basically Unchanged | 14 | 93.3 |
| Deteriorated Somewhat | 0 | 0.0 |
| Deteriorated Considerably | 0 | 0.0 |
| Total | 15 | 100.0 |
Commercial Mortgage-Backed Securities
70. Over the past three months, how have the terms under which CMBS are funded changed?
- Terms for average clients
- Maximum amount of funding
Number of Respondents Percentage Tightened Considerably 1 6.7 Tightened Somewhat 1 6.7 Remained Basically Unchanged 13 86.7 Eased Somewhat 0 0.0 Eased Considerably 0 0.0 Total 15 100.0 - Maximum maturity
Number of Respondents Percentage Tightened Considerably 0 0.0 Tightened Somewhat 1 6.7 Remained Basically Unchanged 14 93.3 Eased Somewhat 0 0.0 Eased Considerably 0 0.0 Total 15 100.0 - Haircuts
Number of Respondents Percentage Tightened Considerably 0 0.0 Tightened Somewhat 0 0.0 Remained Basically Unchanged 14 93.3 Eased Somewhat 1 6.7 Eased Considerably 0 0.0 Total 15 100.0 - Collateral spreads over relevant benchmark (effective financing rates)
Number of Respondents Percentage Tightened Considerably 0 0.0 Tightened Somewhat 1 6.7 Remained Basically Unchanged 13 86.7 Eased Somewhat 1 6.7 Eased Considerably 0 0.0 Total 15 100.0 - Other (please specify)
Number of Respondents Percentage Tightened Considerably 0 0.0 Tightened Somewhat 0 0.0 Remained Basically Unchanged 0 0.0 Eased Somewhat 0 0.0 Eased Considerably 0 0.0 Total 0 0.0
- Maximum amount of funding
- Terms for most favored clients, as a consequence of breadth, duration and/or extent of relationship
- Maximum amount of funding
Number of Respondents Percentage Tightened Considerably 0 0.0 Tightened Somewhat 2 13.3 Remained Basically Unchanged 13 86.7 Eased Somewhat 0 0.0 Eased Considerably 0 0.0 Total 15 100.0 - Maximum maturity
Number of Respondents Percentage Tightened Considerably 0 0.0 Tightened Somewhat 1 6.7 Remained Basically Unchanged 14 93.3 Eased Somewhat 0 0.0 Eased Considerably 0 0.0 Total 15 100.0 - Haircuts
Number of Respondents Percentage Tightened Considerably 0 0.0 Tightened Somewhat 0 0.0 Remained Basically Unchanged 14 93.3 Eased Somewhat 1 6.7 Eased Considerably 0 0.0 Total 15 100.0 - Collateral spreads over relevant benchmark (effective financing rates)
Number of Respondents Percentage Tightened Considerably 1 6.7 Tightened Somewhat 1 6.7 Remained Basically Unchanged 12 80.0 Eased Somewhat 1 6.7 Eased Considerably 0 0.0 Total 15 100.0 - Other (please specify)
Number of Respondents Percentage Tightened Considerably 0 0.0 Tightened Somewhat 0 0.0 Remained Basically Unchanged 0 0.0 Eased Somewhat 0 0.0 Eased Considerably 0 0.0 Total 0 0.0
- Maximum amount of funding
71. Over the past three months, how has demand for funding of CMBS by your institution's clients changed?
| Number of Respondents | Percentage | |
|---|---|---|
| Increased Considerably | 0 | 0.0 |
| Increased Somewhat | 2 | 13.3 |
| Remained Basically Unchanged | 13 | 86.7 |
| Decreased Somewhat | 0 | 0.0 |
| Decreased Considerably | 0 | 0.0 |
| Total | 15 | 100.0 |
72. Over the past three months, how has demand for term funding with a maturity greater than 30 days of CMBS by your institution's clients changed?
| Number of Respondents | Percentage | |
|---|---|---|
| Increased Considerably | 0 | 0.0 |
| Increased Somewhat | 3 | 20.0 |
| Remained Basically Unchanged | 12 | 80.0 |
| Decreased Somewhat | 0 | 0.0 |
| Decreased Considerably | 0 | 0.0 |
| Total | 15 | 100.0 |
73. Over the past three months, how have liquidity and functioning in the CMBS market changed?
| Number of Respondents | Percentage | |
|---|---|---|
| Improved Considerably | 0 | 0.0 |
| Improved Somewhat | 2 | 13.3 |
| Remained Basically Unchanged | 13 | 86.7 |
| Deteriorated Somewhat | 0 | 0.0 |
| Deteriorated Considerably | 0 | 0.0 |
| Total | 15 | 100.0 |
Consumer Asset-Backed Securities
74. Over the past three months, how have the terms under which consumer ABS (for example, backed by credit card receivables or auto loans) are funded changed?
- Terms for average clients
- Maximum amount of funding
Number of Respondents Percentage Tightened Considerably 0 0.0 Tightened Somewhat 2 15.4 Remained Basically Unchanged 11 84.6 Eased Somewhat 0 0.0 Eased Considerably 0 0.0 Total 13 100.0 - Maximum maturity
Number of Respondents Percentage Tightened Considerably 0 0.0 Tightened Somewhat 2 15.4 Remained Basically Unchanged 11 84.6 Eased Somewhat 0 0.0 Eased Considerably 0 0.0 Total 13 100.0 - Haircuts
Number of Respondents Percentage Tightened Considerably 0 0.0 Tightened Somewhat 1 7.7 Remained Basically Unchanged 11 84.6 Eased Somewhat 1 7.7 Eased Considerably 0 0.0 Total 13 100.0 - Collateral spreads over relevant benchmark (effective financing rates)
Number of Respondents Percentage Tightened Considerably 0 0.0 Tightened Somewhat 2 15.4 Remained Basically Unchanged 10 76.9 Eased Somewhat 1 7.7 Eased Considerably 0 0.0 Total 13 100.0 - Other (please specify)
Number of Respondents Percentage Tightened Considerably 0 0.0 Tightened Somewhat 0 0.0 Remained Basically Unchanged 0 0.0 Eased Somewhat 0 0.0 Eased Considerably 0 0.0 Total 0 0.0
- Maximum amount of funding
- Terms for most favored clients, as a consequence of breadth, duration and/or extent of relationship
- Maximum amount of funding
Number of Respondents Percentage Tightened Considerably 0 0.0 Tightened Somewhat 2 15.4 Remained Basically Unchanged 10 76.9 Eased Somewhat 1 7.7 Eased Considerably 0 0.0 Total 13 100.0 - Maximum maturity
Number of Respondents Percentage Tightened Considerably 0 0.0 Tightened Somewhat 2 15.4 Remained Basically Unchanged 11 84.6 Eased Somewhat 0 0.0 Eased Considerably 0 0.0 Total 13 100.0 - Haircuts
Number of Respondents Percentage Tightened Considerably 0 0.0 Tightened Somewhat 2 15.4 Remained Basically Unchanged 10 76.9 Eased Somewhat 1 7.7 Eased Considerably 0 0.0 Total 13 100.0 - Collateral spreads over relevant benchmark (effective financing rates)
Number of Respondents Percentage Tightened Considerably 1 7.7 Tightened Somewhat 2 15.4 Remained Basically Unchanged 9 69.2 Eased Somewhat 1 7.7 Eased Considerably 0 0.0 Total 13 100.0 - Other (please specify)
Number of Respondents Percentage Tightened Considerably 0 0.0 Tightened Somewhat 0 0.0 Remained Basically Unchanged 0 0.0 Eased Somewhat 0 0.0 Eased Considerably 0 0.0 Total 0 0.0
- Maximum amount of funding
75. Over the past three months, how has demand for funding of consumer ABS by your institution's clients changed?
| Number of Respondents | Percentage | |
|---|---|---|
| Increased Considerably | 0 | 0.0 |
| Increased Somewhat | 2 | 15.4 |
| Remained Basically Unchanged | 11 | 84.6 |
| Decreased Somewhat | 0 | 0.0 |
| Decreased Considerably | 0 | 0.0 |
| Total | 13 | 100.0 |
76. Over the past three months, how has demand for term funding with a maturity greater than 30 days of consumer ABS by your institution's clients changed?
| Number of Respondents | Percentage | |
|---|---|---|
| Increased Considerably | 0 | 0.0 |
| Increased Somewhat | 2 | 15.4 |
| Remained Basically Unchanged | 11 | 84.6 |
| Decreased Somewhat | 0 | 0.0 |
| Decreased Considerably | 0 | 0.0 |
| Total | 13 | 100.0 |
77. Over the past three months, how have liquidity and functioning in the consumer ABS market changed?
| Number of Respondents | Percentage | |
|---|---|---|
| Improved Considerably | 0 | 0.0 |
| Improved Somewhat | 1 | 7.7 |
| Remained Basically Unchanged | 11 | 84.6 |
| Deteriorated Somewhat | 1 | 7.7 |
| Deteriorated Considerably | 0 | 0.0 |
| Total | 13 | 100.0 |
Mark and Collateral Disputes
78. Over the past three months, how has the volume of mark and collateral disputes relating to lending against each of the following collateral types changed?
- High-grade corporate bonds
Number of Respondents Percentage Increased Considerably 0 0.0 Increased Somewhat 0 0.0 Remained Basically Unchanged 17 100.0 Decreased Somewhat 0 0.0 Decreased Considerably 0 0.0 Total 17 100.0 - High-yield corporate bonds
Number of Respondents Percentage Increased Considerably 0 0.0 Increased Somewhat 0 0.0 Remained Basically Unchanged 17 100.0 Decreased Somewhat 0 0.0 Decreased Considerably 0 0.0 Total 17 100.0 - Equities
Number of Respondents Percentage Increased Considerably 0 0.0 Increased Somewhat 0 0.0 Remained Basically Unchanged 17 100.0 Decreased Somewhat 0 0.0 Decreased Considerably 0 0.0 Total 17 100.0 - Agency RMBS
Number of Respondents Percentage Increased Considerably 0 0.0 Increased Somewhat 0 0.0 Remained Basically Unchanged 18 100.0 Decreased Somewhat 0 0.0 Decreased Considerably 0 0.0 Total 18 100.0 - Non-agency RMBS
Number of Respondents Percentage Increased Considerably 0 0.0 Increased Somewhat 0 0.0 Remained Basically Unchanged 15 100.0 Decreased Somewhat 0 0.0 Decreased Considerably 0 0.0 Total 15 100.0 - CMBS
Number of Respondents Percentage Increased Considerably 0 0.0 Increased Somewhat 0 0.0 Remained Basically Unchanged 15 100.0 Decreased Somewhat 0 0.0 Decreased Considerably 0 0.0 Total 15 100.0 - Consumer ABS
Number of Respondents Percentage Increased Considerably 0 0.0 Increased Somewhat 0 0.0 Remained Basically Unchanged 13 100.0 Decreased Somewhat 0 0.0 Decreased Considerably 0 0.0 Total 13 100.0
79. Over the past three months, how has the duration and persistence of mark and collateral disputes relating to lending against each of the following collateral types changed?
- High-grade corporate bonds
Number of Respondents Percentage Increased Considerably 0 0.0 Increased Somewhat 0 0.0 Remained Basically Unchanged 17 100.0 Decreased Somewhat 0 0.0 Decreased Considerably 0 0.0 Total 17 100.0 - High-yield corporate bonds
Number of Respondents Percentage Increased Considerably 0 0.0 Increased Somewhat 0 0.0 Remained Basically Unchanged 17 100.0 Decreased Somewhat 0 0.0 Decreased Considerably 0 0.0 Total 17 100.0 - Equities
Number of Respondents Percentage Increased Considerably 0 0.0 Increased Somewhat 0 0.0 Remained Basically Unchanged 17 100.0 Decreased Somewhat 0 0.0 Decreased Considerably 0 0.0 Total 17 100.0 - Agency RMBS
Number of Respondents Percentage Increased Considerably 0 0.0 Increased Somewhat 0 0.0 Remained Basically Unchanged 18 100.0 Decreased Somewhat 0 0.0 Decreased Considerably 0 0.0 Total 18 100.0 - Non-agency RMBS
Number of Respondents Percentage Increased Considerably 0 0.0 Increased Somewhat 0 0.0 Remained Basically Unchanged 15 100.0 Decreased Somewhat 0 0.0 Decreased Considerably 0 0.0 Total 15 100.0 - CMBS
Number of Respondents Percentage Increased Considerably 0 0.0 Increased Somewhat 0 0.0 Remained Basically Unchanged 15 100.0 Decreased Somewhat 0 0.0 Decreased Considerably 0 0.0 Total 15 100.0 - Consumer ABS
Number of Respondents Percentage Increased Considerably 0 0.0 Increased Somewhat 0 0.0 Remained Basically Unchanged 13 100.0 Decreased Somewhat 0 0.0 Decreased Considerably 0 0.0 Total 13 100.0
Optional Question
Question 80 requests feedback on any other issues you judge to be important relating to credit terms applicable to securities financing transactions and OTC derivatives contracts.
80. Are there any other recent developments involving conditions and practices in any of the markets addressed in this survey or applicable to the counterparty types listed in this survey that you regard as particularly significant and which were not fully addressed in the prior questions?
| Number of Respondents | Percentage | |
|---|---|---|
| Free-Text Entry | 1 | 100.0 |
| Total | 1 | 100.0 |
Special Questions
Hedge fund equity exposures have reportedly increased significantly over the past two years. The following questions ask about your firm?s provision of equity financing (through margin loans and securities lending) and synthetic equity exposure (through total return swaps and other over-the-counter derivatives) to hedge fund clients.
Questions 1-2 ask how demand as well as terms for equity financing and synthetic equity exposure have evolved across hedge fund structures and strategies. Question 3 asks about changes in the balance between synthetic and traditional financing. Questions 4-5 ask how arrangements for artificial intelligence (AI)?related stocks differ from those for other equity sectors. Questions 6-8 ask about the practice of internalization, in which dealers settle customer positions internally with offsetting customer positions.
Equity Financing for Hedge Fund Clients
81. How has the demand for equity financing and synthetic equity exposure from hedge fund clients changed over the past two years?
- By fund structure:
- Single-manager
Number of Respondents Percentage Increased Significantly 2 11.1 Increased Somewhat 7 38.9 Remained Basically Unchanged 9 50.0 Decreased Somewhat 0 0.0 Decreased Significantly 0 0.0 Total 18 100.0 - Multi-manager
Number of Respondents Percentage Increased Significantly 4 22.2 Increased Somewhat 7 38.9 Remained Basically Unchanged 7 38.9 Decreased Somewhat 0 0.0 Decreased Significantly 0 0.0 Total 18 100.0
- Single-manager
- By strategy
- Fundamental equity
Number of Respondents Percentage Increased Significantly 2 11.1 Increased Somewhat 7 38.9 Remained Basically Unchanged 9 50.0 Decreased Somewhat 0 0.0 Decreased Significantly 0 0.0 Total 18 100.0 - Quantitative equity (including high frequency trading)
Number of Respondents Percentage Increased Significantly 3 16.7 Increased Somewhat 5 27.8 Remained Basically Unchanged 10 55.6 Decreased Somewhat 0 0.0 Decreased Significantly 0 0.0 Total 18 100.0 - Sector-focused / concentrated equity
Number of Respondents Percentage Increased Significantly 0 0.0 Increased Somewhat 4 22.2 Remained Basically Unchanged 14 77.8 Decreased Somewhat 0 0.0 Decreased Significantly 0 0.0 Total 18 100.0
- Fundamental equity
82. How have the terms offered on equity financing and synthetic equity exposure to hedge fund clients changed over the past two years?
- For price terms (for example, financing rates, fees)
- By fund structure
- Single-manager
Number of Respondents Percentage Tightened Considerably 0 0.0 Tightened Somewhat 2 11.1 Remained Basically Unchanged 15 83.3 Eased Somewhat 1 5.6 Eased Considerably 0 0.0 Total 18 100.0 - Multi-manager
Number of Respondents Percentage Tightened Considerably 0 0.0 Tightened Somewhat 2 11.1 Remained Basically Unchanged 15 83.3 Eased Somewhat 1 5.6 Eased Considerably 0 0.0 Total 18 100.0
- Single-manager
- By strategy
- Fundamental equity
Number of Respondents Percentage Tightened Considerably 0 0.0 Tightened Somewhat 0 0.0 Remained Basically Unchanged 16 88.9 Eased Somewhat 2 11.1 Eased Considerably 0 0.0 Total 18 100.0 - Quantitative equity (including high frequency trading)
Number of Respondents Percentage Tightened Considerably 0 0.0 Tightened Somewhat 3 16.7 Remained Basically Unchanged 14 77.8 Eased Somewhat 1 5.6 Eased Considerably 0 0.0 Total 18 100.0 - Sector-focused / concentrated equity
Number of Respondents Percentage Tightened Considerably 0 0.0 Tightened Somewhat 2 11.1 Remained Basically Unchanged 15 83.3 Eased Somewhat 1 5.6 Eased Considerably 0 0.0 Total 18 100.0
- Fundamental equity
- By fund structure
- For nonprice terms (for example, margin requirements, position limits)
- By fund structure
- Single-manager
Number of Respondents Percentage Tightened Considerably 0 0.0 Tightened Somewhat 2 11.1 Remained Basically Unchanged 15 83.3 Eased Somewhat 1 5.6 Eased Considerably 0 0.0 Total 18 100.0 - Multi-manager
Number of Respondents Percentage Tightened Considerably 0 0.0 Tightened Somewhat 2 11.1 Remained Basically Unchanged 15 83.3 Eased Somewhat 1 5.6 Eased Considerably 0 0.0 Total 18 100.0
- Single-manager
- By strategy
- Fundamental equity
Number of Respondents Percentage Tightened Considerably 0 0.0 Tightened Somewhat 2 11.1 Remained Basically Unchanged 16 88.9 Eased Somewhat 0 0.0 Eased Considerably 0 0.0 Total 18 100.0 - Quantitative equity (including high frequency trading)
Number of Respondents Percentage Tightened Considerably 0 0.0 Tightened Somewhat 2 11.1 Remained Basically Unchanged 15 83.3 Eased Somewhat 1 5.6 Eased Considerably 0 0.0 Total 18 100.0 - Sector-focused / concentrated equity
Number of Respondents Percentage Tightened Considerably 0 0.0 Tightened Somewhat 6 33.3 Remained Basically Unchanged 12 66.7 Eased Somewhat 0 0.0 Eased Considerably 0 0.0 Total 18 100.0
- Fundamental equity
- By fund structure
83A. Over the past two years, how has the notional amount of synthetic equity exposure you provide to hedge fund clients changed relative to the amount through traditional prime brokerage financing transactions?
| Number of Respondents | Percentage | |
|---|---|---|
| Increased significantly relative to traditional prime brokerage financing transactions | 0 | 0.0 |
| Increased somewhat relative to traditional prime brokerage financing transactions | 6 | 33.3 |
| No significant change relative to traditional prime brokerage financing transactions | 12 | 66.7 |
| Decreased somewhat relative to traditional prime brokerage financing transactions | 0 | 0.0 |
| Decreased significantly relative to traditional prime brokerage financing transactions | 0 | 0.0 |
| Total | 18 | 100.0 |
83B. To the degree that the relative amount of exposure provided through synthetic prime brokerage increased, which factors contributed most to the increase?
| Topic | Most Significant | 2nd Most Significant | 3rd Most Significant | Total |
|---|---|---|---|---|
| Number of Respondents |
Number of Respondents |
Number of Respondents |
||
| 1) More favorable regulatory treatment or lower balance sheet costs of synthetic prime brokerage for your firm | 0 | 1 | 0 | 1 |
| 2) Enhanced ability of your firm to manage risks associated with synthetic exposures | 1 | 1 | 0 | 2 |
| 3) Greater potential for internalization or netting of positions | 3 | 1 | 0 | 4 |
| 4) Changes in hedge fund strategies favoring synthetic exposure | 1 | 1 | 0 | 2 |
| 5) Tax or regulatory advantages of synthetic exposure for hedge funds | 0 | 0 | 1 | 1 |
| 6) Greater operational efficiency or flexibility for hedge funds using synthetic prime brokerage | 0 | 0 | 0 | 0 |
| 7) Improved access to foreign markets for hedge funds | 1 | 0 | 3 | 4 |
| 8) Market conditions (for example, volatility, liquidity) favoring synthetic exposure | 0 | 0 | 0 | 0 |
| 9) Other (please specify) | 0 | 1 | 0 | 1 |
| Total | 6 | 5 | 4 |
83C. To the degree that the relative amount of exposure provided through synthetic prime brokerage decreased, which factors contributed most to the decrease?
| Topic | Most Significant | 2nd Most Significant | 3rd Most Significant | Total |
|---|---|---|---|---|
| Number of Respondents |
Number of Respondents |
Number of Respondents |
||
| 1) Less favorable regulatory treatment or greater balance sheet costs of synthetic prime brokerage for your firm | 0 | 0 | 0 | 0 |
| 2) Increased challenges for your firm in managing risks associated with synthetic exposures | 0 | 0 | 0 | 0 |
| 3) Reduced potential for internalization or netting of positions | 0 | 0 | 0 | 0 |
| 4) Changes in hedge fund strategies favoring traditional prime brokerage financing transactions | 0 | 0 | 0 | 0 |
| 5) Tax or regulatory disadvantages of synthetic exposure for hedge funds | 0 | 0 | 0 | 0 |
| 6) Reduced operational efficiency or flexibility for hedge funds using synthetic prime brokerage | 0 | 0 | 0 | 0 |
| 7) Reduced need for access to foreign markets for hedge funds | 0 | 0 | 0 | 0 |
| 8) Market conditions (for example, volatility, liquidity) favoring traditional prime brokerage financing | 0 | 0 | 0 | 0 |
| 9) Other (please specify) | 0 | 0 | 0 | 0 |
| Total | 0 | 0 | 0 |
84. Over the past two years, how has the demand from hedge fund clients for equity financing and synthetic equity exposure to AI-focused stocks changed relative to other equity sectors?
| Number of Respondents | Percentage | |
|---|---|---|
| Increased significantly relative to other sectors | 2 | 11.1 |
| Increased somewhat relative to other sectors | 10 | 55.6 |
| Changed similarly to other sectors | 6 | 33.3 |
| Decreased somewhat relative to other sectors | 0 | 0.0 |
| Decreased significantly relative to other sectors | 0 | 0.0 |
| Total | 18 | 100.0 |
85. Over the past two years, how have the terms offered to hedge fund clients for equity financing and synthetic equity exposure to AI-focused stocks changed relative to other equity sectors?
- For price terms (for example, financing rates, fees)
Number of Respondents Percentage Tightened considerably relative to other sectors 0 0.0 Tightened somewhat relative to other sectors 2 11.1 Remained basically unchanged relative to other sectors 15 83.3 Eased somewhat relative to other sectors 1 5.6 Eased considerably relative to other sectors 0 0.0 Total 18 100.0 - For nonprice terms (for example, margin requirements, position limits)
Number of Respondents Percentage Tightened considerably relative to other sectors 0 0.0 Tightened somewhat relative to other sectors 2 11.1 Remained basically unchanged relative to other sectors 16 88.9 Eased somewhat relative to other sectors 0 0.0 Eased considerably relative to other sectors 0 0.0 Total 18 100.0
86. How does your firms ability to internalize equity positions affect the terms on equity financing and synthetic equity exposure offered to hedge fund clients?
- For price terms (for example, financing rates, fees)
Number of Respondents Percentage Significantly more favorable terms for clients when the potential for internalization is high 2 11.1 Somewhat more favorable terms for clients when the potential for internalization is high 10 55.6 No significant impact on terms 6 33.3 Somewhat less favorable terms for clients when the potential for internalization is high 0 0.0 Significantly less favorable terms for clients when the potential for internalization is high 0 0.0 Total 18 100.0 - For nonprice terms (for example, margin requirements, position limits)
Number of Respondents Percentage Significantly more favorable terms for clients when the potential for internalization is high 0 0.0 Somewhat more favorable terms for clients when the potential for internalization is high 1 5.6 No significant impact on terms 17 94.4 Somewhat less favorable terms for clients when the potential for internalization is high 0 0.0 Significantly less favorable terms for clients when the potential for internalization is high 0 0.0 Total 18 100.0
87. How important is the potential for internalization in your firms decision-making process when onboarding new hedge fund clients or expanding relationships with existing clients?
| Number of Respondents | Percentage | |
|---|---|---|
| Very Important | 5 | 27.8 |
| Somewhat Important | 13 | 72.2 |
| Not Important | 0 | 0.0 |
| Total | 18 | 100.0 |
88A. In periods of high market volatility, how does your firms reliance on internalization (as a share of total sourcing for clients exposures) change when providing equity financing and synthetic equity exposure to hedge fund clients?
| Number of Respondents | Percentage | |
|---|---|---|
| Significantly increases | 0 | 0.0 |
| Somewhat increases | 1 | 5.6 |
| Remains about the same | 17 | 94.4 |
| Somewhat decreases | 0 | 0.0 |
| Significantly decreases | 0 | 0.0 |
| Total | 18 | 100.0 |
88B. To the degree that your firms reliance on internalization increases in periods of high market volatility, which factors contribute most to the increase?
| Topic | Most Significant | 2nd Most Significant | 3rd Most Significant | Total |
|---|---|---|---|---|
| Number of Respondents |
Number of Respondents |
Number of Respondents |
||
| 1) Increased potential for offsetting client positions | 1 | 0 | 0 | 1 |
| 2) Increased difficulty or costs in externally sourcing or placing securities | 0 | 0 | 0 | 0 |
| 3) Risk-management considerations favoring internal matching | 0 | 1 | 0 | 1 |
| 4) Regulatory capital or balance sheet constraints favoring internalization | 0 | 0 | 1 | 1 |
| 5) Other (please specify) | 0 | 0 | 0 | 0 |
| Total | 1 | 1 | 1 |
88C. To the degree that your firms reliance on internalization decreases in periods of high market volatility, which factors contribute most to the decrease?
| Topic | Most Significant | 2nd Most Significant | 3rd Most Significant | Total |
|---|---|---|---|---|
| Number of Respondents |
Number of Respondents |
Number of Respondents |
||
| 1) Decreased potential for offsetting client positions | 0 | 0 | 0 | 0 |
| 2) Improved ability or decreased costs in externally sourcing or placing securities | 0 | 0 | 0 | 0 |
| 3) Risk-management considerations favoring external sourcing | 0 | 0 | 0 | 0 |
| 4) Regulatory capital or balance sheet constraints favoring external sourcing | 0 | 0 | 0 | 0 |
| 5) Other (please specify) | 0 | 0 | 0 | 0 |
| Total | 0 | 0 | 0 |