January 14, 2021
The Unusual Composition of Demand during the Pandemic1
Aditya Aladangady and Daniel Garcia
In most recessions, household spending on goods—particularly durables—and housing tends to fall sharply and remain weak for many quarters. In contrast, services spending has generally responded little to business cycles. This time, however, the opposite has occurred, as shown in Figure 1. While many services remain quite weak, goods spending and residential investment have rebounded quickly rising above pre-pandemic levels, according to the BEA's estimate of GDP for the third quarter of 2020.2
In this note, we argue social distancing plays a key role in explaining the recent shift in the composition of spending, not only by reducing spending of many services, but also by likely boosting demand for housing and related durables as consumers spend more time at home. In addition, the decline in interest rates has provided important support for housing and durables.
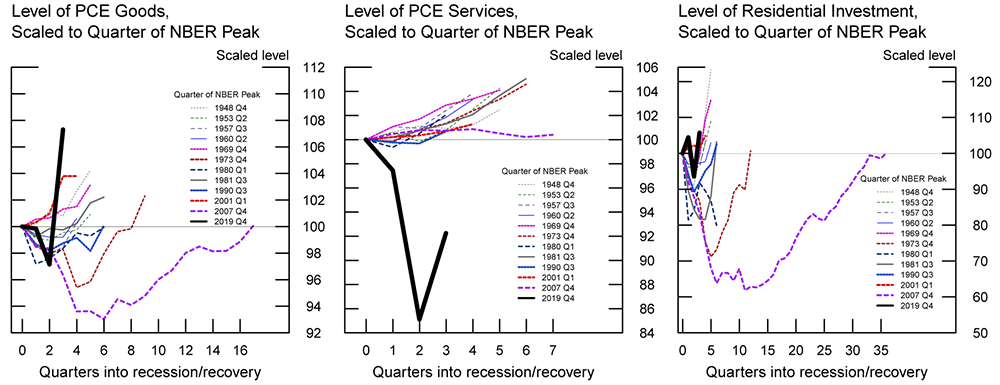
Note: Each line extends until the quarter following the NBER trough in which a series exceeds its pre-recession level or the next recession happens; or until 2020 Q3, in the case of the latest recession. Recessions are defined according to NBER. Horizontal line marked at 100 scaled level.
Source: U.S. Bureau of Economic Analysis.
The surprising resilience in housing activity
After a sharp but brief plunge, housing activity—both new construction and home sales— recovered quickly, rising above pre-pandemic levels. Record-low mortgage rates are a primary factor boosting the sector.3 Also, the pick-up in activity—some of which reflects the makeup of foregone spending during the shutdown—has been supported by the sector adjusting towards safer business practices. For many, the home sale process, from the house search to the closing itself, has moved online or toward limited-contact options.4 Moreover, the sector has been less affected by recent job losses, as new homebuyers tend to have relatively high income, and high-income workers have experienced less unemployment.5
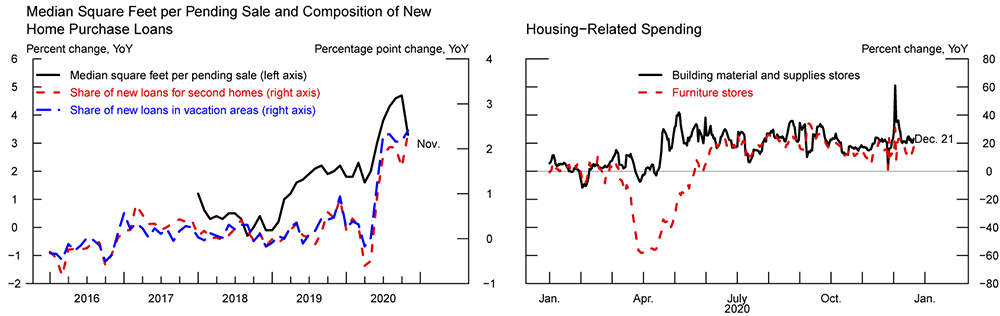
Additionally, as households adapt to spending more time at and working more from home, changes in preferences caused by the pandemic appear to be boosting housing demand. The left panel of figure 2 shows homebuyers are purchasing larger homes (left axis). Also, relatively more purchases are for second homes, many located in vacation areas (right axis). Lastly, home improvements are moving up amid spending booms at furniture as well as building material and supplies stores (right panel).
Figure 2. Median Square Feet per Pending Sale and Composition of New Home Purchase Loans and Housing-Related Spending
Left Image:
Note: New home purchase loans include single−family residences and condos. Vacation areas are defined as those where the vacation share of housing in the property's zipcode was larger than 10 percent in the 2010 Decennial Census. YoY is year−over−year change.
Source: For new home purchase loans, Black Knight McDash data and authors' calculations; for median square feet, Redfin, a national real estate broker.
Right Image:
Note: Year−over−year (YoY) changes are calculated using 7−day moving averages.
Source: Fiserv, Inc.
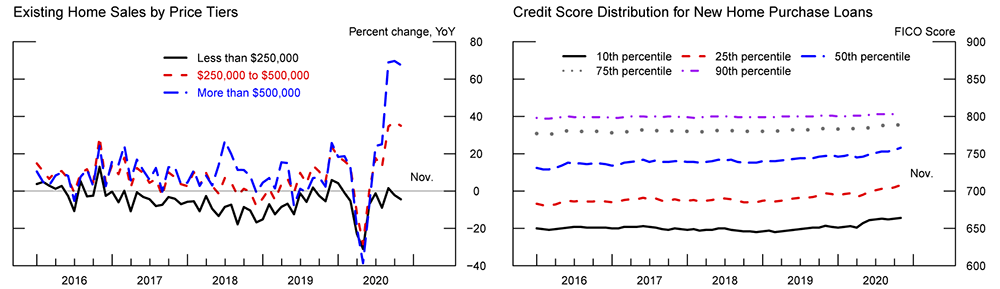
The impressive rebound in aggregate housing activity masks some of the unequal consequences of the pandemic. The left panel of figure 3 shows the recent growth in existing home sales has been particularly strong for more expensive homes, suggesting better-off households have led the recovery. For many households with low income and wealth, credit supply has likely tightened and demand fallen. Indeed, the right panel shows credit scores of new home purchases have recently moved up across the distribution, especially in the bottom half.
Figure 3. Existing Home Sales by Price Tiers and Credit Score Distribution for New Home Purchase Loans
Left Image:
Source: National Association of Realtors.
Right Image:
Note: New home purchase loans include single−family residences and condos.
Source: Black Knight McDash data and authors' calculations.
Social distancing changes the mix of consumer spending
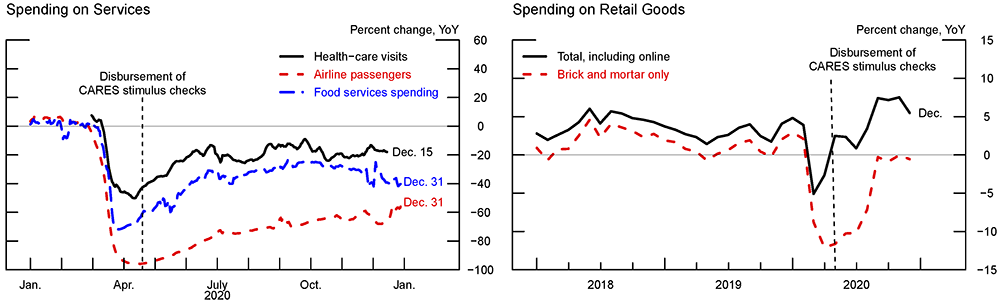
Much of the compositional shift evident in Figure 1 likely reflects how households have adapted to buying goods and services in the post-COVID economy. Since March 2020, states have imposed various restrictions on retailers and restaurants, and many activities that households previously engaged in—such as air travel—have become riskier even if they are not explicitly prohibited. As we see in the left panel of Figure 4, daily indicators of healthcare services, air travel, and food services spending have recovered some, but remain well below their levels at the same time last year, consistent with the patterns we see in official data from Figure 1.
Left Image:
Note: Year−over−year (YoY) changes in food services are calculated from 7−day moving averages. Vertical line marks the disbursement of CARES stimulus checks in about mid-April 2020.
Source: For health−care visits, Safegraph; for airline passengers, Transportation Security Agency checkpoint throughput; for food services, Fiserv, Inc.
Right Image:
Note: Year−over−year (YoY) changes in seasonally adjusted spending. Total retail excludes auto dealers. Brick and mortar is non−ecommerce component of total retail goods sales. Vertical line marks the disbursement of CARES stimulus checks in about the beginning of 2020.
Source: Mastercard Advisors, SpendingPulse.
Social distancing has had a smaller impact on goods spending, as shopping may require less in-person interaction. Even as households have lost jobs precipitously, money that was no longer being spent on services freed up budgets to spend on goods. Indeed, we see in the right panel that the decline in spending on retail goods in March was mitigated by a shift toward online sales according to a measure from Mastercard Spending Pulse data.6 In fact, many categories of goods spending had actually rebounded to near pre-COVID levels by the summer.
Interestingly, several recent studies find that spending out of CARES Act stimulus checks are similar to those found in older studies using pre-pandemic data, despite the fact that households were more limited in their ability to leave their homes and shop.7 In figure 4, we see that the large increase in goods spending in May followed on the foot of the payout of CARES Act fiscal stimulus checks in late April (vertical dashed line) and a ramp up in unemployment benefits payouts around the same time. The rise in spending following the increase in transfers was particularly sharp in online sales. We do not see a similar increase in services spending at that time, suggesting that even when liquidity was available, households shifted spending away from services towards goods. This may suggest improving labor market conditions and any further stimulus may have disproportionate effects on goods, at least until households feel safe returning to spending on services. These patterns may also provide evidence for what we may expect as additional stimulus and unemployment benefits are paid out in early 2021 under the Coronavirus Response and Recovery Act (CRRA)—particularly as this stimulus arrives at another time of rising COVID case counts.
Even with spending on goods held up by a shift away from services, we may not expect elevated goods spending to persist, at least not in durables categories. Households derive enjoyment from the furniture, electronics, cars, and appliances they own rather than the act of purchasing these goods. Put differently, households derive utility from the stock of durables they own, not the flow of additional durable goods they buy. Large fluctuations in durables spending in recent months make it useful to keep track of the stock of durables, which is more closely linked to household demand.
Figure 5 helps quantify the stock of durables relative to a simple "no COVID" counterfactual. In particular, we consider a counterfactual world where real durables spending in February 2020 continued growing as it had in the five years prior to the recession, as shown in the red dashed line in the left panel. This path of spending accounts for typical replacement, such as replacement of an old washing machine, as well as the typical increase in the durables stock over time, such as purchasing an additional car for the household.8
Figure 5. Spending on New Durable Goods and PCE Durables Stock Gap as Percent of Counterfactual Stock
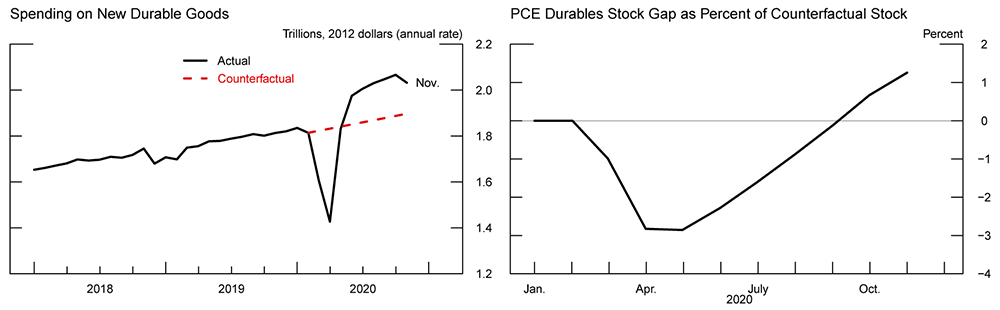
Note: Counterfactual assumes average growth from 2015 to 2019 continues from the February 2020 jumpoff point. Gap (right panel) is cumulative difference between actual and counterfactual path as percent of counterfactual.
Source: U.S. Bureau of Economic Analysis.
We see that spending on new durables (the black line) fell below its pre-COVID trend (red line) in the early months of the pandemic. Cumulating the gaps and accounting for depreciation, we see that the lower level of spending means that the stock of durables fell 3 percent below what it would have in the absence of the pandemic by April. In June, spending rose above the no-COVID counterfactual (the black line rose above the red dashed line in the left panel), and the stock of durables began catching back up to what it would have been without COVID (right panel). All the foregone durables spending had been made up by September and as of the end of 2020, the amount of durable goods owned by households was actually higher than what it would have been without COVID.
Of course, we may expect durables spending to remain above its pre-COVID trend for a little while such that the stock of durables rises a bit above the no-COVID counterfactual. As we mentioned earlier, increased time spent at home has likely shifted preferences for durable goods that are complementary to housing. Indeed, some of the strength in durables categories likely reflects different types of durable goods being purchased than was typical, as households increased spending on things like home office furniture or swing sets they may not have bought in the absence of COVID.9 Nonetheless, spending on new durable goods might eventually fall back once households accrue their desired stock of durables and reduce investment on new ones. Indeed, advanced estimates of spending data indicate a decline may have begun in November, though much uncertainty remains on the path of consumer spending going forward.
Conclusion
COVID has upended many norms in our daily lives, and this is reflected in data about how we spend. The increased risk of in-person interactions has shifted spending away from certain types of services towards goods. Goods spending itself has shifted toward online sales. Moreover, stay-at-home orders and remote work has shifted tastes for housing services—boosting demand for housing and housing-related goods. From the perspective of firms, good producers—particularly those able to sell online—and homebuilders and real estate agents may be able to maintain revenue streams, particularly if fiscal stimulus can mitigate the decline in demand from income losses. But certain service sector firms and retailers with only brick-and-mortar presence may be less fortunate, and more reliant on financing such as the Paycheck Protection Program and various credit facilities to bridge the gap in sales.
References
Aladangady, A, S. Aron-Dine, D. Cashin, W. Dunn, L. Feiveson, P. Lengermann, K. Richard, and C. Sahm (2020). "High-frequency spending response to the Earned Income Tax Credit," Mimeo.
Bils, M. and Peter J. Klenow, (1998). "Using Consumer Theory to Test Competing Business Cycle Models," Journal of Political Economy, University of Chicago Press, vol. 106(2), pages 233-261, April.
Chetty, Raj, John N. Friedman, Nathaniel Hendren, Michael Stepner, and the Opportunity Insights Team (2020). "How Did COVID-19 and Stabilization Policies Affect Spending and Employment? A New Real-Time Economic Tracker Based on Private Sector Data," Retrieved from: https://opportunityinsights.org/wp-content/uploads/2020/05/tracker_paper.pdf (PDF)
Baker, Scott R., R.A. Farrokhnia, Steffen Meyer, Michaela Pagel, and Constantine Yannelis (2020). "Income, Liquidity, and the Consumption Response to the 2020 Economic Stimulus Payments," NBER Working Paper No. 27097. Retrieved from: https://www.nber.org/papers/w27097.
Buckman, Shelby R., Mary C. Daly, and Lily Seitelman, (2020). "The Unequal Impact of COVID-19: Why Education Matters," FRBSF Economic Letter, Federal Reserve Bank of San Francisco, vol. 2020(17), pages 1-5, June.
Johnson, David, Jonathan A. Parker, and Nicholas S. Souleles. (2006). "Household Expenditure and the Income Tax Rebates of 2001." American Economic Review, 95(5), pp. 1589-1610.
Parker, Jonathan A., Nicholas S. Souleles, David S. Johnson, and Robert McClelland. (2013). "Consumer Spending and the Economic Stimulus Payments of 2008." American Economic Review, 103(6), pp. 2530-2553.
Piazzesi, Monika and Martin Schneider, (2016). "Housing and Macroeconomics," NBER Working Papers 22354, National Bureau of Economic Research, Inc.
Karger, Ezra, and Aashta Rajan (2020). "Heterogeneity in the Marginal Propensity to Consume: Evidence from Covid-19 Stimulus Payments", Federal Reserve Bank of Chicago Working Paper, No. 2020-15, May 2020.
Kueng, Lorenz (2018). "Excess Sensitivity of High-Income Consumers," The Quarterly Journal of Economics, vol. 133, no. 4, pp. 1693-1751.
1. The authors thank Nathan Ausubel and Akila Forde for assistance with data and charts. Return to text
2. See also references on the cyclicality of household spending such as Bils and Klenow (1998) and Piazzesi and Schneider (2016). Return to text
3. Other policy responses such as mortgage forbearance (which will likely prevent some foreclosures) and the Paycheck Protection Program (of which the construction industry was a top recipient) have also helped. Return to text
4. According to Redfin, 45 percent of homebuyers made sight-unseen offers in June, compared with 28 percent last year, as discussed in Lily Katz (2020), "Survey: Almost Half of Recent Homebuyers Made an Offer Sight-Unseen, the Highest Share on Record," Redfin News, July 30. Return to text
5. For example, in 2018, median household income for recent homebuyers was about $20,000 higher than the overall median, according to estimates from the American Community Survey. Return to text
6. In addition to online sales, food goods (groceries) shot up immediately following the first wave of lockdowns as households stocked up on food and shifted away from restaurant spending. Return to text
7. The uptick in goods spending following fiscal stimulus is consistent with a long literature studying responses to lump-sum payments (Johnson et al, 2006; Sahm, et al, 2012; Parker, et al, 2013; Kueng, 2018; Aladangady, et al, 2020). Notably, estimated MPCs out of fiscal stimulus in the recent episode align closely with those found previously, despite the money being delivered amid a pandemic that hampered the ability of households to leave their homes and shop (Baker, et al, 2020; Karger & Rajan, 2020; Chetty, et al, 2020). Return to text
8. The counterfactual can be thought of as an approximation of the balanced growth path in a growth model, which would account for replacement for depreciation, population growth, and secular trends in the durables/capital stock per individual. Return to text
9. Durables price inflation has been high, suggesting a combination if elevated demand and limited supply. Of course, supply constraints may reflect supply chain constraints driven by the pandemic's impact on the labor market and flow of intermediate goods, but it may also reflect some mismatch between inventories and the types of goods households are demanding. Return to text
Aladangady, Aditya, and Daniel Garcia (2020). "The Unusual Composition of Demand during the Pandemic," FEDS Notes. Washington: Board of Governors of the Federal Reserve System, January 14, 2021, https://doi.org/10.17016/2380-7172.2831.