December 15, 2025
The Inflation Outlook
Governor Stephen I. Miran
At the School of International and Public Affairs, Columbia University, New York, New York
Thank you, Mr. Secretary. I appreciate the opportunity to speak here today.1
When I offered my assessment of policy in my first speech as a Federal Reserve Governor in September, I assumed inflation for core goods and nonhousing core services would continue to run at current rates.2 While that was a useful working assumption at the time, today I will break down my inflation outlook in more detail. Specifically, I'll share my interpretation of inflation's components and how this influences my perception of progress toward our 2 percent target.
Shelter Inflation
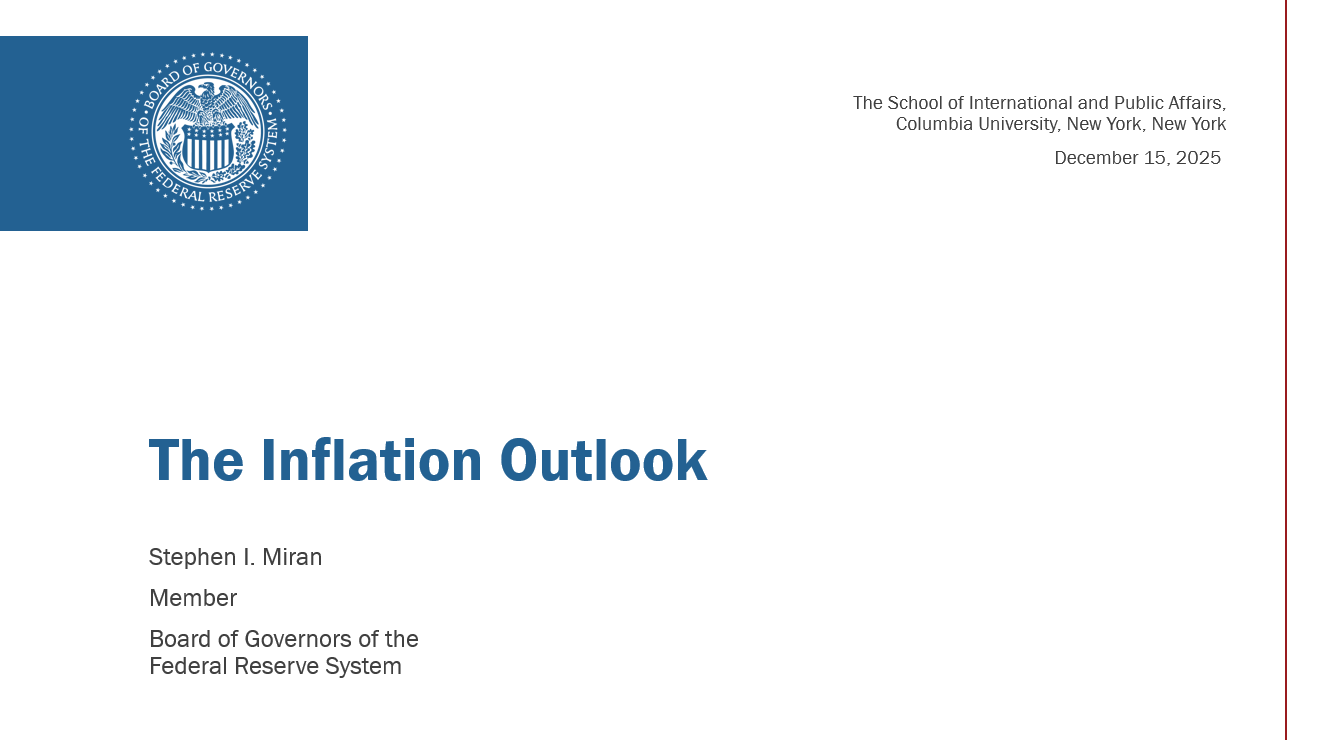
Shelter costs are top of mind for households, and a large component of inflation indices. But calculating shelter inflation is far from simple. For instance, the personal consumption expenditures (PCE) price index that the Fed targets includes housing costs for all households in the economy. That seems appropriate for capturing prices associated with all consumer spending but not ideal as a measure of current supply and demand pressures. Figure 1 makes that clear: As the economy emerged from the pandemic, demand for housing outstripped supply, and market rents for new tenants jumped. But the PCE shelter index for all households lagged, as rents only reset when people move or renew their leases. PCE will always lag market rents.
As recently as last year, the PCE shelter index still had catching up to do, creating uncertainty as to how long measured shelter inflation would remain elevated. This is no longer the case. Indeed, a separate all-tenant rent index—drawn from the same microdata as PCE shelter—caught up to new-tenant rents, while PCE shelter has actually overshot new rents.3 Based on this catchup being complete, I expect a faster fall in PCE shelter inflation.
The current elevated readings for shelter inflation are an after-echo of previous, rather than current, supply–demand imbalances in the economy. For the past two years, we've seen extremely low increases in new-tenant rents. Measures by Cotality and Apartment List show that's persisted in recent quarters. I therefore expect a faster decline in PCE shelter inflation. Two factors give me additional confidence: first, the negative population shock resulting from a reversal in net migration, and second, an elevated ratio of nominal shelter services consumption relative to overall consumption, which has historically been mean-reverting.
Core Nonhousing Services Inflation
Another important part of household budgets is the cost of services besides housing, food, and energy. These services are about half of household spending and include childcare, education, entertainment, and medical expenses. Core nonhousing services inflation has moved sideways this year, somewhat above the average level observed from 2002 to 2007, a useful reference period when core PCE inflation averaged 2 percent. However, I am not worried about nonhousing services.
Wages are the primary driver of service inflation. Many service prices are driven by labor costs; for instance, labor compensation is about 60 percent of value added in leisure and hospitality and 83 percent in education and health services. Over the medium term, nonhousing services will follow labor market pressures.
Unemployment has trended higher for over two years, and wage growth lower. Additional measures of labor market tightness—such as job openings, consumer surveys about the difficulty of finding jobs, long-term layoffs, and the duration of unemployment—have suggested a loosening labor market for several years, tilting nominal wage growth risks toward the downside.
A notable aspect of core services inflation is that not all components are measured from directly observed transactions. Many services components in the index are imputed in various ways and do not capture information about supply–demand imbalances that are relevant for monetary policy. A prime example is portfolio management services, which have contributed a quarter-point to core PCE inflation in the last year, well above their long-run average.
The Bureau of Economic Analysis measures portfolio management costs based on overall revenues generated by asset managers. If the stock market goes up and boosts assets under management, revenues move in tandem since they are typically a fixed percentage fee of assets. What ought to be recorded as an increased quantity of services consumed is instead recorded as increased prices. There may, for national accounting purposes, be a good reason for doing it this way. But, for monetary policy purposes, there is none, and it would be foolish of us to chase statistical quirks rather than focus on actual consumer prices.
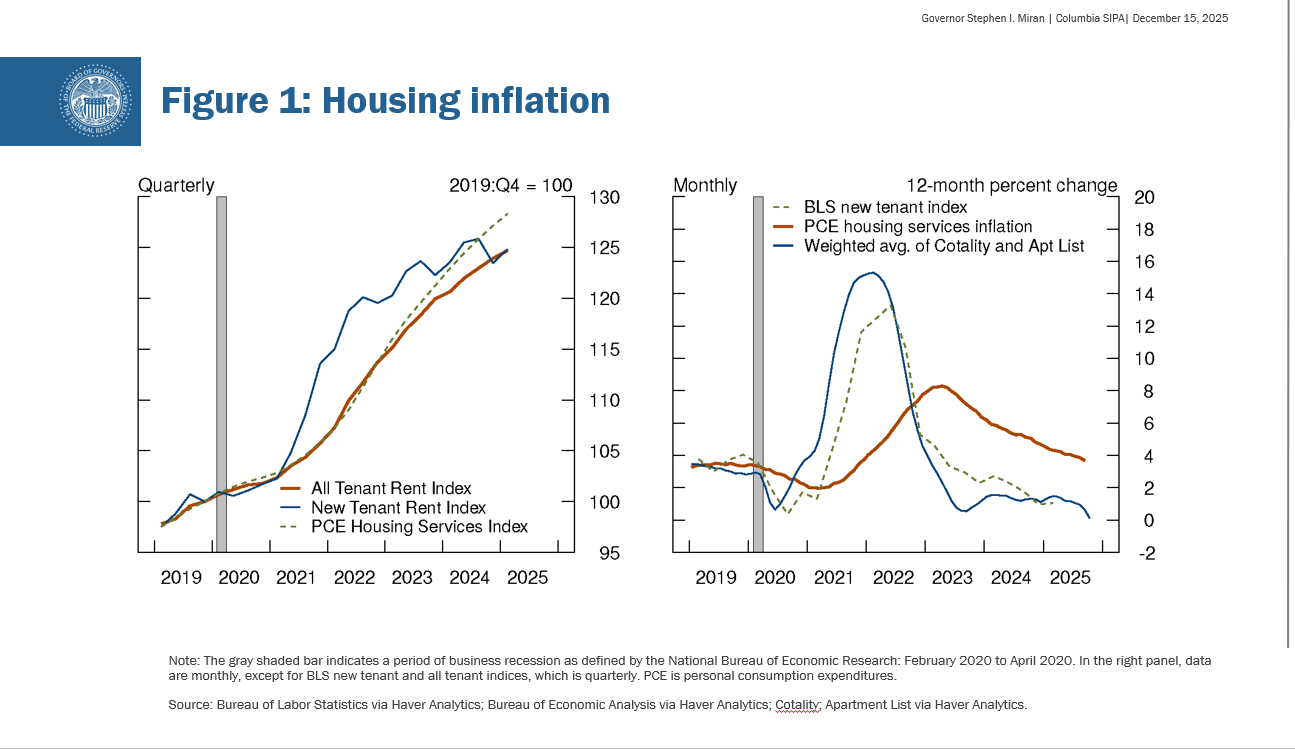
Remarkably, long-term trends in the asset management industry point toward fee compression, indicating trend deflation. Morningstar found the average expense ratio paid by investors fell nearly 6 percent in 2024.4 By contrast, PCE recorded a roughly 20 percent increase in portfolio management fees in this period, contributing about 30 basis points to core PCE. If PCE had instead matched industry data with a 6 percent decline, core PCE would have been about 40 basis points lower than officially reported.
Fees have consistently fallen each year for the past two decades, now less than half of what they were in 2005, as seen in figure 2.5 The PCE portfolio management measure contains no signal regarding tightness in the asset management industry, let alone the economy. It contains no signal for the inflation forecast going forward. It should not be used to frame underlying inflation. Yet here we are, keeping interest rates too high because of the phantom inflation of portfolio advisory fees.6
For these reasons, I do not take much signal from nonmarket-based components. When looking at market-based services, inflation in this category has come down dramatically from its peak and moved sideways since mid-2024, at around 3 percent. That is about 10 basis points below its average from 2002 to 2007, which, again, was a period in which PCE inflation was broadly at target. Core nonhousing services inflation only remains elevated compared with this period because of nonmarket components.
Core Goods Inflation
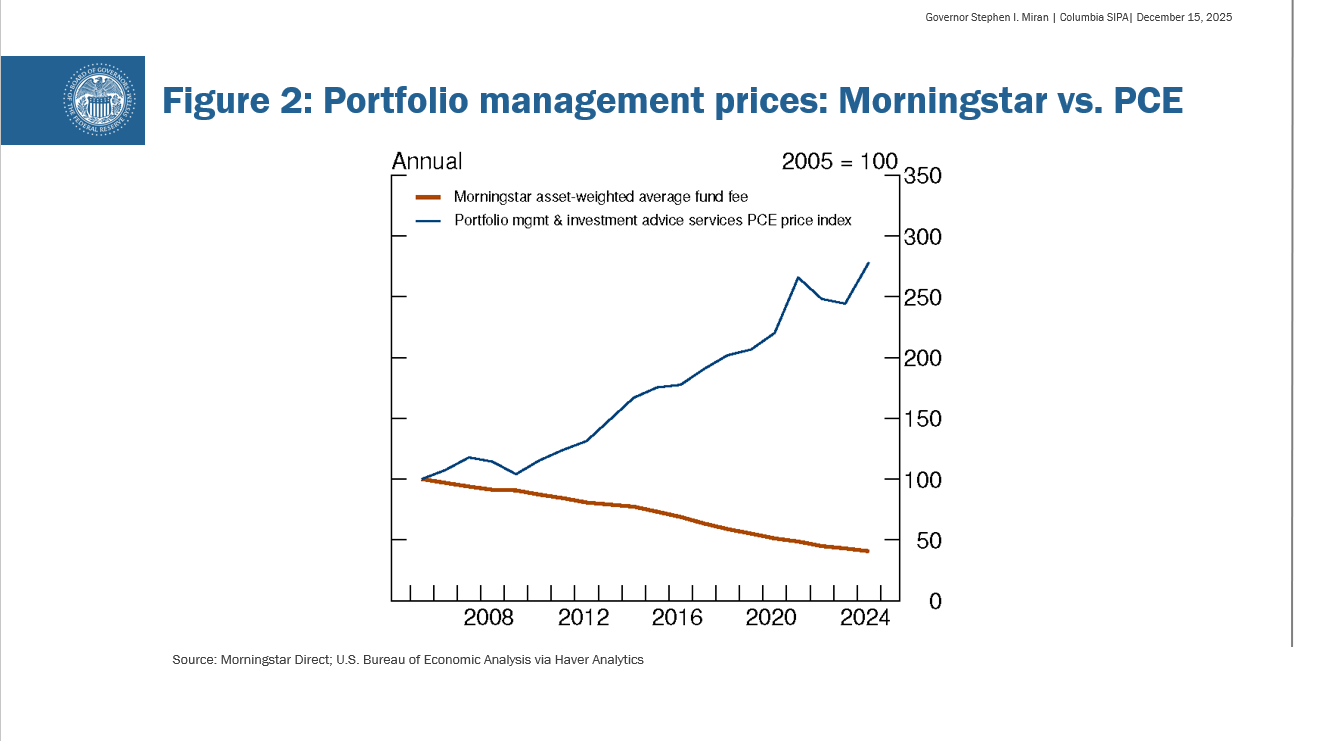
Turning to goods prices, they have been relatively less likely to rise than other index components since the turn of the century. That trend was abruptly disrupted in the aftermath of the pandemic. After that, core goods inflation fell into negative territory for a brief period of around one year. Over the past 12 months, core goods inflation has picked up. The dominant narrative explaining this pattern blames U.S. tariff policy. I am not convinced.
Consider the timing, as shown in figure 3. In core goods PCE, it appears that the increase coincides with the imposition of tariffs during this year. However, in the consumer price index, the upturn began in the middle of 2024. We don't target CPI, but it contains useful information. The evidence that tariff policy neatly coincides with the increase in core goods prices is conflicted.
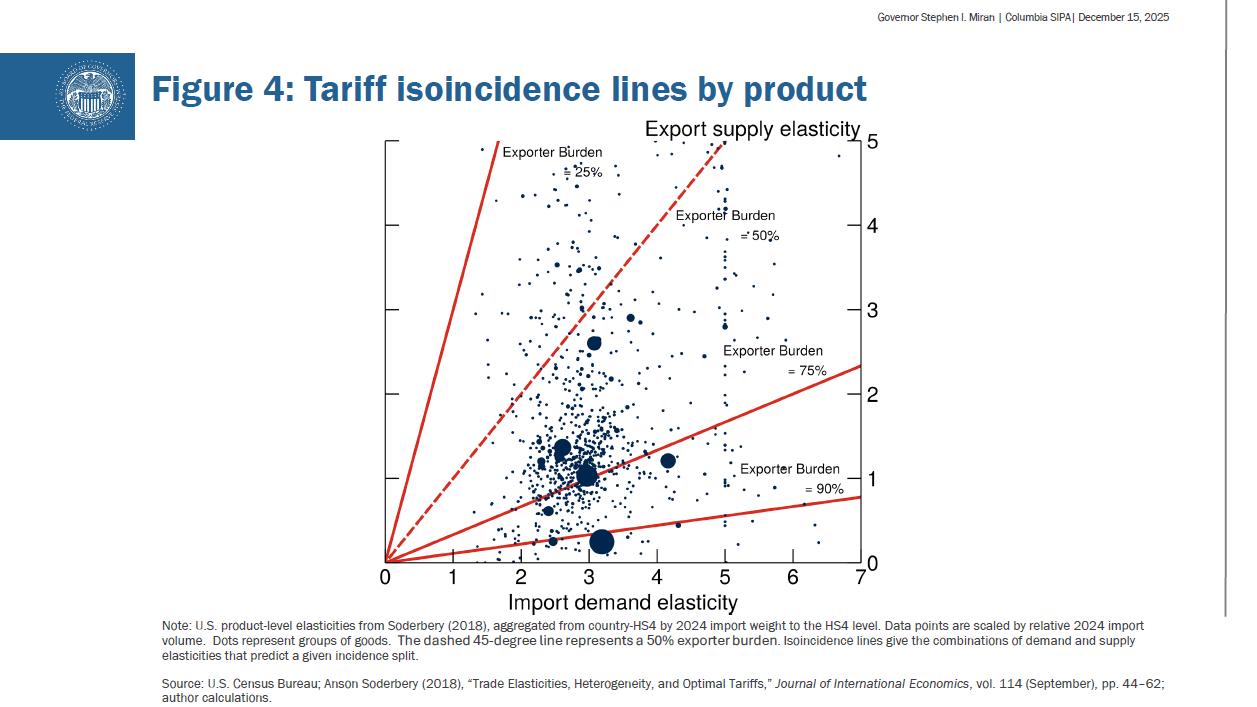
When thinking through the effect of tariffs on prices, we must remind ourselves that the larger share of incidence or burden of any economic policy—tax, subsidy, or tariff—falls on the more inelastic or inflexible party. This is because the more elastic or flexible party can change its behavior to avoid the burden of the tax. As an importer, the U.S. is relatively more elastic, since we can substitute demand across borders or manufacture goods at home. But producers' factories are installed capital that is stuck in place, and their labor is generally immobile and not easily substitutable across tradable and nontradable sectors. As the largest trade deficit country, there are few substitutes, if any, for American demand, but many substitutes for potential supply.
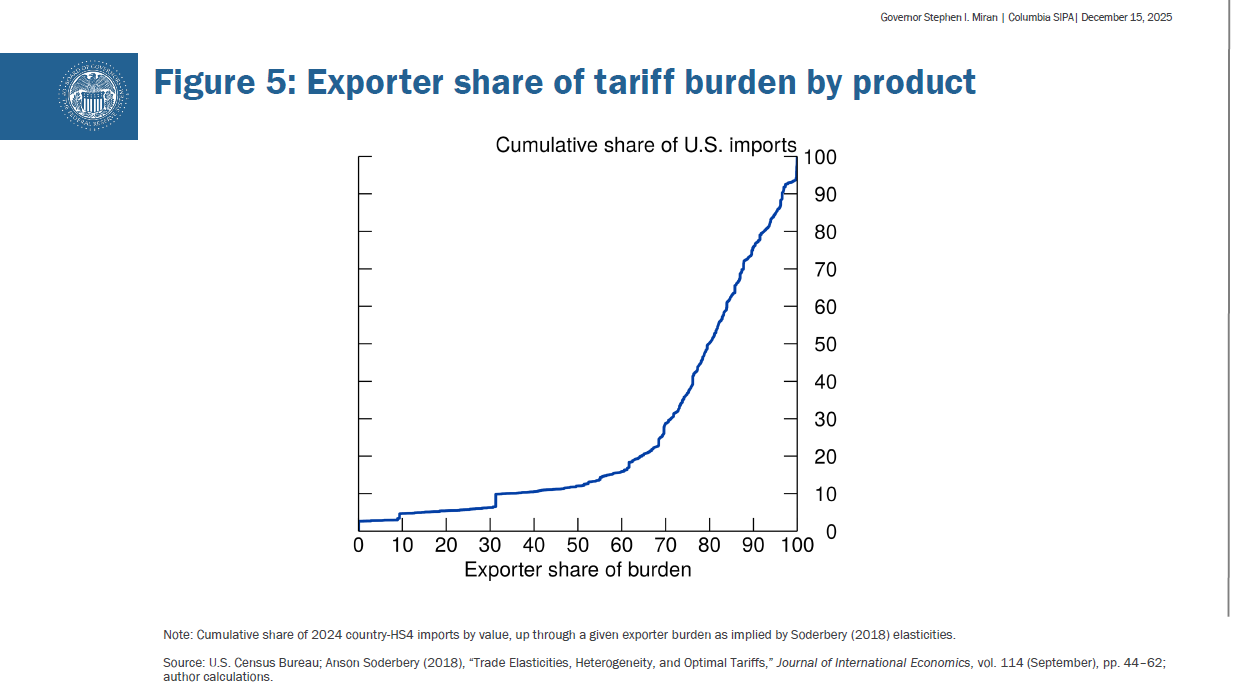
Product-level estimates of demand and supply elasticities from Anson Soderbery can be used to examine goods-level incidence.7 Figure 4 draws predicted isoincidence lines. The 45-degree line characterizes goods which have equal supply and demand elasticities, meaning incidence is evenly split between exporter and importer. The overwhelming majority of goods lie below the 45-degree line, meaning importers bear less burden. Figure 5 shows the cumulative distribution of import value based on the incidence absorbed by exporters. These elasticities imply that, for about 70 percent of import goods value, the exporter bears at least 70 percent of the incidence, and for about half of goods value, the exporter bears at least 80 percent of the incidence.8
Of course, there are goods for which importers bear material incidence, and that will mean relative price changes—but whether they prove to be relevant for aggregate prices depends on other considerations. Given the Soderbery (2018) elasticities and a split of the domestic incidence between wholesale importers and consumers, it is plausible that the ultimate effect of tariffs on consumer price levels will be in the neighborhood of two-tenths of a percent—noise.9
By contrast, many analyses for what tariffs would do to inflation were based on empirical studies of the U.S.–China trade conflict before the pandemic. However, these studies suffer from bias from trade rerouting and de minimis exemptions. If a Chinese exporter can avoid bearing incidence by costly transshipment or exploitation of the de minimis loophole, the incentive to do so will be highly correlated with the incidence absorbed. In other words, goods for which China would have to absorb a greater share of the tariff cost drop from the sample, while goods for which China could push through tariff costs to importers remain in the sample, violating identification restrictions. Jackson Mejia has studied this bias in pass-through estimates and finds evidence that up to 40 percent of product categories exposed to tariffs are affected by transshipment, with trade volumes approaching 25 percent for intermediate and capital goods.10 The de minimis exemption poses similar identification problems, meaning the transshipment effects are lower bounds on the identification problem in this literature.11 Additionally, these studies are short term in nature, and incidence analyses are usually long term; a difference in short-run and long-run elasticities is not controversial.
Moreover, any claim that tariffs are a current driver of inflation must be accompanied by a clear description of the counterfactual. Several analyses use the two decades before the pandemic as the relevant counterfactual; I do not find these periods to be reasonable given large concurrent shocks that pollute the analysis. Attributing all excess inflation over the pre-trend to tariffs is something that could be done for many recent policies or shocks, such as an emphasis on supply chain resilience after the pandemic unrelated to tariffs.
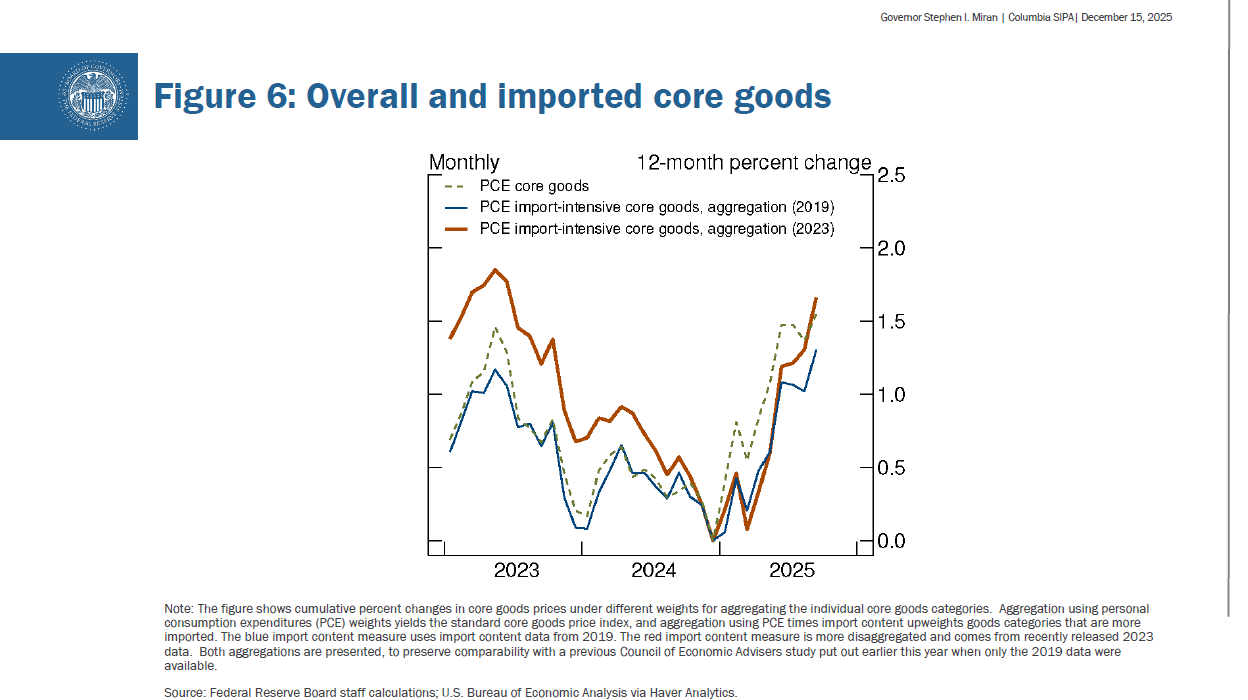
One counterfactual I think makes sense to use compares import-intensive core goods versus overall core goods, as shown in figure 6.12 If tariffs were the driver of recent inflation, then one would expect import-intensive core goods to see substantially more inflation. In fact, total core goods prices have risen at approximately the same rate as import-intensive goods since the end of last year.
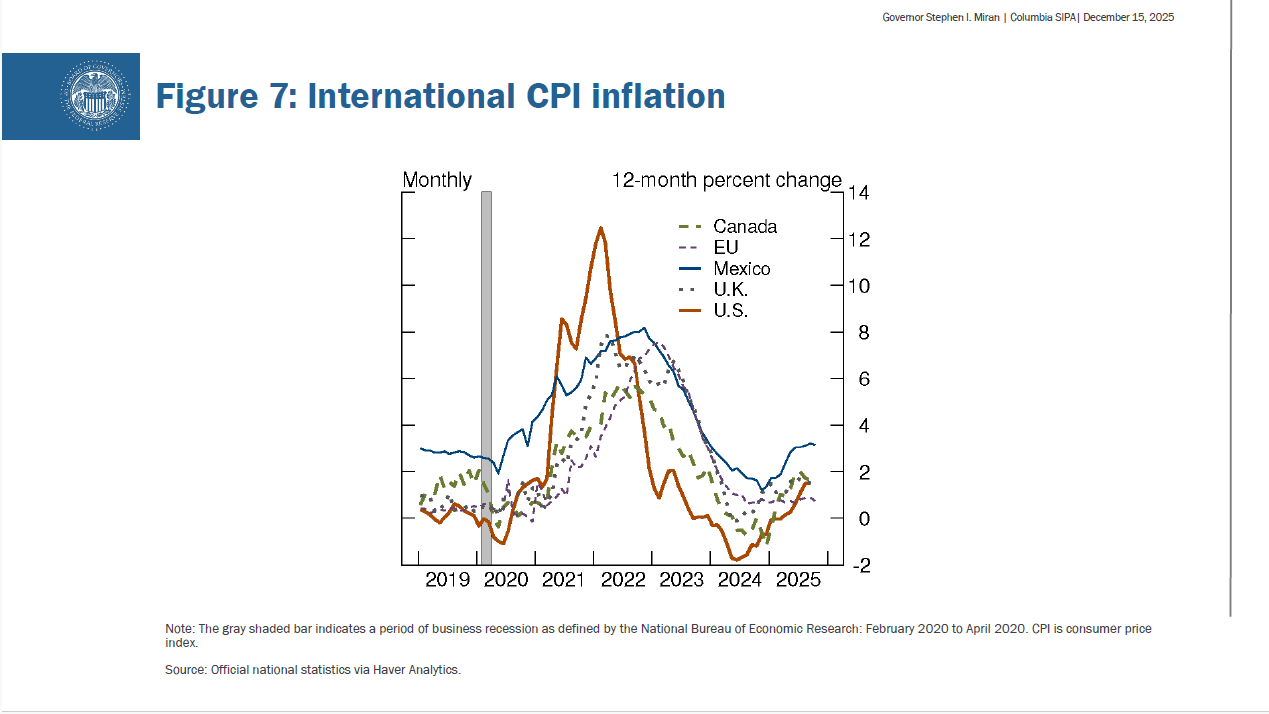
I also compare the level of inflation in the U.S. to that of other industrialized countries, displayed in figure 7. If U.S. tariff policy were a material driver of domestic inflation, then U.S. goods inflation would visibly stick out from major trading partners. Yet U.S. inflation is comparable to that in Canada and the U.K., slightly above that in the European Union, and below that in Mexico; the U.S. doesn't stand out in any direction. Neither counterfactual suggests tariffs are the primary driver of core goods inflation.
Even if one believes that tariffs are driving goods inflation, the standard practice is for central bankers is to "look through" a transient shock, as a one-time increase in the price level differs from a persistent shift to inflation. This mirrors how value-added taxes are treated by central banks. Monetary policy achieves stable prices through balancing aggregate supply and demand; changes in prices stemming from relative tax adjustments—incidence aside—are not indicative of supply–demand imbalances.
While the burden from tariffs will ultimately be borne by the exporters, this analysis is drawn from long-term elasticities. In the short run, it may take time for threats of moving supply chains to become credible, creating a lag before exporters reduce selling prices. Although I do not yet see meaningful tariff-driven inflation, it may materialize. But over time, short-run elasticities would converge with long-run elasticities. Not only would the increase in inflation be transitory, but likely so would the increase in the price level, meaning subsequent offsetting deflation.13
If tariffs are not the likely cause of the recent rise in goods inflation, then what is? One possibility is that the rise in prices is noise in a volatile series, though this is not a satisfying answer. A second possibility is that the U.S. and other advanced foreign economies are still following post-pandemic bullwhips of gradual oscillation around a lower mean level of core goods inflation. Under that scenario, last year's core goods inflation was "too low" and now it is "too high"; perhaps next year it will be "too low" again.
A third, unsavory, possibility is that goods inflation is settling in at a higher level than prevailed immediately pre-pandemic. After all, there were previous regimes with stable but higher core goods inflation. Higher global goods inflation could result from a longer-term trend of trade restructuring that encompasses much more than tariffs, including a reduced willingness to rely on unfettered access to exports in favor of national security and geoeconomic concerns. Attention to supply chain security and resilience—which predates this year's tariffs—may mean higher core goods inflation for a longer period, though perhaps not this high.
I accept I don't know what's driving higher goods inflation currently. As former Bank of England Governor, Mervyn King, and economist, John Kay, urged in Radical Uncertainty, pretending we have more knowledge than possible will stymie our understanding of reality.14 Shedding that hubris will help us reach a clearer understanding of the dynamics and make better decisions.
I do see reasons to be optimistic about goods inflation. One is that the rapid deregulatory push to expand supply will, all else equal, decrease prices. Another is that work by Bloomberg Economics using AI to analyze thousands of public company earnings calls indicates price pressures in measured goods inflation will begin to decline within two quarters.15
Policy
The lack of a clear downward forecast for core goods prices might suggest keeping interest rates elevated. However, I expect more than enough disinflation from housing services to counterbalance that possibility. Core goods represents just 25 percent of the core PCE index. Indeed, my earlier forecasts were conditioned on core goods inflation staying at this rate for longer. The risks to my forecast are if shelter inflation picks up again, or if core goods inflation remains well above 2 percent. I judge those cases to be unlikely. If I am right about shelter but wrong about tariffs, we will undershoot our inflation target.
To summarize, we must be thoughtful in considering genuine underlying inflationary pressures. Excess measured inflation is unreflective of current supply–demand dynamics. Shelter inflation is indicative of a supply–demand imbalance that occurred as much as two to four years ago, not today. Given monetary policy lags, we need to make policy for 2027, not 2022.
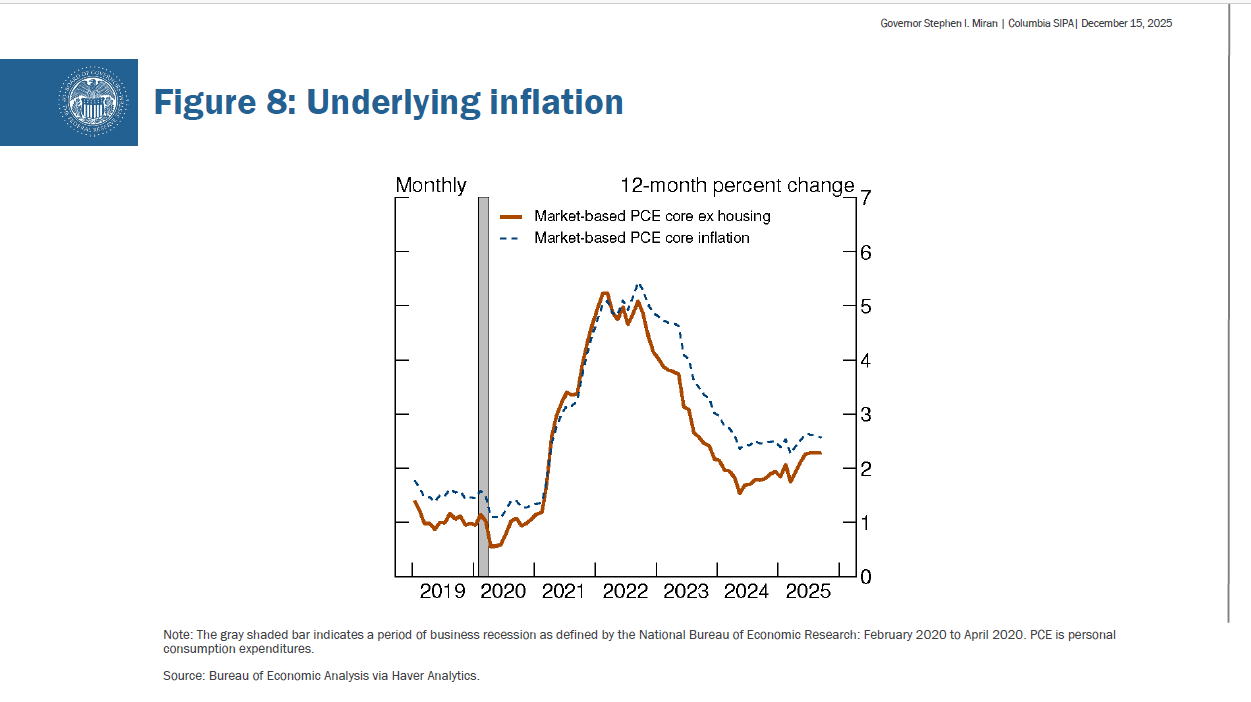
A better measure of underlying inflation would account for distortions from shelter and imputed prices. Removing imputed phantom inflation like portfolio management, market-based core inflation is running below 2.6 percent, as seen in figure 8. If we further remove housing and look at market-based core ex shelter, underlying inflation is running below 2.3 percent, within noise of our target. Once shelter inflation has normalized from the anomalous post-pandemic experience, ordinary market-based core may be more appropriate.
Some might accuse me of cherry-picking a preferred measure, but my gauge of underlying inflation excludes less of the index than some other measures. It is also easy to understand and has a straightforward rationale for discarding certain slices of the index. Market-based core includes 75 percent of overall PCE, and market-based core ex housing includes 60 percent; core services ex housing is only 51 percent of PCE and discards goods, which are salient. Moreover, James Stock and Mark Watson find that market-based prices are more tightly related to cyclical measures of the economy than poorly measured components like imputed prices.16
Keeping policy unnecessarily tight because of an imbalance from 2022, or because of artifacts of the statistical measurement process, will lead to job losses. There was a large bout of inflation that resulted in an increase in prices after the pandemic. While American families are still rightly distraught with that experience and unhappy with affordability, prices are now once again stable, albeit at higher levels. Policy should reflect that.
Fortunately, the shelter outlook appears relatively clear—because market rents lead measured inflation—and powerful enough to overwhelm even the possibility of sustained higher goods inflation. Underlying inflation is near, and further approaching, our target.
On the other side of our mandate, experience suggests that labor market deterioration can occur quickly and nonlinearly and be difficult to reverse. In part because monetary policy lags several quarters, a quicker pace of easing policy—as I have advocated—would appropriately move us closer to a neutral stance.
Recessions are an inevitable part of the business cycle, and at some point, we will suffer one. We should strive to ensure that point is as far in the future and as shallow as possible by appropriately calibrating monetary policy.
1. The views expressed here are my own and are not necessarily those of my colleagues on the Federal Reserve Board or the Federal Open Market Committee. Return to text
2. Miran, Stephen I. (2025), "Nonmonetary Forces and Appropriate Monetary Policy," speech delivered at the Economic Club of New York, New York, N.Y., September 22. Return to text
3. The main differences are a set of sample restrictions; for example, PCE shelter imputes many missing observations that are dropped from the other two indices. A comparison of the different indices is available from the Bureau of Labor Statistics (CPI rents flow into PCE rents) at https://www.bls.gov/cpi/research-series/r-cpi-ntr.htm Return to text
4. Morningstar Manager Research (2024), "How Fund Fees are Evolving in the US," July 16 Insights (blog), (updated October 8), https://www.morningstar.com/business/insights/blog/funds/us-fund-fee-study. Return to text
5. Ibid. Return to text
6. Monetary policy should not mechanically respond to asset prices vis-à-vis the inflation channel. Financial markets reflect a host of factors—including technology, tax and regulatory policy, population, trade, and many other things—which may have separate or joint implications for neutral rates, the output gap and inflation but which require nuanced analysis and interpretation. Return to text
7. Anson Soderberry (2018), "Trade Elasticities, Heterogeneity, and Optimal Tariffs," Journal of International Economics, vol. 114 (September), pp. 44–62. Return to text
8. The weighted mean incidence drawn from the Soderbery (2018) elasticities is 70 percent borne by the exporter. This number is not far from what would be implied by using an aggregate demand elasticity of negative 3, in line with the trade literature, and a supply elasticity of 1. Unfortunately, much of the literature question begs large supply elasticities as a result of Dixit-Stiglitz style production characterized by constant markups, constant marginal cost, and free entry.
Papers that move away from these assumptions find lower supply elasticities or pass-through of marginal cost shocks into prices; for instance, see Amiti, Itskhoki, and Konings (2019) without constant markups (Mary Amiti, Oleg Itskhoki, and Jozef Konings (2019), "International Shock, Variable Markups, and Domestic Prices," The Review of Economic Studies, vol. 86 (6), pp. 2356–402); Bergstrand, Cray and Gervais (2023) without constant marginal costs (Jeffrey H. Bergstrand, Stephen R. Cray, and Antoine Gervais (2023) "Increasing Marginal Costs, Firm Heterogeneity, and the Gains from 'Deep' International Trade Agreements," Journal of International Economics, vol. 144 (September)); or Alessandria, Choi and Ruhl (2021) without free entry (George Alessandria, Horag Choi, and Kim J. Ruhl (2021), "Trade Adjustment Dynamics and the Welfare Gains from Trade," Journal of International Economics, vol. 131 (July)).Therefore, I prefer to use the Soderbery (2018) estimates, which don't require these assumptions. Subsequent work by Soderbery, with Farid Farrokhi, employs some of these micro-founding assumptions on production, which, like in other papers, lead to large elasticities of supply. See Farid Farrokhi and Anson Soderbery (2024), "Trade Elasticities in General Equilibrium: Demand, Supply, and Aggregation," The Review of Economics and Statistics.
Working outside the trade general equilibrium literature, Horioka and Ford (2025) model capital mobility without comparative advantage, and if factor shares in this model are adjusted to reflect higher capital shares in surplus countries than deficit countries, incidence largely falls on the tariffed nation. See Charles Yuji Horioka and Nicholas Ford (2025), "A New Modeling Approach to Help Address the Trump Tariffs," (PDF) Discussion Paper Series DP2025-31 (Japan: Kobe University, December).
Moreover, installed capital is usually the least elastic factor of production, and, with imperfect substitutability between tradable and nontradable labor, there is a real sense in which labor in those factories is similarly installed; welders do not easily become hairdressers. It is exceedingly strange that much of the literature on trade and tariff incidence neglects to study not only capital altogether but installed capital in particular, which, in many public finance settings, can serve as an incidence sink. Return to text
9. The calculation is the product of a 12.3 percent change in tariffs, a 30 percent domestic share of incidence, a 50 percent split between wholesale importers and consumers, and a roughly 10 percent import share of overall PCE. If wholesale importers take all the tariff incidence on margin, the effect on consumer prices will be zero. If they take none of it on margin, and are able to pass through the entirety of the incidence to consumers, the effect will be about 0.4 percent. Two-tenths is the midpoint. Moreover, standard incidence calculations require competitive markets. To account for potential imperfect competition, a broader set of parameters may be necessary, as in Weyl and Fabinger (2013), but identification would tax an already burdened empirical trade literature beyond what I fear it might bear. E. Glen Weyl and Michal Fabinger (2013), "Pass-Through as an Economic Tool: Principles of Incidence under Imperfect Competition," Journal of Political Economy, vol. 121 (June), pp.437–641. Return to text
10. Jackson Mejia (2025), "Selection into Tariff Avoidance and the Measured Welfare Cost of Tariffs," working paper, Massachusetts Institute of Technology, October, available at http://dx.doi.org/10.2139/ssrn.5653130. Return to text
11. Though the exemption was eliminated in 2025, the bias will infect studies drawn from earlier data. Return to text
12. Federal Reserve Board staff replicated and extended a methodology described in The Council of Economic Advisers (2025), Imported Goods Have Been Getting Cheaper Relative to Domestically Produced Goods (PDF) (Washington: Council of Economic Advisers). On Figure 6, the blue import content measure uses import content data from 2019 and the red import content measure is more disaggregated and comes from recently released 2023 data. I included both aggregations to preserve comparability with the earlier CEA study which was produced when only the 2019 aggregation was available. Return to text
13. For an example of recent research that uses dynamic elasticities to show that real wages can first decline and then go up (similar to inflation going up then down), albeit through a different channel than I'm describing, see Alessandria, George A., Jiaxiaomei Ding, Shafaat Y. Khan, and Carter B. Mix (2025), "The Tariff Tax Cut: Tariffs as Revenue," NBER Working Paper Series 33784 (Cambridge, Mass.: National Bureau of Economic Research, May). Return to text
14. John Kay and Mervyn King (2020), Radical Uncertainty (New York: W. W. Norton & Company) Return to text
15. Anna Wong, Joshua Danial, and Alex Tanzi (2025), "17,500 Earning Calls Greenlight Big Fed Cuts in 2026," Bloomberg Economics, December 12 Return to text
16. See James H. Stock and Mark W. Watson (2019), "Slack and Cyclically Sensitive Inflation," NBER Working Paper Series 25987 (Cambridge, Mass.: National Bureau of Economic Research, June). See also the related work of the San Francisco Federal Reserve Bank of San Francisco on cyclical inflation, available at https://www.frbsf.org/research-and-insights/data-and-indicators/cyclical-and-acyclical-core-pce-inflation/. Return to text