FEDS Notes
June 26, 2026
A News-Based Approach to Measuring Shortages and Their Effects on the Global Economy
Dario Caldara and Matteo Iacoviello
The conflict in the Middle East has severely constrained global supplies of oil and natural gas. The conflict is also disrupting the provision of other inputs critical to global supply chains, such as naphtha and fertilizers, leading to lengthier delivery times and surging prices for affected products. To assess the possible effects of such developments on the global economy, researchers and policy analysts draw from a wide range of data, ranging from commodity prices, survey data, and indicators of supply chain pressures such as the Federal Reserve Bank of New York's Global Supply Chain Pressure Index (GSCPI). Overall, the various indicators point to supply chain pressures having increased in recent months, especially abroad.
In this note, we examine one indicator—the "shortage index"—that tracks newspapers' coverage of supply disruptions in the U.S. and abroad across history and economic sectors (Caldara, Iacoviello, and Yu, 2025). Such a news-based indicator complements other measures by capturing real-time, qualitative, and forward-looking information that surveys and economic data may miss or reflect with some delay. Because the index extends back to 1900, it places current events in historical perspective and allows us to estimate how shortages have moved with global activity and prices in the past. Using an econometric model, we find that a rise in our shortage index of the magnitude seen since the eve of the conflict has historically been associated with a reduction in world GDP of 0.8 percent and an increase in world headline prices of 1 percent after about three years.
The Shortage Index
Shortages have been a recurring feature of economic life. From widespread disruptions during major wars to the acute shortages of goods and labor during the COVID-19 pandemic, episodes of extensive shortages have been associated with strained supply chains, hindered production and consumption, and significant hardship for businesses and households.
While the textbook definition of shortages is the inability of supply to meet demand at prevailing prices, media, market participants, and the public often view shortages through a broader lens—for instance, associating shortages with severe supply-side pressures or the limited availability of specific consumption goods and production inputs. Furthermore, media discussions about shortages may conflate both ongoing and prospective shortages.
To assess the prevalence of shortages in this broad sense over history, we have constructed a shortage index that relies on textual analysis of 25 million articles in six major U.S. newspapers spanning from 1900 through the present. This index is constructed as the share of articles mentioning terms associated with shortages in four categories: food, industrial products, labor, and energy.1 The index serves as a proxy for both domestic and global shortages, implicitly weighted by their relevance to a U.S. audience.
Figure 1 shows the monthly shortage index from 1900 through May 2026. The index varies considerably over time, with the most notable spikes linked to events related to the four classification topics. Adverse geopolitical events, especially wars, are strongly associated with severe shortages: the index rises sharply during World War I and during World War II, peaking at over 1,000 (10 times the sample mean) in January 1943, with spikes recorded across all shortage categories. Other events, such as the Suez Crisis and the Iraqi invasion of Kuwait in 1990, also coincide with substantial spikes. Labor shortages, particularly those caused by strikes, were historically significant, especially in the early part of the sample. More recently, the index spiked on several occasions during the COVID-19 pandemic. The first spike corresponds to shortages in medical equipment and healthcare workers at the pandemic's onset. A second, larger spike occurred at the beginning of 2022, driven by global supply bottlenecks as economies reopened after prolonged mobility restrictions in 2020 and 2021.
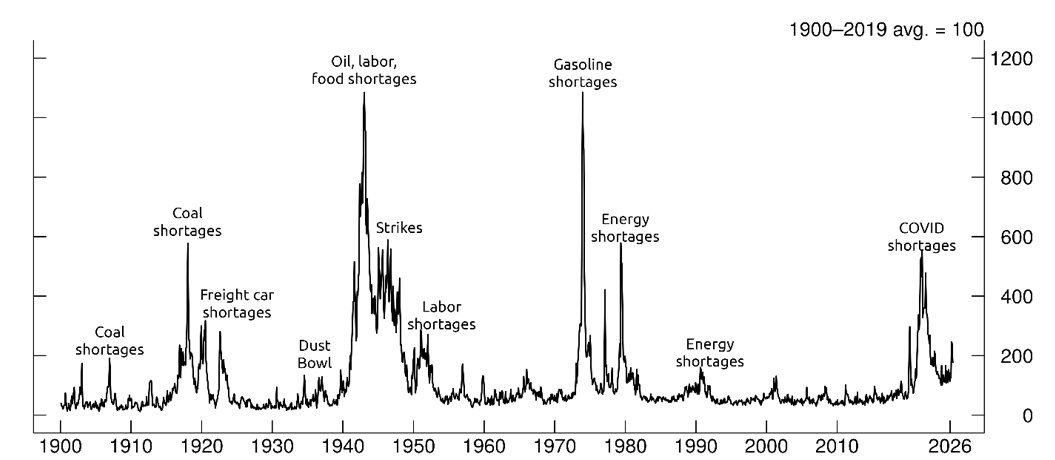
Note: Monthly data extend through May 2026. The shortage index is normalized to average 100 in the 1900–2019 period.
Source: Dario Caldara, Matteo Iacoviello, and David Yu (2025).
The black line in figure 2 plots our shortage index since 2020, together with its four subcomponents. In May 2026, the index stood at 175, a value substantially lower than the heights reached during the pandemic and accompanying recovery but 75 percent higher than the historical average. The recent readings mostly reflect news coverage of conflict-related shortages of energy and industrial products and, to a lesser extent, shortages of AI-related computer chips.2
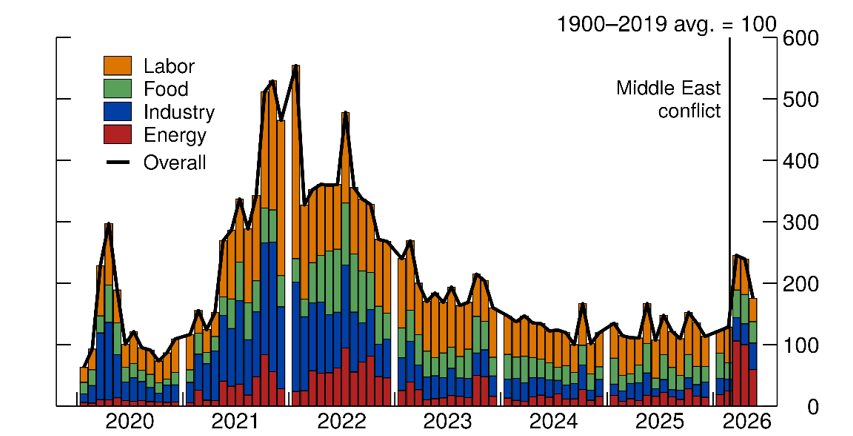
Note: Monthly data extend through May 2026. Key identifies in order from top to bottom. The shortage index is normalized to average 100 in the 1900–2019 period. The overall index is the sum of the indexes for labor, food, industry, and energy shortages.
Source: Dario Caldara, Matteo Iacoviello, and David Yu (2025).
Measuring the Effect of Shortages on Prices and Activity
To quantify the macroeconomic implications of movements in the shortage index, we estimate a three-variable statistical model comprising the shortage index, world GDP, and world inflation.3 The sample has a quarterly frequency and runs from 1960 to 2025, reflecting the availability of consistent quarterly world GDP and inflation data. The model identifies demand, supply, and shortage shocks by imposing restrictions on their joint economic effects and the slopes of the economy-wide demand and supply curves: Positive demand shocks raise both GDP and inflation, whereas adverse supply shocks lower GDP and raise inflation. Both demand and supply shocks can move the shortage index.4 In addition, we recover a separate "shortage shock" that explains movements in the shortage index that are not accounted for by demand and supply shocks.5
Figure 3 shows the macroeconomic effects associated with a shortage shock of the size estimated to have occurred since the start of the conflict. The shortage index remains above the no-shock baseline for several years, reflecting how historical episodes of heightened media coverage of shortages tended to be long lasting. Given the estimated historical relationships, in response to this shock, the model projects that global growth should decline, with world GDP growth declining 0.4 percentage points after one year, and a cumulative decline of the level of GDP of 0.8 percent after three years. The shock also lifts global inflation, with the predicted rise in world headline prices cumulating to 0.2 percent after one year and 1 percent after three years.6
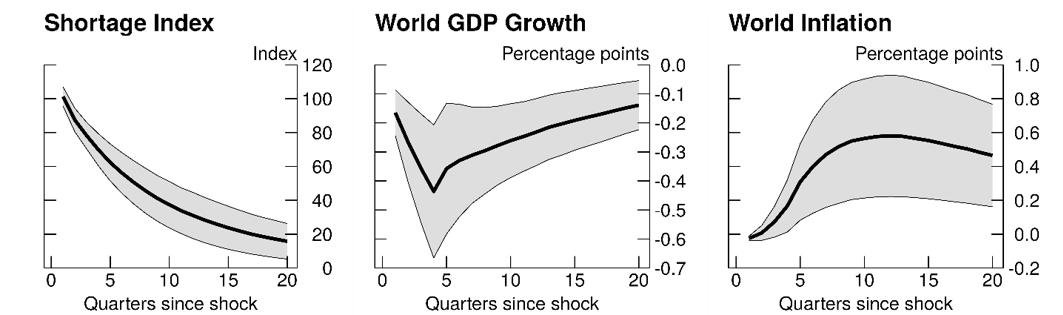
Note: Impulse responses to a shortage shock sized to the average increase in the shortage index from March to May 2026. The y-axis reports variables in deviations from their unshocked path. World GDP growth and world inflation are measured in four-quarter percent changes. Shaded areas denote 80 percent confidence intervals.
Source: FRB staff estimates based on Dario Caldara, Matteo Iacoviello, and David Yu (2025).
Our analysis finds that, historically, periods with elevated media coverage of shortages tend to coincide with episodes of large economic disruptions, triggered by events such as geopolitical conflicts, natural disasters, large production failures, and surges in demand that are associated with temporary capacity constraints. During these events, the slow adjustment of prices and wages likely caused shortages to persist and quantities to decline relative to the no-shortage counterfactual. The immediate reduction in activity, coupled with a slow and persistent rise in prices, distinguishes shortage shocks from standard supply shocks in the economic literature, which are associated with a larger and faster response of prices for a given decline in activity.
Shortages have historically been persistent, and our estimates inherit that persistence. If current shortages prove similarly long-lasting, the hit to global activity could be considerable and the rise in global inflation prolonged. One caveat is that past episodes need not be a good guide at the current juncture: the disruptions tied to the conflict could fade faster than the historical record suggests.
Bibliography
Gianluca Benigno, Julian di Giovanni, Jan J. J. Groen, and Adam I. Noble (2022), "The GSCPI: A New Barometer of Global Supply Chain Pressures," Staff Reports 1017 (Federal Reserve Bank of New York)
Dario Caldara, Matteo Iacoviello, and David Yu (2025), "Measuring Shortages since 1900," International Finance Discussion Paper 1407 (Washington: Board of Governors of the Federal Reserve System, May).
1. We first identify articles that discuss shortages by searching for terms such as "shortage," "scarcity," "bottleneck," or "rationing," in conjunction with sector-specific terms. We then calculate the index as the monthly share of articles discussing shortages, rescaled to equal 100, on average, over the 1900–2019 period. Return to text
2. Other measures capturing supply chain pressures have also risen in response to these developments, including the New York Fed's GSCPI, a monthly indicator that gauges global supply chain conditions based on transportation cost data and manufacturing indicators. Our indicator and the GSCPI have a correlation of 0.72 over the sample period during which they overlap. Both indicators have spiked since the beginning of the conflict. Return to text
3. World GDP and inflation are constructed by aggregating data for GDP and total inflation from Haver Analytics covering a sample of 37 economies, using GDP weights at purchasing power parity (PPP). The sample includes: Australia, Austria, Belgium, Canada, Chile, China, Denmark, Finland, France, Germany, Hong Kong, India, Indonesia, Ireland, Israel, Italy, Japan, Korea, Malaysia, Mexico, Netherlands, New Zealand, Norway, Philippines, Poland, Portugal, Russia, Singapore, South Africa, Spain, Sweden, Switzerland, Taiwan, Thailand, Turkey, United Kingdom, and United States. To account for poor data quality or periods of triple-digit inflation, data series for certain economies begin later in the sample period. If either GDP or inflation data for a given economy are unavailable in a specific quarter, its weight in the global aggregate for that quarter is set to zero (and the other weights rescaled accordingly). Return to text
4. Specifically, we estimate a Bayesian vector autoregression (VAR) model with sign and zero restrictions from 1960:Q1 through 2025:Q4. World GDP and world consumer price index inflation are constructed using national series for 39 of the largest world economies, aggregated using GDP at purchasing power parity. For an overview of the methodology, see Dario Caldara, Matteo Iacoviello, and David Yu (2025). The results are robust to the inclusion in the VAR of oil or commodity prices. Results are also qualitatively similar when considering a narrower measure of shortages that only includes the energy component. Return to text
5. Mechanically, the shortage shock is identified as the innovation in the shortage equation after controlling for the shortage index's normal responses to supply and demand shocks. Once isolated, the shock feeds into the aggregate demand equation through a shortage "wedge," creating a gap between desired demand and realized GDP. While the shock can affect inflation on impact through the system's dynamics, its main inflationary buildup is assumed to operate with a lag through the aggregate supply equation, allowing it to initially constrain economic activity while the price adjustment unfolds over time. Return to text
6. The results for a statistical model that replaces world GDP and world inflation with U.S. GDP and U.S. inflation are quantitatively similar. The rationale for this similarity is that most shocks in the shortage index reflect global events that historically affected the U.S. and foreign economies. In addition, U.S. GDP and inflation are highly correlated with their foreign counterparts. That said, it is plausible that in the current juncture, foreign economies may be relatively more exposed than the U.S. economy to the current shock, given the lower dependency of the U.S. economy on energy and other imports from the Middle East. Return to text
Caldara, Dario, and Matteo Iacoviello (2026). "A News-Based Approach to Measuring Shortages and Their Effects on the Global Economy," FEDS Notes. Washington: Board of Governors of the Federal Reserve System, June 26, 2026, https://doi.org/10.17016/2380-7172.4112.
Disclaimer: FEDS Notes are articles in which Board staff offer their own views and present analysis on a range of topics in economics and finance. These articles are shorter and less technically oriented than FEDS Working Papers and IFDP papers.