FEDS Notes
August 05, 2025
An Assessment of China's Innovative Capacity
Sina T. Ates and Sharon Jeon
Over the past two decades, China has become a manufacturing powerhouse while quadrupling its per capita output and significantly closing the large per capita income gap with developed economies, with China's per capita income now about 20 percent of U.S. per capita income, compared to just over 5 percent in 2004 (Figure 1a). However, China's economic growth has been declining in recent years. While some of this slowing represents the natural process of convergence towards developed economies with potential gains from catch-up dynamics diminishing, there are important areas of concern – returns from capital-intensive investment running its course, export-led growth reaching its limits, a nearing demographic cliff, and self-inflicted domestic problems that have led to turmoil in the property sector and depressed consumer demand. Indeed, total factor productivity has been more or less stagnant over the past decade or so (Figure 1b).1 Overcoming this challenge is vital for China, which is still a developing economy, as future growth performance will increasingly depend on productivity gains and innovation, with the traditional engines of growth tapping out.2
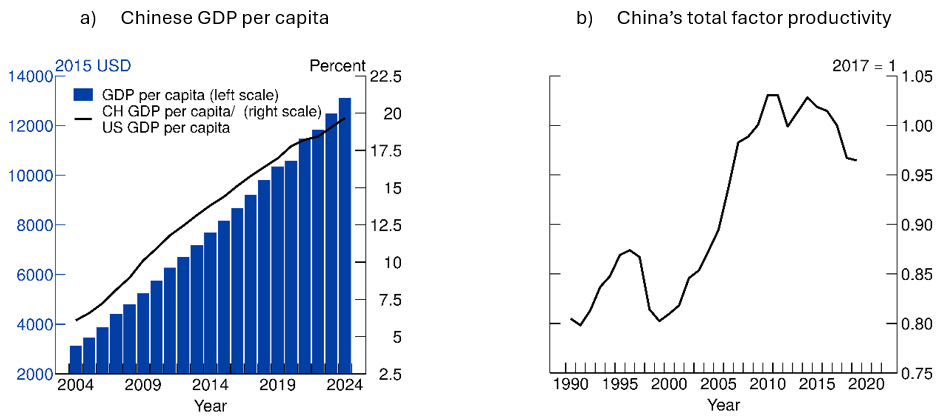
Note: In figure (b), data is in constant national prices.
Source: Figure (a) - WDI via Haver Analytics; figure (b) - Penn World Tables.
Against this backdrop, this note examines the scientific and innovative achievements of China to date to shed light on its growth prospects. Tapping various data sources on research and development (R&D) expenditures and innovation, we document that the ascent of China from low-income to a middle-income economy has been accompanied by a rapid development of innovative capabilities—as evident in its significant growth in technology intensive sectors such as electrical vehicles—which makes China one of the global innovation powerhouses today. The pace of innovative development surpasses even the past achievements of developing countries that successfully ascended to high-income levels, such as South Korea.
In documenting China's progress in its innovative capacity, we start by noting that that China has been steadily increasing its expenditure on R&D as a share of GDP, closing the gap with the U.S. (Figure 2a).3 That said, the expenditure on basic research as a share of GDP, while increasing, is still considerably lower than in the U.S. and South Korea (Figure 2b).4 These data imply that most resources are spent on rather applied areas and in development phases, while the amount that goes into more fundamental scientific research and discoveries still pales relatively. This observation is consistent with recent anecdotal evidence from medical sciences—a priority focus of the "Made in China 2025" initiative—manifest in the challenges China encountered in its quest to develop latest-technology mRNA vaccines during the COVID period.
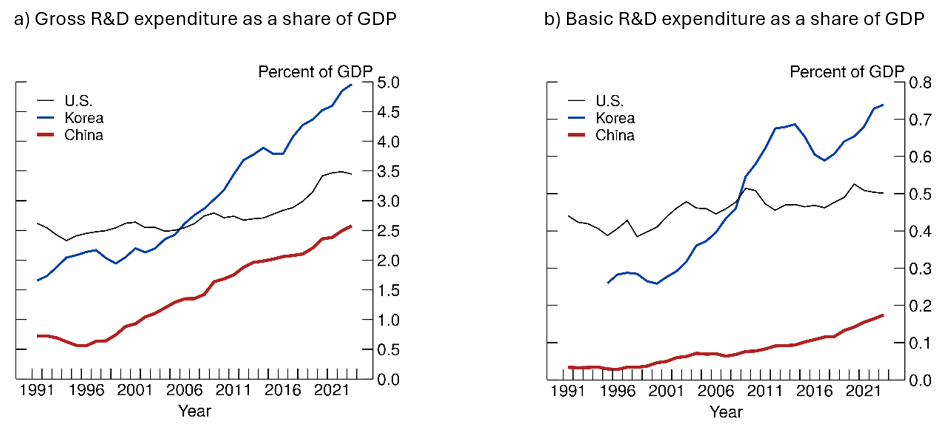
Note: In figure (b), data only available after 1995 for Korea.
Source: Figure (a) and figure (b) - OECD, Main Science and Technology Indicators.
Next, we turn to the main output of R&D investment—patents, which register and protect the inventions. Over the years, China has become increasingly competitive in terms of patent generation. The rate of patent generation, measured as patent grants per million population, has even surpassed the U.S. by the end of the past decade (Figure 3a). That said, these values reflect raw counts, yet patents vary greatly in terms of their scientific content and impact.5 For instance, restricting the sample of patents on IP5 patents—patents that are registered not just in the country of the inventor but also in one of the five major patent offices (the EU, the U.S., China, Japan, and South Korea)—reveals that China's rate of generating internationally-recognized patents per capita still pales relative to the U.S. and South Korea despite steady improvements (Figure 3b).6 Similarly, in another metric of scientific progress, academic publications in science and engineering fields, China has exhibited a dramatic improvement, taking over the U.S. about a decade ago, as shown in Figure 3c (National Science Board, 2024b). But an index of highly-cited articles—a quality-adjusted measure of scientific publications—demonstrates that, while still exhibiting an impressive improvement, the share of Chinese publications among the top one percent is still lower than that of the U.S. (Figure 3d).
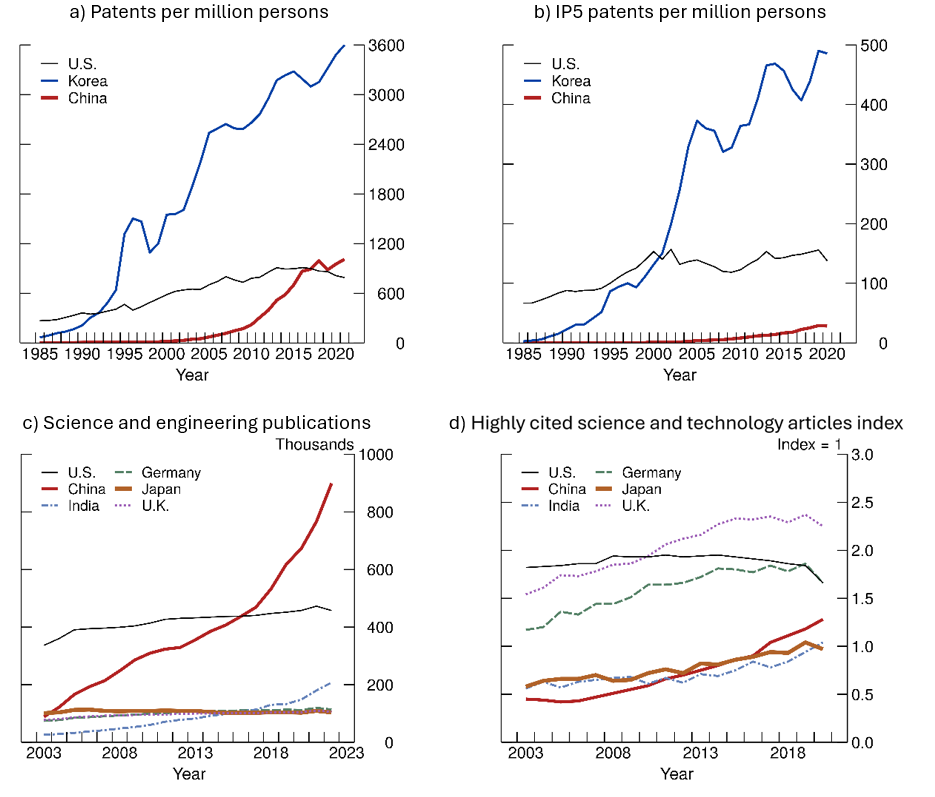
Note: In figure (a), data are domestic patents registered by residents. In figure (c), scientific articles are fractionally counted and classified by author's institutional address. In figure (d), the highly cited article index is a country's share of the top 1 percent most-cited science and engineering publications divided by the country's share of all science and engineering publications.
Source: figure (a) – OECD, Patents by Technology; figure (b) – OECD, WDI; figure (c) and figure (d) – National Science Foundation.
While China's innovative output may be lagging major developed countries in per capita terms by some metrics, its sheer scale still matters when it comes to being a hub for scientific endeavor and innovation. Examining the share of countries in generating IP5 patents globally shows a rapid rise in China's share: China had almost caught up by 2020 with the U.S., the global leader (Figure 4a). Looking into the major technology fields, it is evident that China has become a major hub of inventions even in latest technologies such as artificial intelligence (AI) (Figure 4b). Indeed, by raw counts, the number of AI-related patents [registered in China] has been five times the number in the U.S. (NSB, 2024). That said, the U.S. still maintains a notable lead in medical sciences and biotechnology (Figures 4c and 4d).
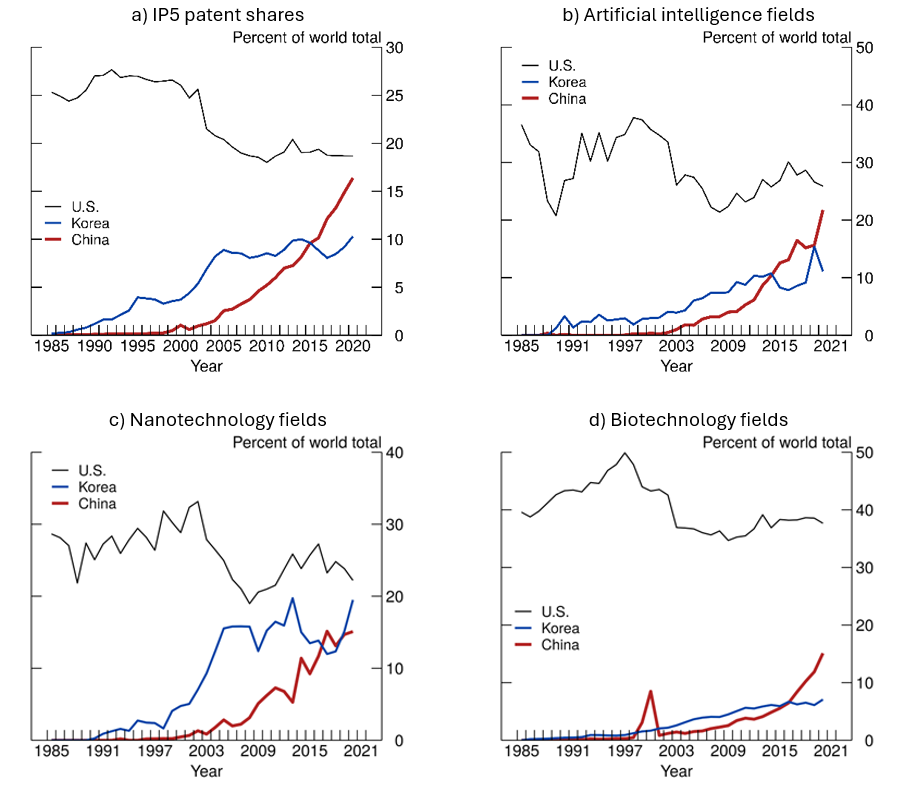
Source: figure (a), figure (b), figure (c), figure (d) - OECD, Patents by Technology.
We can glean further information on Chinese patenting activity and its penetration to the U.S. technology market by leveraging the detailed USPTO data on patents that are registered in the U.S. These data enable us to calculate the share of patents from China registered in the U.S., examine the composition of technology fields in which they create an invention and compare them with similar U.S. patents, while providing a more direct metric for the measurement of patent quality through pairwise citations.7 To start, Figure 5 depicts the composition of technology fields of patents registered by Chinese entities in the U.S. between 2005 and 2018. The figure reveals that most Chinese patents registered in the U.S. innovate in the field of electricity (shown in orange) and physics (shown in purple)—a pattern that is common to the patents of many Asian countries in the USPTO data.8,9 China has been steadily increasing its share in these fields among all (domestic and foreign) patents registered in the U.S, now occupying about 10 percent in each field. These gains have occurred mostly at the expense of Japan's and Germany's shares, while the shares of patents by the U.S.-based entities have also picked up over the 2010s.
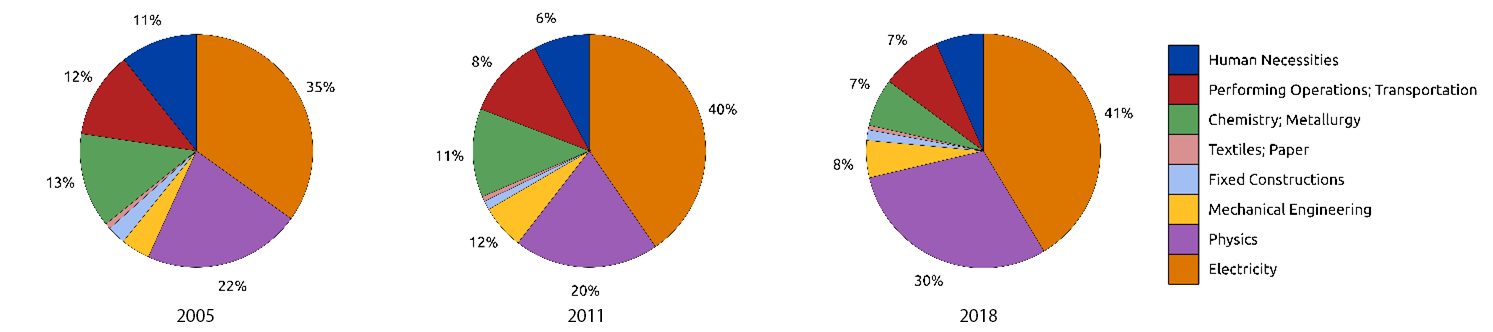
Note: Legend entries appear in counterclockwise chart order.
Source: USPTO PatentsView.
Turning to quality-based measures, we compare patents based on the count of forward citations they receive from subsequent patents registered in the USPTO. To gauge how Chinese patterns' quality relative to other patents in the USPTO data evolved over time, we look at the share of Chinese patents among the top group of patents by citation count over the years. Specifically, we consider successive cohorts of patents granted every year and compute the share of Chinese patents in the top decile of patents in each cohort.10 The black line in Figure 6 shows that this share has been trending up starting in the second half of the last decade. The blue line displays a similar trend at a notably larger level when the sample is restricted to foreign patents.11 In addition, we also observe that the average number of citations top Chinese patents receive has also been improving relative to best patents registered by inventors from the U.S. or other major frontier countries. These results support the idea that China has not only been increasing its innovative output but also its quality, significantly improving its competency as a technology frontier.
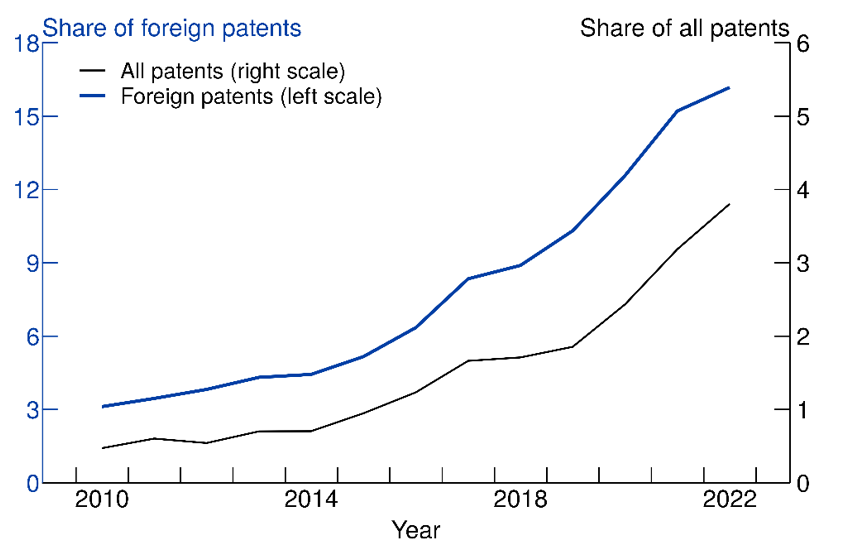
Note: Patents are in the top decile of USPTO patents by forward citation count.
Source: USPTO PatentsView.
The data reveal that China has already established tremendous innovative capacity that can compete with the countries at the technology frontier. But taking a more historical perspective and comparing China's achievements with the experiences of other developing countries that have successfully grown into the league of developed economies could shed more light on its growth prospects. To do so, we will take as our reference case South Korea, the poster child of an economy reaching high-income status through multi-decade long sustained growth via export-oriented industrial development. To compare China and South Korea at a similar stage of economic development, we will consider South Korea's performance in the mid-1980s, when its GDP per capita relative to the U.S. was similar to China's by the end of the 2010s. Figure 7 shows the relative performance of the two countries in various metrics, with a value larger than one indicating that China fares better than South Korea at the similar stage of development. China's total spending on R&D as a share of its GDP (the black bar in the left panel) is higher than South Korea, but this is not the case for basic research spending (the red bar).12 In terms of research output, as measured by patents, shown on the right, China's performance is an order of magnitude ahead of South Korea. These observations again point to the significant achievements of China, which, for its stage of economic development, are considerably better by the metrics used here than even the performance of one of the most successful developing countries in recent history. As such, they suggest a notable potential for China to transition to an innovation-based economic system and generate sustained economic growth through persistent productivity gains.
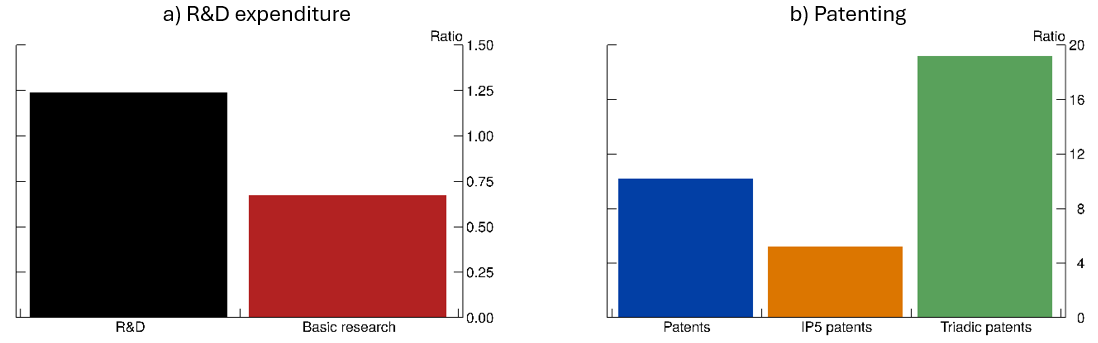
Note: In figure (a), measures are ratios calculated by dividing 2023 Chinese research expenditures (% of GDP) to 1995 Korean research expenditures (% of GDP). In figure (b), measures are ratios calculated by dividing the 2017-2019 average Chinese patents (per million population) with 1985-1987 average Korean patents (per million population).
Source: figure (a) – OECD, Main Science and Technology Indicators; figure (b) – OECD, Patents by Technology; WDI.
The particular metrics highlighted in this note suggest that China has built tremendous innovative capacity that bodes well for a prospective transformation into an innovation-based economy. That said, such an outcome is not assured as the myriad of policies Chinese policy makers have been adopting over the years to promote industrial production and research has also created considerable distortions in the economy, the downsides of which are not discussed in this note. A vibrant and sustainable innovation ecosystem necessitates the combination of various factors, which may not all be present at the current juncture in China and thus may compromise further expansion of innovative capacity and the transformation of the Chinese economy.
References
Akcigit, U., Ates, S. T., Lerner, J., Townsend, R., Zhestkova, Y. (2024). "Fencing off Silicon Valley: Cross-border venture capital and technology spillovers," Journal of Monetary Economics, 141, pp. 14-39
Boeing, P., L. Brandt, R. Dai, K. Lim, B. Peters (2025). "The Anatomy of Chinese Innovation: Insights on Patent Quality and Ownership," ZEW - Centre for European Economic Research Discussion Paper No. 24-016
Brandt, L., G. Kambourov and K. Storesletten (2024). "Barriers to Entry and Regional Economic Growth in China," Review of Economic Studies, forthcoming
Brandt, L., J. Van Biesebroeck, L. Wang, and Y. Zhang (2023). "Where Has All the Dynamism Gone? Productivity Growth in China's Manufacturing Sector, 1998-2013," CEPR Discussion Paper No. 18488
Feenstra, Robert C., Robert Inklaar and Marcel P. Timmer (2015). "The Next Generation of the Penn World Table (PDF)," American Economic Review, 105(10), 3150-3182.
Hall, B. H., A. B. Jaffe, and M. Trajtenberg (2001). "The NBER Patent Citation Data File: Lessons, Insights and Methodological Tools," NBER Working Paper 8498
König, M., Storesletten, K., Song, Z. and Zilibotti, F. (2022). "From Imitation to Innovation: Where Is All That Chinese R&D Going?" Econometrica, 90, pp. 1615-1654
Krugman, Paul. (2024), "Stagnation with Chinese Characteristics," https://paulkrugman.substack.com/p/stagnation-with-chinese-characteristics.
Kun J., Wolfgang K., Larry D. Q., William R. (2024). "International Joint Ventures and Internal vs. External Technology Transfer: Evidence from China," Journal of International Economics, 150, 103939
National Science Board, National Science Foundation. (2024). Invention, Knowledge Transfer, and Innovation. Science and Engineering Indicators 2024. NSB-2024-1. Alexandria, VA.
National Science Board, National Science Foundation. (2024). Science and Engineering Indicators 2024: The State of U.S. Science and Engineering. NSB-2024-3. Alexandria, VA.
World Bank. 2024. World Development Report 2024: The Middle-Income Trap. World Bank.
1. Burgeoning research is investigating various aspects of these dynamics. Brandt et al. (2024) document important productivity gains back to the 1990s, when the downsizing of state-owned enterprises (SOEs) helped reduce entry barriers and unleashed the proliferation of small private firms. That said, Brandt et al. (2023) highlight a conspicuous slowdown in the dynamism and productivity growth of the Chinese manufacturing sector around 2010. Konig et al. (2022) argue that there is notable misallocation of R&D resources in China. Recent papers document that knowledge spillovers from foreign technologies and FDI have also helped China build its own innovative abilities (Kun et al., 2024). Akcigit et al. (2024) document that Chinese firms also invest in companies overseas to learn from technologies, and the benefits seem to be larger in sectors that rely on more fundamental research and technologies. Return to text
2. Krugman (2024) claims that China is falling to the middle-income trap, which the World Bank (2024) defines as "a situation in which a middle-income country experiences systematic growth slowdowns as it is unable to take on the new economic structures needed to sustain high-income levels." Return to text
3. For context, we present most results in comparison to the U.S., a technologically frontier country, and South Korea, which is generally regarded as the poster child of a developing economy breaking into a high-income level via decades-long sustained economic growth. Return to text
4. Basic research refers to the systematic study of a subject to gain a more comprehensive knowledge or understanding of it without specific applications in mind—e.g., research in human genome. Return to text
5. Brandt et al. (2025) claim that the innovative content and the impact on subsequent innovation of the average patent produced in China has been declining but also acknowledge that patents related to technology fields such as chemistry and electricity—which are likely to be more sophisticated technologies—prove to be exceptions. Return to text
6. These patents are referred as IP5 patent families. They are registered in major global patent offices, which lends credibility to their scientific content, alleviating concerns about quality. Similar observations hold with triadic patent families. However, restricting the sample to such patents may cause an understatement of true Chinese scientific output. For instance, following a surge at the start of the decade, the number of AI-related patents in China reached four times the U.S. level in 2022 (National Science Board, 2024a). Such rapid explosion of AI-related patents would certainly raise eyebrows as to the genuine scientific value. But even one assumes that as much as 75 percent of these patents lack viability, the magnitudes would be at par with other major countries. Latest progress of the Chinese company Deepseek in reasoning language models indeed corroborates this conjecture. Return to text
7. The more references a patent receives from subsequent patents, the more technological impact it creates in general (Hall et al., 2001). Return to text
8. The broad class of physics covers patent that invent in areas such as optics, computing, signaling, and information and communication technologies. Return to text
9. By contrast, patents from developed economies such as the U.S. itself and Germany exhibit a more balanced composition across technology fields. Return to text
10. The baseline calculation defines the cohorts by grant year. An exercise based on the application year yields consistent results. Return to text
11. The foreign sample includes patents registered by assignees from Canada, France, Germany, Japan, South Korea, Taiwan, and the U.K. in the U.S., as these countries register historically most of the foreign patents in the USPTO, providing a benchmark of the non-US technology frontier for comparison. Return to text
12. The year of comparison in panel A of Figure 7 is determined by the availability of the historical data. Return to text
Ates, Sina T., and Sharon Jeon (2025). "An Assessment of China's Innovative Capacity," FEDS Notes. Washington: Board of Governors of the Federal Reserve System, August 5, 2025, https://doi.org/10.17016/2380-7172.3819.
Disclaimer: FEDS Notes are articles in which Board staff offer their own views and present analysis on a range of topics in economics and finance. These articles are shorter and less technically oriented than FEDS Working Papers and IFDP papers.