FEDS Notes
January 07, 2026
Assessing Recession Risks with State-Level Data1
Hie Joo Ahn2, Yunjong Eo3, and Lucas Moyon
This note evaluates recession risks at the national and state levels using a state-of-the-art Bayesian Markov-switching model that distinguishes between full-recovery recessions (U-shaped recessions) and those that generate lasting damage, or hysteresis (L-shaped recessions). While states exhibit considerable heterogeneity in their business-cycle experiences, most saw some degree of hysteresis in the past recessions that occurred prior to the COVID pandemic. By contrast, the model classifies the pandemic-induced recession as a full-recovery episode with a low likelihood of hysteresis, reflecting the rapid rebound from the sharp downturn. The model suggests that the risk of a national recession has been low of late, though the state-level data reveal pockets of risk.
The U.S. economy has seen large cyclical swings over the past five years. In 2020, the COVID-19 pandemic brought economic activity to an abrupt halt, but a combination of fiscal stimulus, expansionary monetary policy, and the vaccine rollout supported a swift recovery (e.g., Fleming et al., 2020; Milstein and Wessel, 2024; Romer, 2021). But was there lasting damage to the economy? Are we now at risk of another recession?
Recent research by Ahn and Eo (2025) can help answer these questions.4 Ahn and Eo examine hysteresis risks at both the aggregate and regional levels by estimating a state-of-the-art Bayesian Markov-switching model using national- and state-level nonfarm payroll employment data. The model classifies the business cycle into one of three phases—expansion, U‑shaped recession, and L-shaped recession—and estimates, for each point in time, the probability that each U.S. state is in one of these phases.5 In doing so, the model accounts for secular changes in aggregate and state-level employment growth that reflect long-run structural shifts in regional labor markets, while also appropriately adjusting for the unprecedented swings in the data seen during the pandemic and subsequent recovery.6
Figure 1 gives a stylized example of the three business-cycle phases we measure. The economy is in expansion when employment growth is at or above its long-run rate, and in recession when employment growth is negative for a sustained period. Recessions are further distinguished by two recovery patterns. In a U-shaped recession, employment eventually returns to the path it would have followed absent the recession (dashed blue line). In contrast, an L-shaped recession permanently lowers the level of employment, and the subsequent expansion does not restore employment to its pre-recession trajectory (solid blue line). This L-shaped recovery is referred to as hysteresis, a phenomenon in which recessionary shocks have permanent or long-lasting effects on economic activity. Hysteresis can occur following a negative demand shock if firms sharply reduce employment and productive capacity, in turn generating persistent adverse effects on the economy's productive potential (partly by destroying job-specific human capital and weakening workers' attachment to the labor market—see Blanchard, 2018).
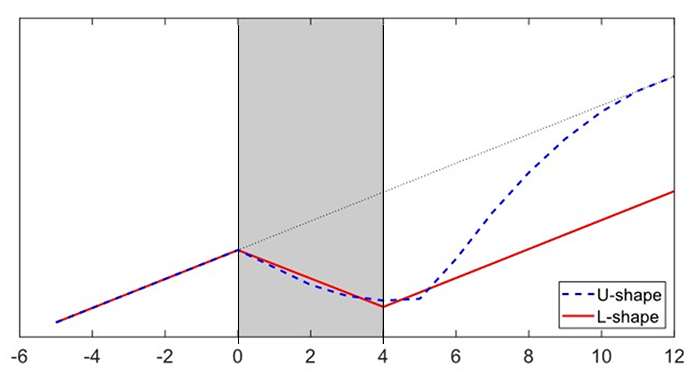
Note: The X-axis denotes periods after a business cycle peak. The black dotted line indicates the hypothetical output level if a recession had not occurred; the shaded area represents periods in which the economy is in a recession. The periods prior to the recession correspond to expansionary phases.
Source: Authors’ calculation.
In this note, we extend Ahn and Eo (2025)'s estimates using data from 1960:Q1 to 2025:Q4 and assess both the risk of hysteresis stemming from the COVID-19 recession and national and regional recession probabilities in recent years.7
Figure 2 displays the probabilities of U-shaped and L-shaped recessions estimated using national-level payroll employment growth (Panel A) and real GDP growth (Panel B).8 The recession probabilities closely align with the NBER recession dates. In addition, using payroll employment yields higher probabilities of L-shaped recessions, suggesting that hysteresis effects are stronger in the labor market than in aggregate output.9 A prominent example is the Great Recession: The employment-based estimate classifies this period as an L‑shaped recession, but the GDP-based estimate classifies it as a U-shaped recession with a prolonged recovery.10
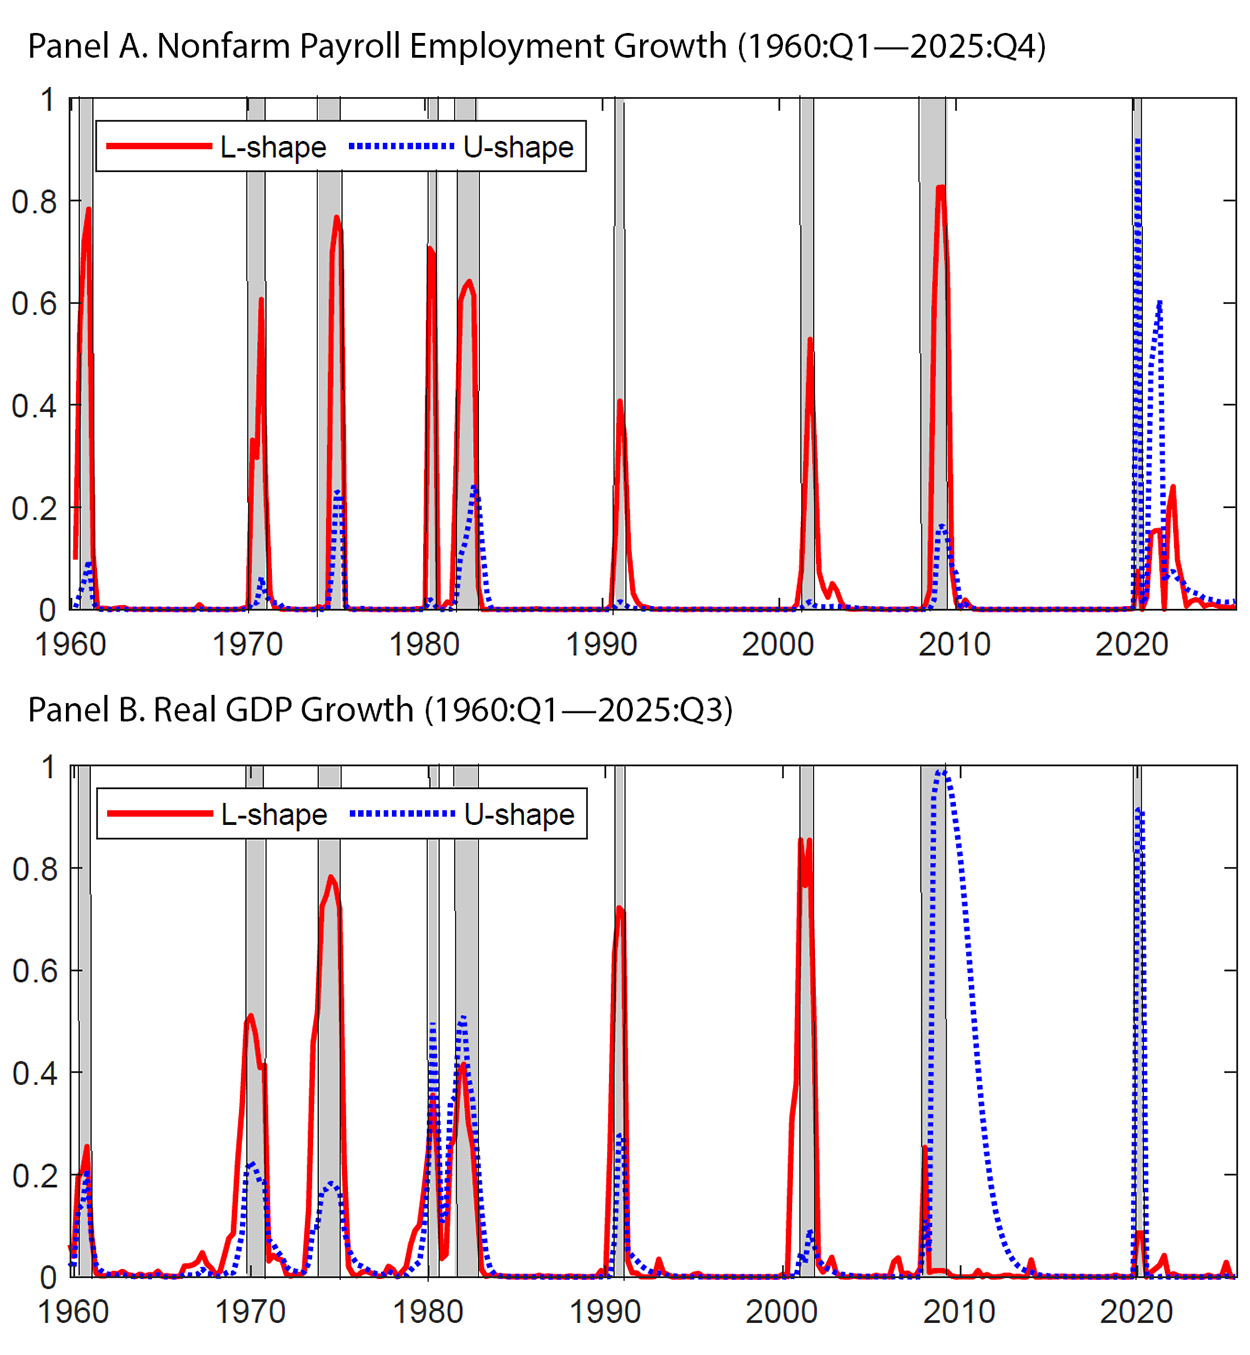
Note: The figures display the probabilities of L-shaped and U-shaped recessions at the national level, estimated using nonfarm payroll employment growth (Panel A) and real GDP growth (Panel B). For 2025:Q4, nonfarm payroll employment growth is computed as the average of October and November, as December data are unavailable at the time of writing. The blue dashed lines represent the probability of a U-shaped recession, while the red solid lines represent the probability of an L-shaped recession. The y‑axis indicates the probability, and the x-axis indicates the date. The shaded bars indicate U.S. recessions as dated by the National Bureau of Economic Research: April 1960–February 1961, December 1969–November 1970, November 1973–March 1975, January 1980–July 1980, July 1981–November 1982, July 1990–March 1991, March 2001–November 2001, December 2007–June 2009, and February 2020–April 2020.
Source: Authors' calculation.
State-level payroll employment data reveal rich heterogeneity in regional business cycles that is not apparent in national aggregates. Figure 3 presents heatmaps of recession probabilities for the two types of recessions (U-shaped in Panel A and L-shaped in Panel B). Although all the states generally experienced economic downturns at similar times—across states, the elevated recession probabilities line up with NBER recessions—the magnitudes of these recessions varied considerably across states. Some states also experienced idiosyncratic downturns not observed in other areas. For example, Louisiana faced a recession with both U-shaped and L‑shaped characteristics in 2005 after Hurricane Katrina, and North Dakota underwent an L‑shaped recession in 2015 following the boom and subsequent bust in shale oil production.
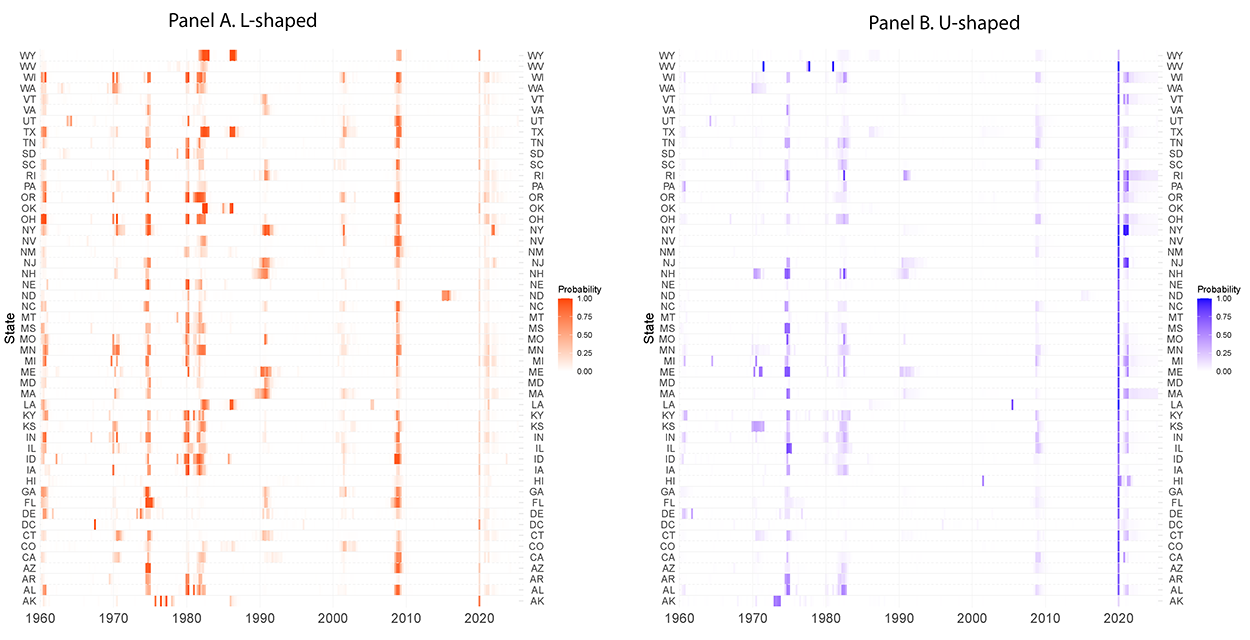
Note: The figures show the probability that states experience L-shaped recessions (Panel A) and U-shaped recessions (Panel B), estimated using state-level nonfarm payroll employment data. As of the time of writing, state-level nonfarm payroll employment growth is available through August; for 2025:Q3, we use the average of July and August. States are shown on the y-axis, and the x-axis is calendar time. Darker colors in each heat map indicate higher recession probabilities.
Source: Authors' calculation.
It is notable that, across states, U-shaped recessions became less common after the 1990s (Panel B of Figure 3), making L-shaped recoveries the dominant feature of recessions during this period. This pattern reflects pervasive jobless recoveries and varying degrees of hysteresis in regional labor markets.
Focusing on the pandemic recession and recovery (2020‑onward), the model classifies the recession as U-shaped in the aggregate as well as across states, consistent with the swift rebound that followed (Figures 2 and 3). Nonetheless, some states—such as New York and New Jersey—exhibit somewhat elevated probabilities of an L-shaped recession, suggesting lasting damage.11
In recent years (2023–2025), the likelihood that the U.S. economy is in a recession has remained low, with state-level recession probabilities ranging from zero to 10 percent. While most states' probabilities are close to zero, Massachusetts and Rhode Island exhibit U-shaped recession probabilities near 10 percent, which are low but not negligible. Consistent with this pattern, evidence from the Federal Reserve's August 2025 Beige Book indicates that the New England economy is faring worse than the national economy, and the November 2025 Beige Book indicates that the level of employment in that region had edged lower due to weakened demand (but without major layoffs).12 Thus, while the U.S. economy is unlikely to have entered a recession, the state-level data point to pockets of risk.13
Although the Bayesian Markov-switching model is effective for interpreting history, predicting a recession in advance still remains as a challenging task and is an ongoing research topic among economists.14
According to previous research, measures such as initial unemployment claims, layoffs, the slope of yield curve, and the credit spread carry signals about future recessions (e.g., Berge, 2015).15 These measures, as shown in Figure 4, generally do not indicate an elevated risk of economic recession in the near future: Initial claims and layoff indicators remain low (Panel A), and financial market measures—reflected in the positive slope of the yield curve (the treasury spread) and low credit spreads—suggest that recession risks are low by historical standards (Panel B).16 Similarly, heuristic or model-based indicators—including the Sahm Rule, the rule proposed by Michaillat and Saez (2025), the Cleveland Fed's sentiment-based model, and the San Francisco Fed's Labor Market Stress Indicator—all signal a low probability of an imminent recession.17
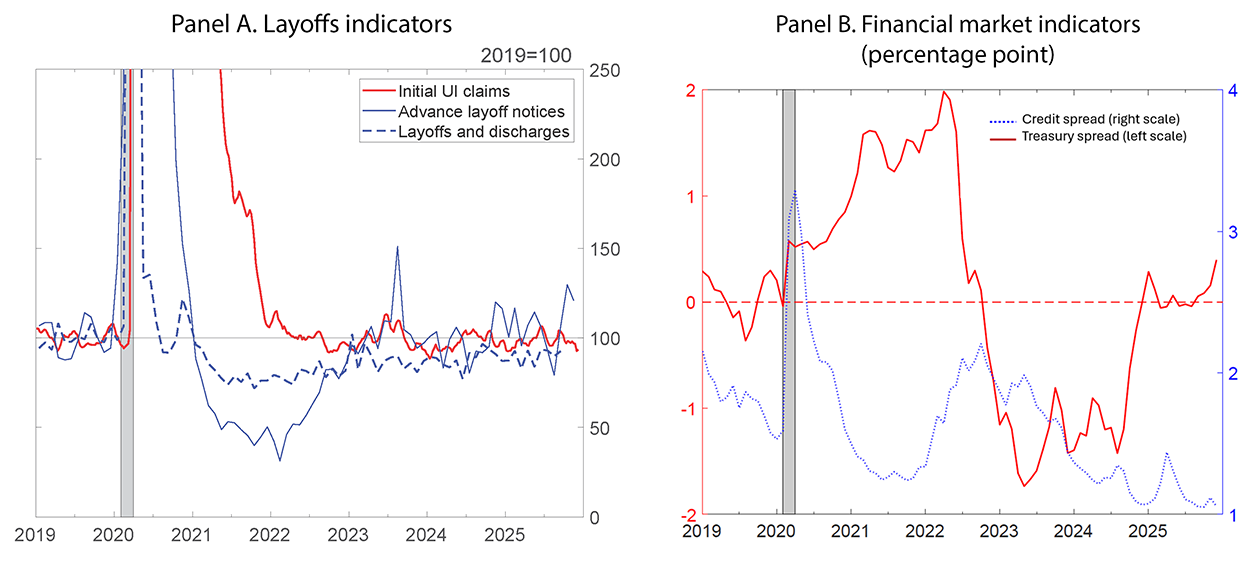
Note: In panel A, initial UI claims are reported as a 4-week moving average. The y-axis is truncated at 250 to prevent pandemic-era observations from muting recent variation. In panel B, The Treasury spread is defined as the difference between the 10-year and 3-month Treasury yields. The credit spread is the difference between yields on BBB corporate bonds and 10-year Treasuries. Shaded areas spanning February – April 2020 denote the NBER recession. Units are in percentage points.
Source: Authors' calculation; ICE Data Indices LLC, used with permission; Federal Reserve Board of Governors; U.S. Bureau of Labor Statistics; U.S. Department of Labor.
Overall, macroeconomic data and a range of recession-prediction methods indicate that the risk of a national recession remains low. However, given pockets of recession risk in some regions and uncertainty surrounding the U.S. economy's current cyclical position, it remains important to closely monitor economic conditions across different parts of the economy.
References
Abraham, Katharine G., John Haltiwanger, Kristin Sandusky, and James R. Spletzer (2013). "Exploring Differences in Employment between Household and Establishment Data." Journal of Labor Economics, vol. 31 (April), S129–S172.
Ahn, Hie Joo and Yunjong Eo (2025). "Hysteresis and the Role of Downward Nominal Wage Rigidity: Evidence from U.S. States," Finance and Economics Discussion Series 2025-062, Board of Governors of the Federal Reserve System, Washington, D.C.
Antolin-Diaz, Juan and Paolo Surico (2025). "The Long-Run Effects of Government Spending," American Economic Review, vol. 115 (July), pp. 2376–2413.
Bauer, Lauren, Kristen E. Broady, Wendy Edelberg, and Jimmy O'Donnell (2020). "Ten Facts about COVID-19 and the U.S. Economy." The Hamilton Project, Brookings Institution, Washington, DC.
Berge, Travis J. (2015). "Predicting Recessions with Leading Indicators: Model Averaging and Selection over the Business Cycle." Journal of Forecasting, vol. 34, pp. 455–471, https://doi.org/10.1002/for.2345.
Berge, Travis J., and Damjan Pfajfar (forthcoming). "The Shape of the Business Cycle: The View from U.S. States." Oxford Bulletin of Economics and Statistics.
Bewley, Truman F. (1999). Why Wages Don't Fall During a Recession. Cambridge, MA: Harvard University Press.
Blanchard, Olivier (2018). "Should We Reject the Natural Rate Hypothesis?," Journal of Economic Perspectives, American Economic Association, vol. 32(1), pp. 97–120, Winter.
Board of Governors of the Federal Reserve System (2025a). The Beige Book, August 2025. Washington, D.C.: Board of Governors.
Board of Governors of the Federal Reserve System (2025b). The Beige Book, November 2025. Washington, D.C.: Board of Governors.
Cerra, Valerie, Antonio Fatas, and Sweta C. Saxena (2023). "Hysteresis and Business Cycles," Journal of Economic Literature, vol. 61 (March), pp. 181–225.
Dupraz, Stéphane Dupraz, Emi Nakamura, and Jón Steinsson (2025). "A plucking model of business cycles," Journal of Monetary Economics, vol. 152 (June).
Eo, Yunjong, and James Morley (2022). "Why Has the U.S. Economy Stagnated since the Great Recession?" Review of Economics and Statistics, 104 (March), pp. 246–258.
Eo, Yunjong, and James Morley (2023). "Does the Survey of Professional Forecasters Help Predict the Shape of Recessions in Real Time?" CAMA Working Paper 24/2023 (May), http://dx.doi.org/10.2139/ssrn.4451874.
Fleming, Michael, Asani Sarkar, and Peter Van Tassel (2020). "The COVID-19 pandemic and the Fed's response," Federal Reserve Bank of New York, Liberty Street Economics, April.
Francis, Neville, Laura E. Jackson, and Michael T. Owyang (2018). "Countercyclical Policy and the Speed of Recovery after Recessions." Journal of Money, Credit and Banking, vol. 50 (April), pp. 675–704.
Fukui, Masao, Emi Nakamura, and Jón Steinsson (2023). "Women, Wealth Effects, and Slow Recoveries," American Economic Journal: Macroeconomics, vol. 15 (January), pp. 269-313.
Furlanetto, Francesco, Antoine Lepetit, Ørjan Robstad, Juan Rubio-Ramírez, and Pål Ulvedal (2025). "Estimating Hysteresis Effects." American Economic Journal: Macroeconomics, vol. 17 (January), pp. 35–70.
Garciga, Christian, and James Mitchell (2025). "Forecasting U.S. Recessions in Real Time Using Regional Economic Sentiment." Economic Commentary, No. 2025-13. Cleveland: Federal Reserve Bank of Cleveland, November.
Garimella, Rohit, Òscar Jordà, and Sanjay R. Singh (2025). "Tracking Labor Market Stress." FRBSF Economic Letter, 2025-19. San Francisco: Federal Reserve Bank of San Francisco, August.
Hall, Nick, and Osborne Jackson (2025). "New England Economic Conditions through November 18, 2025." New England Economic Conditions. Boston: Federal Reserve Bank of Boston, November.
Hamilton, James D. (1989). "A New Approach to the Economic Analysis of Nonstationary Time Series and the Business Cycle." Econometrica, 57 (March), pp. 357–384.
Hamilton, James D., and Michael T. Owyang (2012). "The Propagation of Regional Recessions." Review of Economics and Statistics, vol. 94 (November), pp. 935–947.
Hammond, Bill, and McCall Zeutzius (2025). "New York's population is struggling to recover from COVID-19," Empire Center for Public Policy.
Lenza, Michele, and Giorgio E. Primiceri (2022). "How to Estimate a Vector Autoregression after March 2020." Journal of Applied Econometrics, vol. 37 (March), pp. 688–699.
Michaillat, Pascal, and Emmanuel Saez (2025). "Has the Recession Started?" Oxford Bulletin of Economics and Statistics, vol. 87 (December), pp. 1047–1058, https://doi.org/10.1111/obes.12685.
Milstein, Eric, and David Wessel (2024). "What did the Fed do in response to the COVID-19 crisis?" Brookings Institution, January.
Romer, Christina D. (2021). "The fiscal policy response to the pandemic." Brookings Papers on Economic Activity, Spring, pp. 89–110.
1. Disclaimer: FEDS Notes are articles in which Board staff offer their own views and present analysis on a range of topics in economics and finance. These articles are shorter and less technically oriented than FEDS Working Papers and IFDP papers. We gratefully acknowledge useful comments and suggestions from Stephanie Aaronson, Gianni Amisano, Travis Berge, Andrew Figura, Glenn Follette, Norm Morin and Jeremy Rudd. All errors in this note are our own. Return to text
2. Ahn and Moyon: Federal Reserve Board of Governors, 20th Street and Constitution Avenue NW, Washington, DC 20551, U.S.A. Return to text
3. Eo: Department of Economics, Korea University, Seoul 02841, South Korea. Return to text
4. Recent research has increasingly emphasized hysteresis and differences in recession recoveries (e.g., Cerra et al., 2023; Fukui et al., 2023; Furlanetto et al., 2025; Antolín-Díaz and Surico, 2025; Dupraz et al., 2025). Ahn and Eo (2025) provide a comprehensive review of the related literature. Return to text
5. Eo and Morley (2022) develop a statistical model with three business-cycle states, estimated via maximum likelihood using aggregate GDP growth. Our analysis extends the framework of Eo and Morley (2022) by using state-level data, by using nonfarm payroll employment to help identify the national cycle, and by employing a Bayesian estimation approach. Return to text
6. See Section 3 of Ahn and Eo (2025) for details on the statistical model and its estimation. The unprecedented swing in economic activity caused by the pandemic influences the model's parameter estimates in ways that fundamentally change its assessment of historical business-cycle phases—an issue noted by other authors, including Lenza and Primiceri (2022) and Eo and Morley (2023). Following these studies, we incorporate a discount function that activates at the onset of the pandemic (2020:Q2) and reduces the influence of the large swings in real activity that follow; this adjustment is then gradually phased out in subsequent periods. Return to text
7. For 2025:Q4, we use the average growth rate of national payroll employment in October and November. State-level nonfarm payroll employment growth is available through August; for 2025:Q3, we use the average of July and August. Return to text
8. Figure 2 reports the smoothed probability estimates, which incorporate information from the entire sample period, as our goal is to assess historical business-cycle phases rather than the real-time performance of the model. Return to text
9. Historically, employment exhibits dynamics during recession recoveries that differ from those of real GDP, underscoring the importance of considering both output and labor-market data when assessing hysteresis. Return to text
10. Consistent with this assessment, the employment-to-population ratio did not return to its pre-recession level until 2019. Return to text
11. Indeed, New York and New Jersey experienced more Covid-related deaths than other states in April 2020 (Bauer et al., 2020). Consistent with the model estimates, New York state's population remained lower in 2024 than in 2020 (Hammond and Zeutzius, 2025). In addition, both New York and New Jersey show lower-than-average post-pandemic GDP growth relative to the national average. Return to text
12. See pages 1 and 2 of the August 2025 Beige Book and page 2 of the November 2025 Beige Book. Additional evidence for labor market weakness in New England comes from Hall and Jackson (2025), who note that initial and continued claims for unemployment insurance in these states outpace national trends. Return to text
13. A reduced labor supply from immigration this year contributed to the slower payroll growth, but the model does not view this reduced pace as indicative of an economic downturn. Return to text
14. See, for example, Hamilton (1989), Hamilton and Owyang (2012), Francis et al. (2018), Eo and Morley (2022), Berge and Pfajfar (forthcoming). Return to text
15. Additional empirical evidence has been found by research at the Federal Reserve Bank of New York (https://www.newyorkfed.org/research/capital_markets/ycfaq#/overview). Return to text
16. The slope of the yield curve, measured by the spread between 3-month and 10-year Treasury yields, was negative in 2023 and 2024 but a recession did not materialize during these years. Return to text
17. The Sahm Rule recession indicator, is a real-time measure [SAHMREALTIME] that was retrieved from the Federal Reserve Bank of St. Louis's FRED database (https://fred.stlouisfed.org/series/SAHMREALTIME, downloaded December 11, 2025). Return to text
Ahn, Hie Joo, Yunjong Eo, and Lucas Moyon (2026). "Assessing Recession Risks with State-Level Data," FEDS Notes. Washington: Board of Governors of the Federal Reserve System, January 7, 2026, https://doi.org/10.17016/2380-7172.3992.
Disclaimer: FEDS Notes are articles in which Board staff offer their own views and present analysis on a range of topics in economics and finance. These articles are shorter and less technically oriented than FEDS Working Papers and IFDP papers.