


FEDS Notes
October 01, 2026
Beyond Aggregates: Measuring Manufacturing Subsector Heterogeneity with the Business Trends and Outlook Survey
Atreya Bhamidi, Nicole Hoffmann, and Fariha Kamal
Abstract
Real-time monitoring of U.S. manufacturing activity typically relies on high-frequency national aggregates that lack industry detail. In this Note, we assess the Business Trends and Outlook Survey (BTOS), an experimental, biweekly product of the U.S. Census Bureau, as a timely source that bridges this gap by providing industry detail. We compare BTOS diffusion indices against established manufacturing indicators and find strong co-movement at the aggregate level, particularly for prices and supplier delivery times. Critically, the industry-level granularity reveals substantial heterogeneity across manufacturing subsectors that sector aggregates obscure. A case study of the 2025 tariff increases demonstrates this value: subsectors with greater tariff exposure exhibit faster price growth than less-exposed subsectors—dynamics masked in aggregate data but essential for understanding the differential impacts of policy shocks.
Introduction
Timely, industry-specific data is essential for understanding manufacturing dynamics. Most existing high-frequency indicators only provide national aggregates, preventing real-time identification of specific industries that are expanding, contracting, or facing distinct pressures. While establishment surveys and administrative records offer rich industry detail, publication lags of several months limit their usefulness for real-time monitoring. As a result, while aggregate manufacturing trends are quickly observable, detailed evidence on which subsectors are driving these changes arrives well after economic conditions have evolved.
The Business Trends and Outlook Survey (BTOS) can narrow this gap. Launched in 2022, BTOS is a biweekly survey of a rotating panel of roughly 1.2 million businesses. Data, including detail at the three-digit North American Industrial Classification System (NAICS) level, are published approximately two weeks after the reference period—a degree of timeliness and granularity unmatched by other publicly available sources (Buffington, Foster, and Shevlin, 2023; Barrero et al., 2025). Despite these advantages, BTOS remains underutilized in manufacturing analysis, with little prior work systematically comparing its manufacturing series against established benchmarks or leveraging its subsector detail to assess heterogeneous responses to sector-specific shocks.1
This Note evaluates BTOS as a tool for tracking manufacturing activity. We compare seven key metrics—shipments, new and unfilled orders, employment, supplier delivery times, and input and output prices—against established indicators from the Institute for Supply Management (ISM) Manufacturing Purchasing Managers' Index (PMI); the Census Bureau's Manufacturers' Shipments, Inventories, and Orders (M3) Survey; the S&P Global (formerly IHS Markit) U.S. Manufacturing PMI; the Federal Reserve Board's (FRB) Industrial Production (IP) Index; and the Bureau of Labor Statistics' (BLS) Current Employment Statistics (CES), Producer Price Index (PPI), and Inputs to Industry Price Indexes (IIPI).2 We then demonstrate the value of the subsector granularity in BTOS through a case study of manufacturers' responses to the 2025 tariff increases, showing that subsectors with greater tariff exposure exhibit systematically different price dynamics than less-exposed subsectors—patterns masked in sector aggregates but critical for understanding policy impacts in real time.
Surveys of Manufacturing Activity
Most manufacturing indicators face a fundamental trade-off between timeliness and industry detail. The ISM Manufacturing PMI, released on the first business day of each month, provides one of the earliest signals of manufacturing conditions but offers no systematic industry disaggregation.3 The S&P Global (Markit) Manufacturing PMI similarly delivers timely national-level assessments, including input and output price measures, but lacks detailed industry information. The Census Bureau's M3 survey overcomes the disaggregation limitation by providing comprehensive industry estimates at the three-digit NAICS level but is released roughly four to six weeks after the reference month and contains no price information, only quantity measures such as shipments, orders, and inventories.
BTOS offers a rich set of outcomes, timeliness, and industry detail. Table 1 compares key features across the four surveys. BTOS publishes biweekly diffusion indices within approximately two weeks of the reference period, similar to the release speed of ISM and Markit, and disaggregates results to the three-digit NAICS level, matching the industry detail of M3. Importantly, BTOS also provides geographic breakdowns (national, state, and selected metropolitan areas) unavailable in other manufacturing surveys and is representative of all employer businesses in the U.S. economy from October 2023 onward. However, the BTOS has a shorter time coverage (2022–present), which precludes analysis of long-run trends or business cycle patterns.
Table 1. Comparison of surveys of manufacturing activity
| Characteristic | ISM Manufacturing PMI | Census M3 | S&P Global Manufacturing PMI | Census BTOS |
|---|---|---|---|---|
| Frequency | Monthly | Monthly | Monthly | Biweekly |
| Release Lag | ~1 business day (first business day of following month) | ~4–6 weeks | Flash: mid-month; Final: end of month | Biweekly (approximately 2-week lag) |
| Industry Detail | National aggregate only | Detailed manufacturing subsectors (3-digit NAICS) | National aggregate with limited sector detail | Detailed manufacturing subsectors (3-digit NAICS) |
| Geographic Coverage | National | National | National | National, state, and selected metropolitan areas |
| Time Coverage | 1948–present | 1957–present | 2007–present | 2022–present |
| Sample Frame | Voluntary panel of ~ 300 purchasing and supply executivesa | Voluntary, non-probability panel of ~4,700 reporting units (~3,000 companies); firms with $500M+ annual shipments, benchmarked annually to Census of Manufactures/ASM | Voluntary panel of ~ 600 manufacturersb | Voluntary probability-based sample from the Census Business Register; ~ 1.2 million businesses in six rotating panels |
| Representativeness | Not statistically representative; Panel weighted to mirror each industry's GDP contribution, skews toward larger ISM-member firms | Not representative by design (non-probability, large-company-dominated); level benchmarked annually | Panel stratified by detailed sector and company workforce size to proportionally reflect manufacturing sector structure; broader firm-size range than ISM | Representative of all employer businesses in the U.S. economy from October 2023 onwards (excluding farms) |
Note: a Panel size reported by Haver Analytics (2026).
Note: b Data from S&P Global Market Intelligence (2026).
Source: Institute for Supply Management, Manufacturing PMI (ISM); U.S. Census Bureau, Manufacturers' Shipments, Inventories, and Orders (M3); S&P Global, U.S. Manufacturing PMI (Markit); U.S. Census Bureau, Business Trends and Outlook Survey (BTOS).
BTOS Analysis Sample: Construction and Measurement
Our analysis uses BTOS data from January 2024 through July 2026. BTOS draws a stratified random sample of approximately 1.2 million employer businesses from the Census Business Register, organized into six rotating panels that are each surveyed once every twelve weeks for one year.4 These panels of roughly 200,000 businesses are contacted biweekly, with a response rate of approximately 14 percent (Buffington, 2024 (PDF)). Results are typically published within one week of the end of the collection period.
BTOS measures economic activity through diffusion indices. For each outcome, respondents indicate whether the measure increased, stayed the same, or decreased relative to the prior period. Each response is scored (increase = 100, no change = 50, decrease = 0) and averaged across respondents, so that readings above 50 indicate net expansion, below 50 indicate net contraction, and 50 indicates no net change. This construction parallels the ISM and Markit PMIs, facilitating direct comparisons. We focus on seven manufacturing-relevant current-conditions measures: shipments (revenue), new orders (future demand), unfilled orders (backlog), employment, supplier delivery times, input prices, and output prices.
Because BTOS releases are biweekly while benchmark sources (ISM, Markit, M3, FRB industrial production, and BLS series) are monthly, we aggregate BTOS to a monthly frequency for comparison. We assign each survey wave to a calendar month based on the date its reference period ends and take the simple (unweighted) mean of diffusion indices across all waves assigned to that month. This aggregation is performed separately for each of the seven measures at both the aggregate manufacturing (two-digit NAICS) and subsector (three-digit NAICS) levels, with each monthly observation dated to the last day of the month. One caveat to note: published sector-level statistics include only businesses operating solely within that sector; multi-location businesses spanning multiple NAICS sectors are excluded from sector totals, though they remain in the manufacturing sector aggregates.5
Comparing BTOS to Other Manufacturing Business Surveys: Sector level
We compare BTOS against established manufacturing indicators across seven key metrics: shipments, new orders, unfilled orders, employment, supplier delivery times, and input and output prices. Figure 1 plots BTOS aggregate diffusion indices against ISM and Markit for each measure. The three surveys move closely together for prices and supplier delivery times but diverge more substantially for quantity measures.
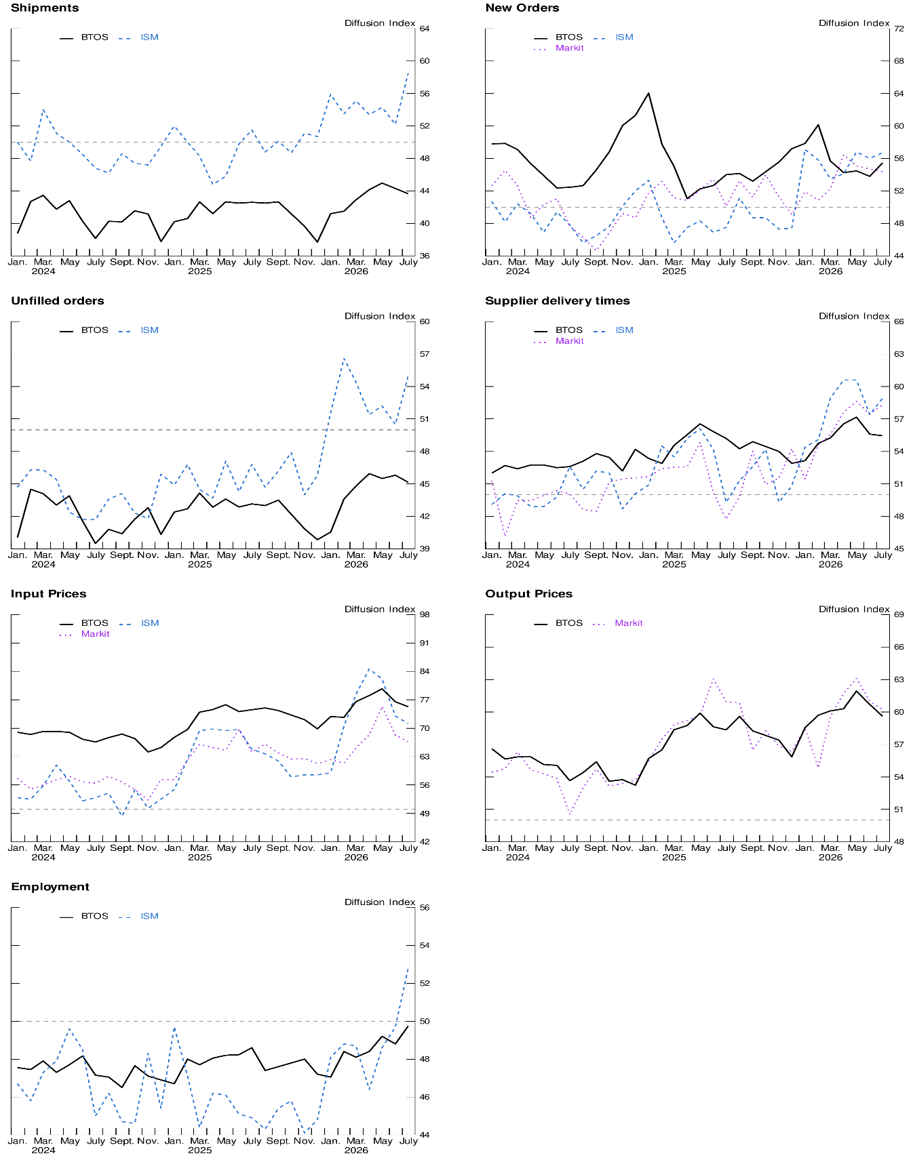
Note: Data for all series through July 2026. Grey dashed line at 50 indicates no net change.
Source: Census Bureau, Business Trends and Outlook Survey (BTOS); Institute for Supply Management, Manufacturing PMI (ISM); S&P Global U.S. Manufacturing PMI (Markit).
Table 2 corroborates these patterns using same-month correlations from January 2024 through July 2026.6 BTOS shows exceptionally strong agreement with peer surveys on prices: input price correlations reach 0.91 with ISM and 0.93 with Markit, while output prices correlate 0.88 with Markit. Supplier delivery times also track well (0.78 with ISM, 0.65 with Markit). Correlations are weaker for quantities and labor: shipments correlate 0.38–0.39 with ISM and FRB industrial production growth; new orders 0.35 with ISM; unfilled orders 0.54 with ISM; and employment 0.43 with ISM and 0.32 with CES payroll growth. BTOS shipments correlate negatively with M3 real-dollar shipment growth (−0.23).
Table 2. BTOS Correlations with Alternative Manufacturing Data Sources at the Sector Level, January 2024–July 2026
| Measure | ISM | Markit | M3 | FRB IP | CES | IIPI | PPI |
|---|---|---|---|---|---|---|---|
| Shipments | 0.38 | — | -0.23 | 0.39 | — | — | — |
| New Orders | 0.35 | -0.01 | -0.05 | — | — | — | — |
| Unfilled Orders | 0.54 | — | -0.17 | — | — | — | — |
| Supplier Delivery Times | 0.78 | 0.65 | — | — | — | — | — |
| Input Prices | 0.91 | 0.93 | — | — | — | 0.46 | — |
| Output Prices | — | 0.88 | — | — | — | — | 0.35 |
| Employment | 0.43 | — | — | — | 0.32 | — | — |
Note: ISM and Markit are compared as-is (diffusion indices); M3, FRB IP, BLS-CES, IIPI, and PPI are transformed to month-over-month percent changes. Comparison window begins January 2024; M3 and FRB IP overlap with BTOS for 29 months, IIPI for 27 months, and all other series overlap for 30 months. "—" indicates no counterpart from the given data source. Markit delivery times inverted (100 - x) to match BTOS/ISM (higher = slower). CES: total manufacturing payrolls. IIPI: shipments-weighted composite of the 21 3-digit NAICS BLS input-to-industry indices.
Source: U.S. Census Bureau, Business Trends and Outlook Survey (BTOS); Institute for Supply Management, Manufacturing PMI (ISM); S&P Global, U.S. Manufacturing PMI (Markit); U.S. Census Bureau, Manufacturers' Shipments, Inventories, and Orders (M3); Board of Governors of the Federal Reserve System, Industrial Production and Capacity Utilization (FRB IP); U.S. Bureau of Labor Statistics, Current Employment Statistics (CES), Inputs to Industry Price Indexes (IIPI), and Producer Price Indexes (PPI).
The weak quantity correlations are not unique to BTOS. Cross-correlations among all pairs of indicators reveal that established sources disagree with one another as much as they disagree with BTOS (Appendix Table A1). For shipments, ISM production correlates only −0.23 with M3 real-dollar shipment growth—the same as BTOS—while M3 and FRB industrial production correlate just 0.06. ISM and Markit new orders correlate only 0.53 with each other. In contrast, the three survey measures for prices align closely: BTOS, ISM, and Markit input prices show correlations of 0.88–0.93 with one another.
These patterns reflect a fundamental conceptual distinction: diffusion indices (BTOS, ISM, Markit) capture the breadth of month-to-month change—the share of firms experiencing increases—while M3 and industrial production capture dollar- or output-weighted magnitudes, dominated by large firms. As Pinto (2025) demonstrates, these two dimensions—"how many" versus "how much"—can diverge systematically, particularly when large and small firms experience different conditions or when shocks affect firm-size distributions asymmetrically.7 A month in which many smaller firms contract while a few large ones expand (or vice versa) can push the two types of measures in opposite directions.
The BLS Input-to-Industry Price Index (IIPI) correlates more strongly with all three surveys (0.43–0.63) than M3 shipments and IP do. The high survey-to-survey agreement for prices (0.88–0.93), contrasted with weaker correlations among all quantity series (most below 0.5), shows that BTOS behaves like its peer indicators: strong alignment where peers themselves agree, and similar divergence where they do not.
The comparison exercise indicates that BTOS is a highly reliable real-time gauge of price and supply-chain conditions. For quantity and employment measures, BTOS performs comparably to ISM and Markit.
Comparing BTOS to Other Manufacturing Business Surveys: Subsector level
We now compare BTOS's distinctive margin, three-digit NAICS industry detail, against subsector-level benchmarks. For each manufacturing subsector, we correlate BTOS diffusion indices against the corresponding surveys with industry detail: M3 (shipments), FRB IP (shipments), BLS CES (employment), BLS IIPI (input prices), and BLS PPI (output prices). We find that subsector correlations mirror the national pattern: stronger alignment for prices and weaker correlations for quantities (Table 3).
Table 3. BTOS Correlations with Alternative Manufacturing Data Sources at the Subsector Level, January 2024–July 2026
| Group | Shipments (vs M3) | Shipments (vs IP) | New Orders (vs M3) | Unfilled Orders (vs M3) | Employment (vs CES) | Input Prices (vs IIPI) | Output Prices (vs PPI) |
|---|---|---|---|---|---|---|---|
| All manufacturing | -0.10 | 0.31 | -0.07 | 0.02 | 0.63 | 0.45 | 0.46 |
| Durable goods | 0.11 | 0.31 | -0.07 | 0.02 | 0.72 | 0.42 | 0.56 |
| Non-durable goods | -0.13 | 0.17 | — | — | 0.28 | 0.42 | 0.33 |
Note: Durable goods subsectors (NAICS 321, 327, 331–337, 339) produce goods with an expected useful life of three years or more, such as machinery, metals, and computers; non-durable goods subsectors (NAICS 311–316, 322–326) produce goods that are consumed or used up more quickly, such as food, textiles, and chemicals. "—" indicate data unavailable. New and unfilled orders series are available only for NAICS 331–337.
Source: U.S. Census Bureau, Business Trends and Outlook Survey (BTOS); U.S. Census Bureau, Manufacturers' Shipments, Inventories, and Orders (M3); Board of Governors of the Federal Reserve System, Industrial Production and Capacity Utilization (IP); U.S. Bureau of Labor Statistics, Current Employment Statistics (CES), Inputs to Industry Price Indexes (IIPI), and Producer Price Indexes (PPI).
The subsector-level correlation is near-zero for quantities in the M3 but positive and economically meaningful for FRB industrial production (+0.31 for all manufacturing and durables, +0.17 for non-durables), BLS prices (input prices: +0.42 for durables and non-durables, +0.45 for all manufacturing; output prices: +.56 for durables, +0.33 for non-durables, +0.46 for all manufacturing), and BLS employment (+0.72 for durables, +0.28 for non-durables, +0.63 for all manufacturing).
Notably, subsector-level correlations exhibit substantial heterogeneity (Appendix Table A2). Some subsectors align very closely with BLS price statistics: Plastics & Rubber Products (NAICS 326) shows correlations of +0.73 for input prices and +0.77 for output prices with BLS input and producer prices respectively; and others diverge sharply: Petroleum & Coal Products (NAICS 324) correlates −0.15 on input prices and −0.01 on output prices. Nearly all 21 subsectors exhibit positive price correlations, while quantity correlations remain near zero across nearly all subsectors.
The subsector comparison offers two insights. First, the stronger price correlation but weaker quantity agreement persists at the subsector level, reinforcing that this reflects conceptual differences between diffusion and magnitude measures rather than survey-specific errors. Second, heterogeneity across subsectors underscores BTOS's distinctive value: the ability to identify which specific industries are experiencing price pressures or supply-chain disruptions in real time, a capability we exploit in the tariff case study that follows.
Case Study: Winners and Losers in the 2025 Tariff Episode
The 2025 tariff increases provide a natural experiment to demonstrate BTOS's distinctive value: the examination of heterogeneous subsector responses that aggregate indicators obscure. We construct a net tariff-exposure measure for each of the 21 manufacturing subsectors that compares tariff protection on an industry's output against tariff costs on its inputs: a value of zero represents the average manufacturing industry's net exposure, with positive values indicating net protection and negative values indicating net cost burdens.8 Subsectors vary widely in their net exposure, from Computer & Electronic Products (NAICS 334) and Electrical Equipment (335), which gained substantial output protection, to Primary Metals (331) and Fabricated Metals (332), which faced increases in imported input costs.
Figure 2 shows how prices trended in industries with differential tariff exposures, using the same four select subsectors in both panels: Primary Metals (331) and Fabricated Metals (332) shown in blue; and Computer & Electronic Products (334) and Electrical Equipment (335) shown in orange. Following the first set of tariffs implemented in 2025, input prices rose sharply across all featured subsectors, reaching peak diffusion levels between 75 and 85, led by Electrical Equipment (335), Computer & Electronic Products (334), and Primary Metals (331). By contrast, output prices experienced a more constrained rise, climbing from roughly 55 to peak near 65 in mid-2026. This persistent vertical wedge between input and output prices is consistent with broad-based margin compression.
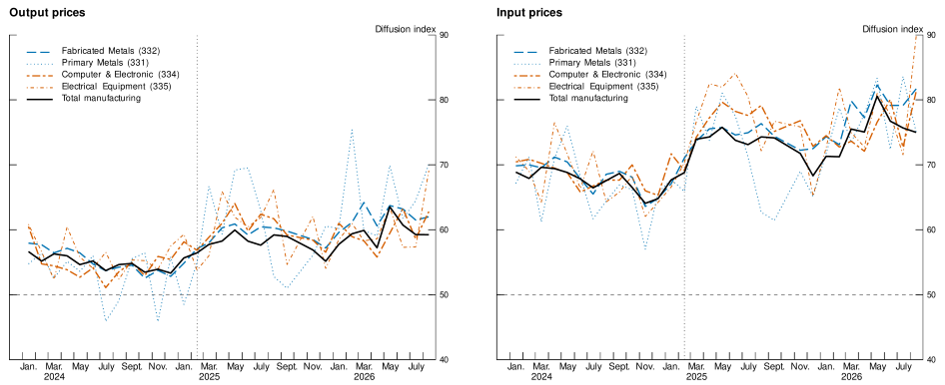
Note: This chart displays diffusion indices for output (left panel) and input (right panel) prices separately for four select subsectors and an IP-relative-importance-weighted total-manufacturing aggregate (black solid); the vertical line marks the tariff onset (February 2025). Primary Metals (331) and Fabricated Metals (332), the most input-cost-pressured subsectors on net, are shown in blue; Computer & Electronic Products (334) and Electrical Equipment (335), the most output-protected subsectors on net, are shown in orange.
Source: U.S. Census Bureau, Business Trends and Outlook Survey; Federal Reserve Board, Industrial Production and Capacity Utilization.
The subsector granularity in BTOS enables tracking these dynamics at a detailed level unavailable in aggregate indicators. We quantify this heterogeneity systematically by estimating a difference-in-differences specification that relates each BTOS outcome to net tariff exposure across all 21 manufacturing subsectors as follows:
$$$$ y_{it} = {\alpha }_{i} + {\beta }_{1}post_{t} + {\beta }_{2}\left(Net Tariff Exposure \cdot post_{t}\right) + \sum_{k = 1}^{3} y_{k}\left(C_{i,k}\cdot post_{t}\right) + {\varepsilon }_{it} $$$$
where $$y_{it}$$ is a BTOS diffusion index for subsector $$i$$ in month $$t$$; $${\alpha }_{i}$$ is a three-digit industry fixed effect that absorbs time-invariant differences across subsectors; and $$post_{t}$$ equals 1 starting in February 2025 and 0 otherwise. $$C_{i,k}$$ includes total import penetration, total imported input cost share, and total export share of output. The equation is estimated by weighted least squares using the FRB industrial production relative-importance weight, with standard errors clustered at the three-digit industry level. Coefficients are reported as the effect of a one-standard-deviation increase in net tariff exposure.
Figure 3 displays the results. The coefficient on the net tariff exposure measure—netting imported input cost increases against output market protection—shows that subsectors where input costs exceed protection (i.e., lower or more negative composite exposure) exhibit weaker business conditions. A one-standard-deviation increase in net imported input cost exposure correlates with higher input prices and modestly higher output prices, consistent with margin compression. While coefficients on the remaining outcomes are statistically insignificant, the patterns suggest that more cost-pressured subsectors may be associated with lower shipments and lower unfilled orders, potentially indicating weakened demand as higher prices dampen sales.
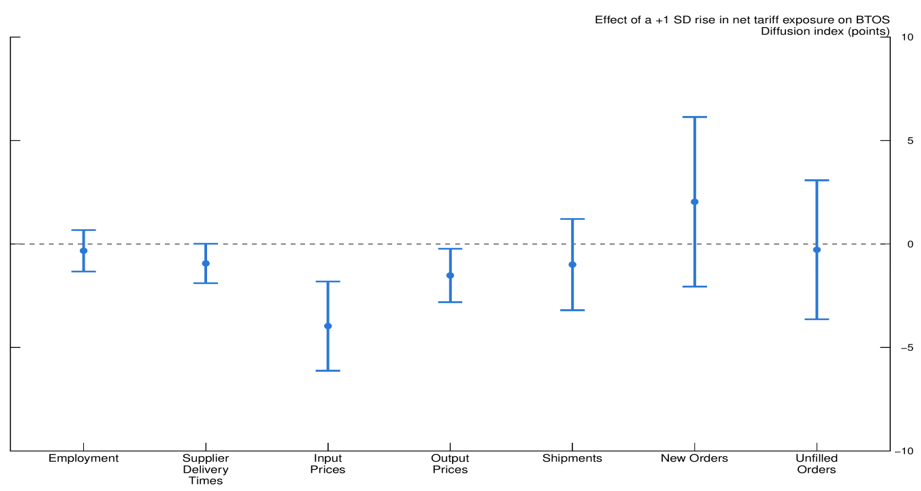
Note: Dots are coefficient estimates; bars show 95 percent confidence intervals.
Source: U.S. Census Bureau, Business Trends and Outlook Survey; Federal Reserve Board, Industrial Production and Capacity Utilization.
Taken together, the results are consistent with the intuition from Figure 2: subsectors where tariff-induced input costs exceed output market protection experience rising prices, while the national aggregate masks this heterogeneity.
Implications and caveats
BTOS provides a valuable new lens for monitoring U.S. manufacturing conditions in near-real time. Two features distinguish it from existing aggregate indicators: granular subsector detail reveals heterogeneous responses that national aggregates obscure, and coverage of a rich set of outcomes in a single survey complements standard production data. The 2025 tariff case study demonstrates the value of subsector data: industries facing net input cost pressures experienced higher input and output prices.
The primary limitation for subsector analysis is that multi-sector firms are excluded from subsector samples. BTOS assigns diversified manufacturers to a separate category rather than allocating them to individual three-digit NAICS industries. This means subsector samples comprise specialized firms that may be smaller, while diversified manufacturers that are likely larger are tracked only at the aggregate level. Despite this limitation, BTOS fills a critical gap: no other public-use dataset combines near-real-time reporting of a comprehensive set of outcomes at the subsector level for the manufacturing sector. As the 2025 tariff case study demonstrates, this makes BTOS particularly valuable for analyzing distributional impacts of economic shocks.
References
Barrero, Jose Maria, Nicholas Bloom, Kathryn Bonney, Cory L. Breaux, Cathy Buffington, Steven J. Davis, Lucia S. Foster, Brian McKenzie, Keith Savage, and Cristina Tello-Trillo. 2025. "Tapping Business and Household Surveys to Sharpen Our View of Work from Home." NBER Working Paper No. 33951 (June 2025, revised October 2025).
Board of Governors of the Federal Reserve System. n.d. "Industrial Production and Capacity Utilization – G.17." Accessed August 2026.
Buffington, Catherine, Lucia Foster, and Colin Shevlin. 2023. "Measuring Business Trends and Outlook through a New Survey." AEA Papers and Proceedings 113: 140–144.
Buffington, Cathy. 2024. "The Business Trends & Outlook Survey: Tracking Firm AI Use in Real Time (PDF)." Presentation, Session 6, 2024 Central Bank Business Survey Conference, Banca d'Italia, October 30, 2024.
Eck, Sydney, Trang Hoang, Carter Mix, and Madeleine Ray. 2026. "Mind the Gap: Announced versus Implied Tariff Rates in Recent Trade Policy Episodes." FEDS Notes. Washington: Board of Governors of the Federal Reserve System, April 8, 2026.
Institute for Supply Management. n.d. "ISM® PMI® Reports." Accessed August 2026.
Kamal, Fariha. 2026. "Importers, Exporters, and Job Creation: A 30-Year View to Assess Implications of the 2025 US Tariff Actions." National Tax Journal 79 (1): 207–231.
Pinto, Santiago M. (2025). "Understanding Diffusion Indexes: Insights and Applications." Federal Reserve Bank of Richmond Economic Brief, No. 25-05, February.
S&P Global. n.d. "Purchasing Managers' Index™ (PMI®)." Accessed August 2026. https://www.pmi.spglobal.com/
S&P Global Market Intelligence. 2026. "S&P Global US Manufacturing PMI®: US Manufacturing Sector Expansion Holds Steady but Masks Softer Production and Sales Growth." News release, August 3, 2026. https://www.pmi.spglobal.com/Public/Home/PressRelease/c1430bf93dfa42d3bb8927edf49494db
Tapasanun, Winnie. 2026. "U.S. ISM Manufacturing PMI at Highest Level Since May '22; New Orders, Production, and Employment Growing." Economy in Brief, Haver Analytics, August 3, 2026. https://www.haver.com/articles/u-s-ism-manufacturing-pmi-steady-in-april-new-orders-and-production-growing-employment-contracting
U.S. Bureau of Labor Statistics. n.d. "Current Employment Statistics (CES)." Accessed August 2026.
U.S. Bureau of Labor Statistics. n.d. "Inputs to Industry Price Indexes." Accessed August 2026.
U.S. Bureau of Labor Statistics. n.d. "Producer Price Indexes (PPI)." Accessed August 2026.
U.S. Census Bureau. n.d. "About the Business Trends and Outlook Survey (BTOS)." Accessed August 2026.
U.S. Census Bureau. n.d. "Manufacturers' Shipments, Inventories, and Orders (M3)." Accessed 2026.
U.S. Census Bureau. 2025. "Manufacturing Costs: 2024–2025." Data visualization.
Appendix
Table A1: Cross-Correlations Between Alternative Manufacturing Data Sources at the Sector Level, January 2024–July 2026
Employment
| BTOS | ISM | CES | |
|---|---|---|---|
| CES | 1.00 | ||
| ISM | 1.00 | 0.46 | |
| BTOS | 1.00 | 0.43 | 0.32 |
Input Prices
| BTOS | ISM | Markit | IIPI | |
|---|---|---|---|---|
| IIPI | 1.00 | |||
| Markit | 1.00 | 0.43 | ||
| ISM | 1.00 | 0.88 | 0.63 | |
| BTOS | 1.00 | 0.91 | 0.93 | 0.46 |
New Orders
| BTOS | ISM | Markit | M3 | |
|---|---|---|---|---|
| M3 | 1.00 | |||
| Markit | 1.00 | -0.08 | ||
| ISM | 1.00 | 0.53 | -0.14 | |
| BTOS | 1.00 | 0.35 | -0.01 | -0.05 |
Output Prices
| BTOS | Markit | PPI | |
|---|---|---|---|
| PPI | 1.00 | ||
| Markit | 1.00 | 0.23 | |
| BTOS | 1.00 | 0.88 | 0.35 |
Shipments
| BTOS | ISM | M3 | IP | |
|---|---|---|---|---|
| IP | 1.00 | |||
| M3 | 1.00 | 0.06 | ||
| ISM | 1.00 | -0.23 | 0.14 | |
| BTOS | 1.00 | 0.38 | -0.23 | 0.39 |
Supplier Delivery Times
| BTOS | ISM | Markit | |
|---|---|---|---|
| Markit | 1.00 | ||
| ISM | 1.00 | 0.81 | |
| BTOS | 1.00 | 0.78 | 0.65 |
Unfilled Orders
| BTOS | ISM | M3 | |
|---|---|---|---|
| M3 | 1.00 | ||
| ISM | 1.00 | -0.33 | |
| BTOS | 1.00 | 0.54 | -0.17 |
Note: Same-month Pearson correlations, Jan 2024-July 2026. BTOS, ISM, and Markit are compared as-is (diffusion indices); M3, FRB IP, CES, IIPI, and PPI are transformed to month-over-month percent changes. Markit delivery times inverted (100 - x) to match BTOS/ISM (higher = slower). CES is total manufacturing payrolls (Employment); IIPI is the BLS Input-to-Industry index (Input Prices); PPI is the BLS Producer Price Index (Output Prices).
Source: U.S. Census Bureau, Business Trends and Outlook Survey (BTOS); Institute for Supply Management, Manufacturing PMI (ISM); S&P Global, U.S. Manufacturing PMI (Markit); U.S. Census Bureau, Manufacturers' Shipments, Inventories, and Orders (M3); Board of Governors of the Federal Reserve System, Industrial Production and Capacity Utilization (IP); U.S. Bureau of Labor Statistics, Current Employment Statistics (CES), Inputs to Industry Price Indexes (IIPI), and Producer Price Indexes (PPI).
Table A2: BTOS Correlations with Alternative Manufacturing Data Sources at the Subsector Level, All Industries, January 2024–July 2026
| NAICS | Description | Shipments (vs M3) | Shipments (vs IP) | New Orders (vs M3) | Unfilled Orders (vs M3) | Employment (vs CES) | Input Prices (vs IIPI) | Output Prices (vs PPI) |
|---|---|---|---|---|---|---|---|---|
| 311 | Food | 0.18 | 0.40 | — | — | -0.35 | -0.12 | 0.33 |
| 312 | Beverage & Tobacco | 0.18 | 0.17 | — | — | — | 0.29 | 0.08 |
| 313 | Textile Mills | -0.15 | 0.04 | — | — | 0.16 | 0.47 | 0.48 |
| 314 | Textile Products | -0.01 | 0.05 | — | — | -0.26 | 0.44 | 0.27 |
| 315 | Apparel | 0.03 | 0.22 | — | — | 0.05 | 0.06 | -0.20 |
| 316 | Leather | 0.34 | 0.10 | — | — | — | 0.10 | — |
| 321 | Wood | 0.11 | 0.09 | — | — | 0.22 | 0.29 | 0.30 |
| 322 | Paper | -0.33 | 0.10 | — | — | 0.02 | 0.37 | 0.62 |
| 323 | Printing | 0.08 | -0.17 | — | — | 0.26 | 0.49 | 0.13 |
| 324 | Petroleum & Coal | -0.07 | 0.23 | — | — | 0.03 | -0.15 | -0.01 |
| 325 | Chemicals | -0.24 | 0.10 | — | — | 0.40 | 0.46 | 0.43 |
| 326 | Plastics & Rubber | -0.21 | -0.04 | — | — | 0.00 | 0.73 | 0.77 |
| 327 | Nonmetallic Mineral | 0.17 | -0.14 | — | — | 0.12 | 0.48 | 0.07 |
| 331 | Primary Metal | 0.01 | -0.03 | -0.14 | -0.25 | -0.14 | 0.19 | 0.44 |
| 332 | Fabricated Metal | -0.07 | 0.16 | -0.29 | -0.05 | 0.53 | 0.46 | 0.48 |
| 333 | Machinery | -0.05 | 0.24 | 0.02 | 0.41 | 0.35 | 0.56 | 0.53 |
| 334 | Computer & Electronic | 0.06 | -0.08 | -0.02 | -0.12 | 0.17 | 0.29 | 0.26 |
| 335 | Electrical Equip. | -0.36 | 0.40 | -0.18 | 0.01 | -0.07 | 0.29 | 0.22 |
| 336 | Transportation | 0.06 | -0.14 | -0.01 | 0.11 | 0.39 | 0.10 | 0.06 |
| 337 | Furniture | -0.35 | -0.20 | -0.45 | -0.30 | 0.10 | 0.48 | 0.18 |
| 339 | Miscellaneous | -0.19 | 0.04 | — | — | 0.07 | 0.50 | -0.04 |
| Median (subsectors) | -0.01 | 0.09 | -0.14 | -0.05 | 0.10 | 0.37 | 0.27 |
Note: "—" indicate data unavailable for that subsector: BLS employment for NAICS 312 and 316; PPI for NAICS 316. New and unfilled orders series are available only for NAICS 331–337.
Source: U.S. Census Bureau, Business Trends and Outlook Survey (BTOS); U.S. Census Bureau, Manufacturers' Shipments, Inventories, and Orders (M3); Board of Governors of the Federal Reserve System, Industrial Production and Capacity Utilization (IP); U.S. Bureau of Labor Statistics, Current Employment Statistics (CES), Inputs to Industry Price Indexes (IIPI), and Producer Price Indexes (PPI).
1. Manufacturing subsector analyses are limited to Census Bureau data briefs (U.S. Census Bureau, 2025). Kamal (2026) examines trends in current and expected outcomes in overall manufacturing. Return to text
2. For details on these data sources see: Institute for Supply Management (2026), U.S. Census Bureau (2026), S&P Global (2026), Board of Governors of the Federal Reserve System (2026), Bureau of Labor Statistics (2026), Bureau of Labor Statistics (2026), and Bureau of Labor Statistics (2026). For the full list of outcomes surveyed in BTOS, see Census Bureau (2026). Return to text
3. ISM's monthly PMI reports include qualitative comments from respondents that may reference specific industries (e.g., "Computer & Electronic Products: Semiconductor shortages limiting production"), but these comments are anecdotal and not systematically reported across all industries in every survey period. Return to text
4. The BTOS sample is not adjusted for business exit or entry except through periodic resampling, so measured changes can miss decreases (increases) driven by exiting (entering) businesses. Return to text
5. BTOS reports a separate series for all multi-sector firms classified as subsector 31X, allowing users to track this segment independently. Return to text
6. Because BTOS diffusion indices measure change, we correlate them with the ISM and Markit diffusion indices and month-over-month percent growth in the Census M3, FRB industrial production, and BLS employment, input price, and producer price series. Return to text
7. Pinto (2025) decomposes aggregate changes into "how many" (breadth, captured by diffusion indices) and "how much" (intensity, captured by weighted growth rates). During normal times, employment growth is primarily driven by breadth, making diffusion indices more reliable. During extreme shocks (e.g., the COVID-19 pandemic), intensity dominates. For prices, both dimensions typically move together, explaining why price diffusion indices correlate more strongly with weighted price measures. Return to text
8. The net tariff exposure measure compares the protection an industry receives against the cost increases it faces. For each industry, we compute two components weighted by pre-tariff industry trade exposure: (1) Import Protection: the tariff rate increase on competing imports multiplied by the industry's import penetration ratio (imports/domestic consumption), and (2) Input Cost: the tariff rate increase on imported inputs multiplied by the industry's import cost share (imported inputs/total costs). We measure the change in average effective tariff rates calculated as the difference between average effective tariff rates in July-December 2025 and July-December 2024. Effective tariffs rates are obtained from Eck, Hoang, Mix, Ray (2026). We standardize both components to have comparable scales, then construct the composite as the difference: standardized Import Protection minus standardized Input Cost. The resulting measure is scale-invariant with weighted mean zero. A one-unit increase represents moving from an industry at the mean net exposure to one standard deviation above the mean—indicating either stronger protection relative to input costs, or weaker input cost burdens relative to protection. Return to text
Bhamidi, Atreya, Nicole Hoffmann, and Fariha Kamal (2026). "Beyond Aggregates: Measuring Manufacturing Subsector Heterogeneity with the Business Trends and Outlook Survey," FEDS Notes. Washington: Board of Governors of the Federal Reserve System, October 01, 2026, https://doi.org/10.17016/2380-7172.4178.
Disclaimer: FEDS Notes are articles in which Board staff offer their own views and present analysis on a range of topics in economics and finance. These articles are shorter and less technically oriented than FEDS Working Papers and IFDP papers.