


FEDS Notes
October 09, 2026
Beyond the Current Account: U.S. Financial Flows and Global Imbalances
Cody Kallen and Alexandra Tabova
Global imbalances have returned to the center of international policy discussions, including at the G7 and G20. These discussions have traditionally focused on current account (CA) balances and, in particular, on the drivers and consequences of persistent trade surpluses and deficits. But CA balances provide only one perspective on external imbalances. Their financial counterpart—cross-border capital flows and the resulting international investment positions—provides important additional information about how imbalances are financed, the risks associated with them, and how they adjust over time.
Focusing on the United States, this note examines imbalances through this financial lens. We document the relationship between the current and financial accounts; distinguish net flows from the much larger gross capital flows into and out of the United States; examine their composition by asset type and source of financing; and analyze the deterioration in the U.S. net international investment position—the difference between external financial assets and external liabilities—including the important role of valuation effects and valuation methodologies. Finally, we examine the geography of foreign investment in the United States and show that bilateral trade balances bear little relationship to bilateral financial balances. Together, these facts provide a more complete picture of the U.S. external position and inform current debates about the sustainability of global imbalances and policies intended to reduce them.
The United States is central to this debate over imbalances. It has run persistent CA deficits since the 1980s and today has both the largest current account deficit and the largest negative net international investment position (NIIP) among OECD economies in dollar amounts, and the second largest relative to GDP (Figure 1). Yet these aggregate measures leave several important questions unanswered:
- How does the U.S. CA deficit relate to financial flows and demand for U.S. assets?
- How does the U.S. CA deficit relate to gross financial flows?
- What types of assets and sources of financing are behind these gross financial flows?
- What has driven the deterioration in the U.S. NIIP, over time and more recently?
- Which countries invest in the United States; and, relatedly, are bilateral trade and financial flows correlated?
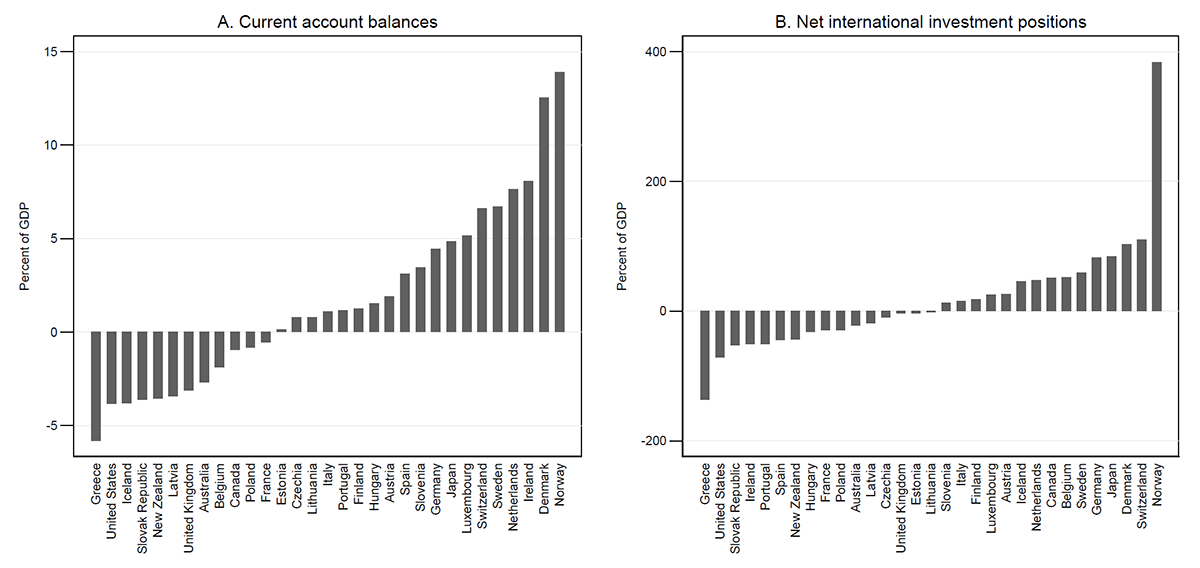
Note: Includes OECD members reporting international investment positions for 2025, as of July 22, 2026.
Source: OECD.
1. How does the U.S. CA deficit relate to financial flows and demand for U.S. assets?
Traditionally, the large and persistent U.S. CA deficits (Figure 2, in grey) have been the focus of global imbalances discussions.1,2 But the flip side of these CA deficits is the financial account (FA) balance (in green): the net financial inflows that finance these deficits.
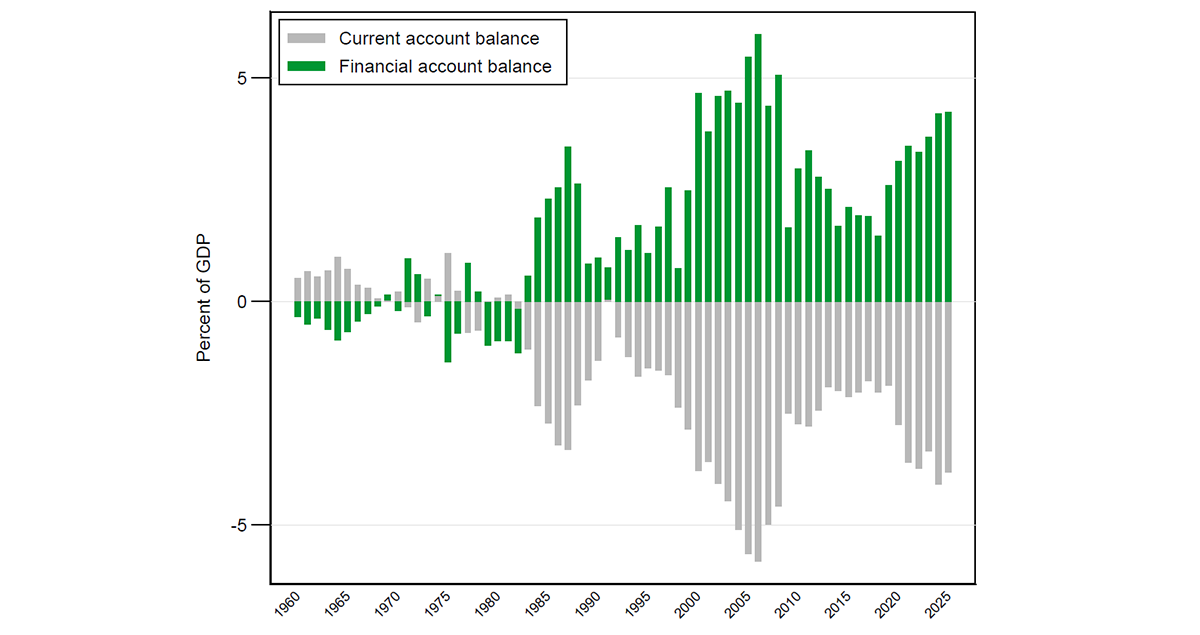
Note: The capital account and statistical discrepancy are omitted.
Source: Bureau of Economic Analysis, via Haver, as of June 24, 2026.
In equilibrium, the current and financial accounts are linked by an accounting identity, but the direction of causality between them is debated.3 Under the traditional "saving-investment gap" view, real economy factors drive financial flows: if domestic absorption (consumption, investment, and government consumption) exceeds domestic production, the United States runs a current account deficit, which must be financed by net capital inflows (Laibson and Mollerstrom, 2010; Yan, 2007). Under the alternative "excess savings" or "safe asset demand" views, financial flows drive the real economy: if foreign investors seek to purchase U.S. assets, whether to build reserves, facilitate dollar-denominated trade, or access deep U.S. financial markets, these inflows strengthen the dollar, making imports cheaper and exports less competitive, thereby driving a trade deficit (Borio and Disyatat, 2015; Caballero, Farhi and Gourinchas, 2008). However, Obstfeld (2026) argues that foreign demand for dollar assets can also be met by U.S. purchases of foreign assets, rather than running current account deficits.
The link between the current and financial accounts matters in discussions of global imbalances because it connects the trade/saving side of global imbalances to the financial flows that make those imbalances possible.4 This connection matters for policy because the appropriate response to an external imbalance depends in part on its underlying driver. A deficit arising from excess domestic demand has different implications from one associated with strong foreign demand for U.S. assets, even though both may generate the same deficits in the current and financial accounts. Recent research has found limited potential roles for industrial policy to drive current account imbalances (Cesa-Bianchi, et al., 2026a), unless combined with other policies to prevent an external or internal adjustment (Cesa-Bianchi, et al., 2026b).
2. How does the U.S. CA deficit relate to gross financial flows: foreign investment in the United States and U.S. investment abroad?
Because the United States runs CA deficits, its net financial inflows are positive. This naturally leads one to think of the financial account purely in terms of the financial inflows the United States receives: the positive investment flows from the rest of the world (ROW). However, to better understand the dynamics of the financial account, we should not overlook the fact that net financial inflows are the difference between gross financial inflows (foreign investment in the United States) and gross financial outflows (U.S. investment abroad).
Figure 3 splits net financial flows (the green bars in Figure 2) into gross financial inflows and gross financial outflows. Two main takeaways emerge. First, gross inflows (blue bars) and gross outflows (orange bars) are large: as the United States receives substantial inflows from the ROW, U.S. investors also invest abroad. In comparison, CA deficits are smaller in size.5 Second, gross financial inflows and gross financial outflows are not only large but also co-move closely (panel B, where the same grosses are plotted as lines and with flipped sign for ease of comparison) at high frequencies and over longer time horizons. This co-movement is related to financial globalization, the global financial cycle, and risk sharing (Obstfeld, 2012). By comparison, CA deficits are less volatile and slow to adjust.
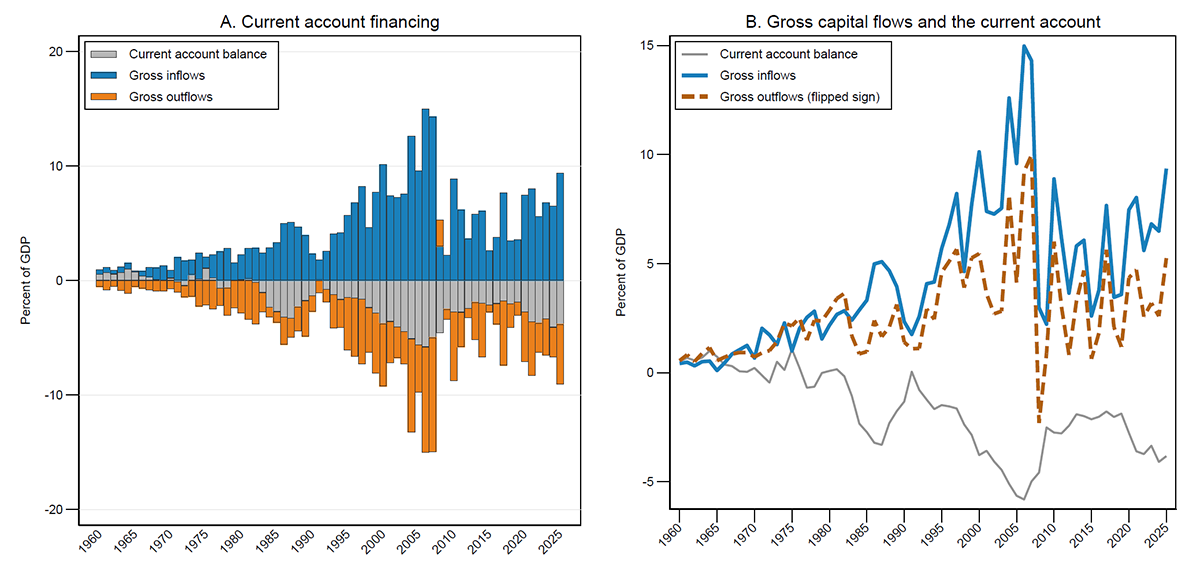
Note: The capital account and statistical discrepancy are omitted.
Source: Bureau of Economic Analysis, International Transactions, as of June 24, 2026.
The dynamics of gross financial flows are also highly relevant to discussions of global imbalances. Obstfeld (2012) highlights that with deep financial globalization, countries can have large gross external financial positions that are not reflected in their net CA balances. A balanced CA, therefore, does not imply limited cross-border financial exposure. In a financially integrated world, large and potentially risky gross external positions can coexist with a small or even zero current account balance.
3. What types of assets and sources of financing are behind these gross financial flows into the United States and U.S. investments abroad?
Having established that gross flows are much larger than net financial flows, we now turn to their composition. Figure 4 separates gross inflows (Panel A) and outflows (Panel B) into foreign direct investment (FDI), portfolio investment, and other investment, which is primarily cross-border banking flows. Panel A shows that FDI represents a relatively small portion of total financial inflows into the United States. Portfolio and other investment inflows, by comparison, are larger and considerably more volatile. In the build-up to the Great Financial Crisis (GFC), portfolio and other investments surged, but both subsided after the crisis. In the post-crisis period, portfolio and banking inflows have remained well below their pre-GFC peaks, and even the post-Covid recovery has not restored these flows to their pre-GFC magnitudes.
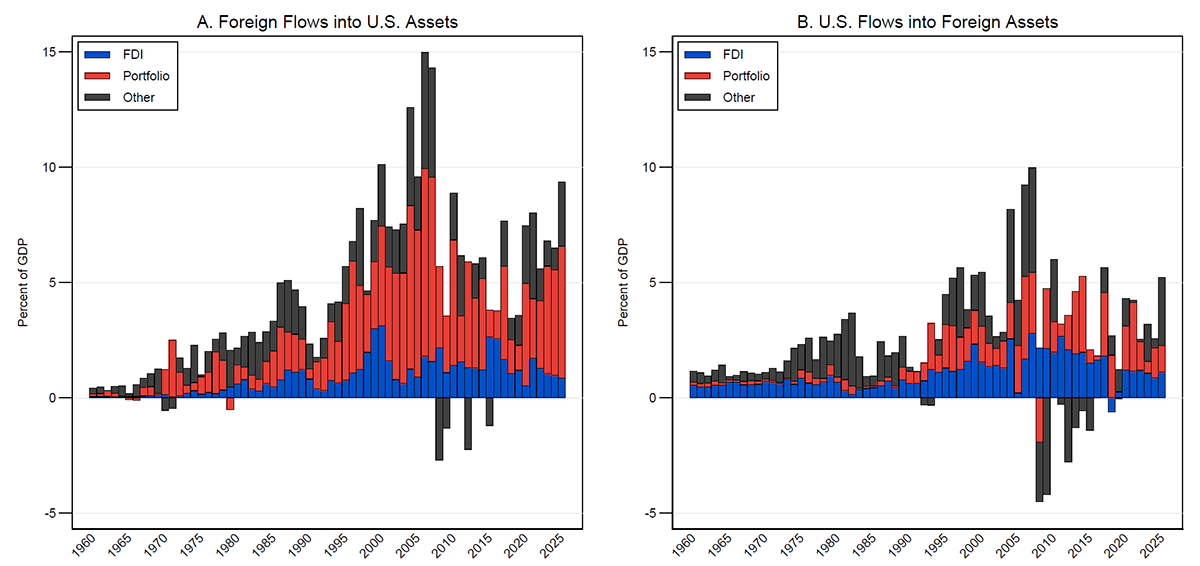
Source: Bureau of Economic Analysis, International Transactions, as of June 24, 2026.
On the outflow side, Panel B shows that FDI represents a more important component of U.S. purchases of foreign assets, with portfolio outflows playing a more modest role.
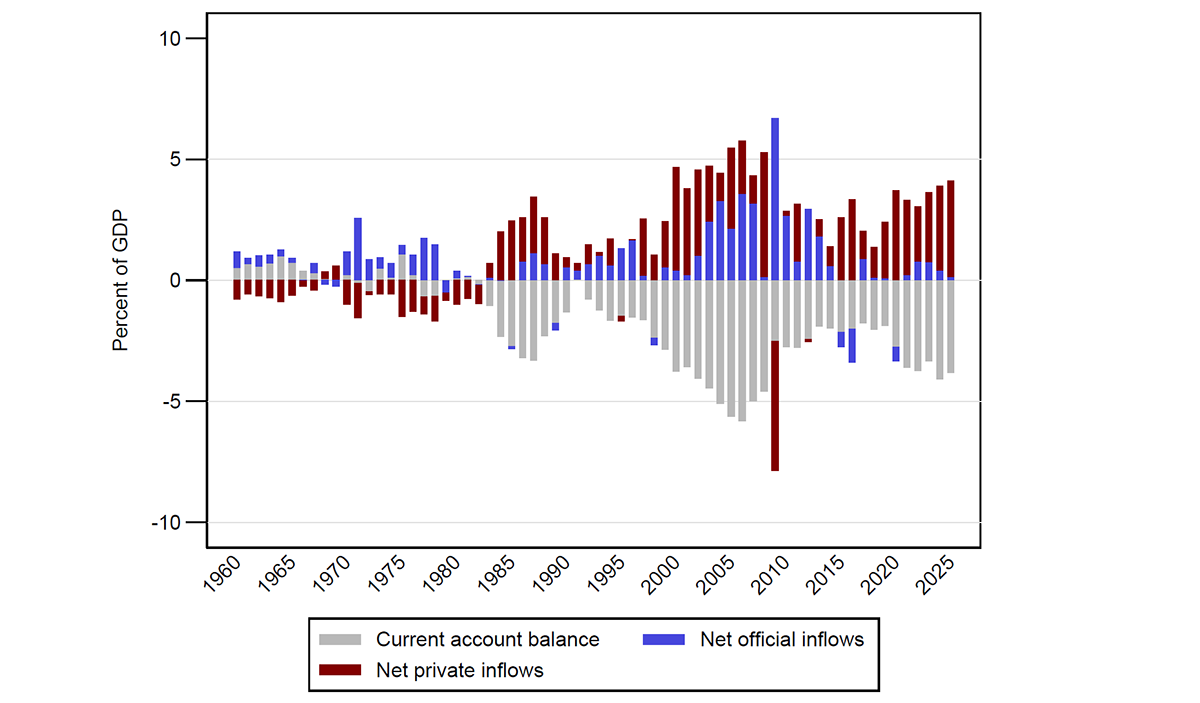
Turning to the sources of financing, Figure 5 shows that the U.S. CA deficits in the mid-1990s and mid-2000s were financed largely by foreign official inflows (blue), consisting primarily of purchases of U.S. Treasuries. In contrast, financing of the deficits in the 1980s, during the dot-com boom in the late 1990s and early 2000s, and since 2015 has come from net private capital flows.6 These episodes of private financing have generally coincided with periods of relatively strong U.S. economic performance.
Note: The capital account and statistical discrepancy are omitted.
Source: Bureau of Economic Analysis, as of June 24, 2026.
The asset composition and source of financial flows are similarly relevant to discussions of global imbalances. Fundamentally, global imbalances are about who is financing whom, and the type of cross-border financial flow as well as the source of financing tells us much more about the nature and risk of that financing than the net balance alone. Flows into different asset types have different levels of stability and predictability: FDI is generally relatively less volatile, while portfolio investors can sell securities quickly. Similarly, cross-border bank lending can reverse quickly if banks become worried about liquidity or credit risk. Therefore, two countries with identical CA deficits can have very different vulnerabilities to a sudden stop.
Additionally, the composition of flows can provide evidence about the forces contributing to the imbalance. For instance, strong inflows into Treasuries may be related to global demand for safe assets, while strong FDI and equity flows may reflect investment opportunities.
4. What has driven the deterioration in the U.S. NIIP, over time and more recently?
Having examined the flows that have financed the U.S. CA deficits, we now turn to their cumulative effects on the U.S. net international investment position—the difference between external assets and liabilities.
One might expect the deterioration in the U.S. NIIP to largely reflect the accumulation of persistent current account deficits financed by net financial inflows. In recent years, however, valuation effects have been considerably more important.
Before proceeding with the details behind the main takeaway above, it helps to define the components of the change in NIIP:
$$\Delta$$NIIP = financial flows + valuation effects + other adjustments
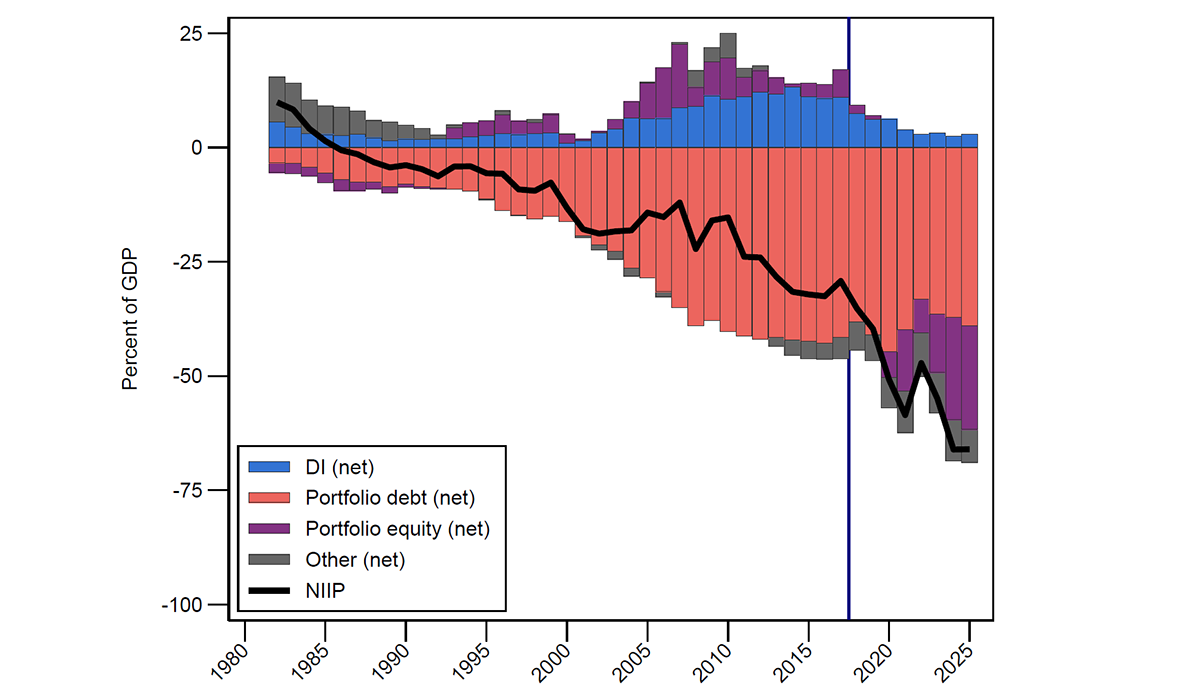
While running consistent CA deficits, the U.S. NIIP has been steadily deteriorating over time, with the much sharper deterioration over recent years driven primarily by falling net portfolio equity positions (Figure 6). Historically, net portfolio debt liabilities (pink bars) were partly offset by positive net direct investment (blue bars) and portfolio equity (purple bars) positions. However, the offset from direct investment has diminished since the 2017 Tax Cuts and Jobs Act removed the incentive for U.S. multinationals to accumulate cash in their foreign subsidiaries (Smolyansky, Suarez and Tabova, 2019), and the positive net portfolio equity position flipped to negative since 2020 amid U.S. equity market outperformance and strong foreign demand for U.S. equities. Notably, despite running large fiscal and current account deficits since 2020, U.S. net portfolio debt liabilities have declined as a share of GDP relative to pre-Covid.
Note: Direct investment and its contribution to the NIIP are measured at current cost. The vertical line marks the Tax Cuts and Jobs Act, enacted at the end of 2017.
Source: Bureau of Economic Analysis, International Investment Positions, and authors’ calculations, as of June 24, 2026.
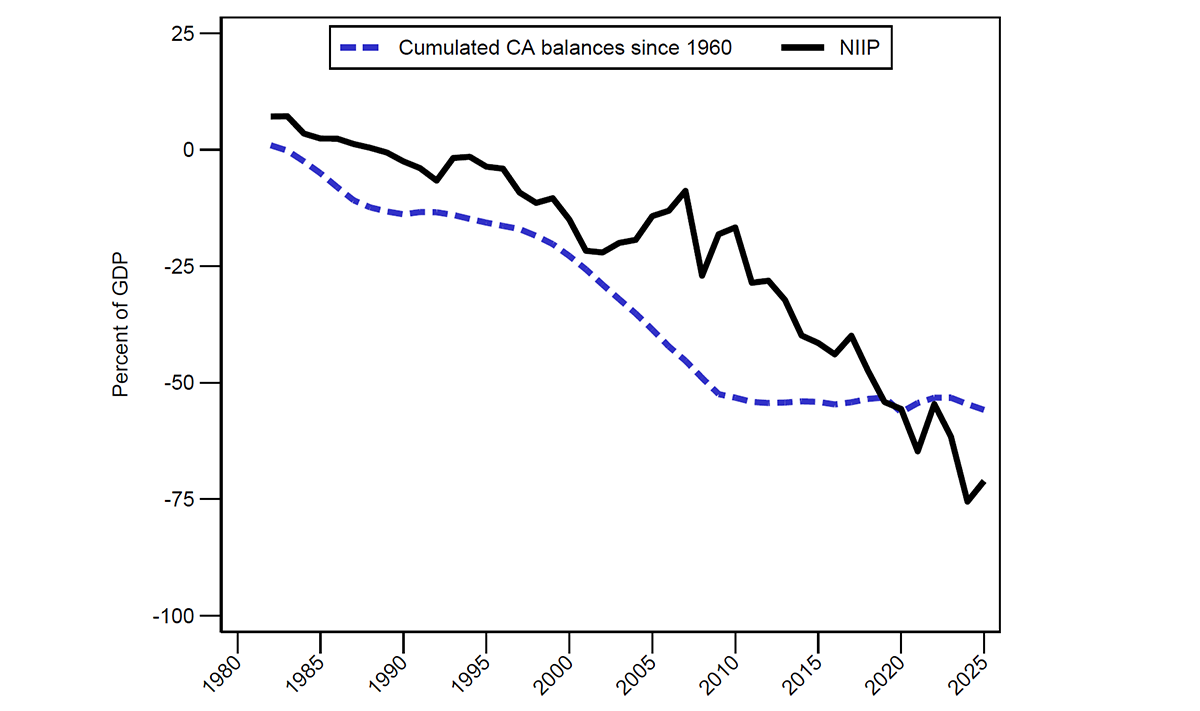
The U.S. equity outperformance that drove the net portfolio position negative also created a discrepancy between cumulative CA deficits and developments in net positions (Figure 7). Between 1983 and 2008, cumulative CA deficits became larger relative to GDP, driving the decline of the NIIP. Despite running consistent CA deficits after the GFC, cumulative deficits stabilized as a share of GDP, with these deficits roughly matched by nominal GDP growth. In the absence of valuation effects, the NIIP-to-GDP ratio would have stabilized as well. Instead, the NIIP has continued to deteriorate in recent years, driven entirely by valuation effects from U.S. equity market outperformance.
Source: Bureau of Economic Analysis, International Transactions and International Investment Position, as of June 24, 2026.
Even valuation effects depend on how assets and prices are measured. The appreciation of U.S. equity markets also created a measurement problem for the NIIP, specifically for direct investment positions (Bayoumi and Gagnon, 2025). There are three general approaches to valuing DI: historical cost (book value), current cost (inflation-adjusted replacement value), and market value (reflecting equity price changes). Consequently, U.S. stock market outperformance in recent years—especially driven by the tech sector—inflated the official measure of DI liabilities at market value, despite the limited exposure to the tech sector of U.S. subsidiaries of foreign multinationals.
Recognizing this mismeasurement problem, in June 2026, the Bureau of Economic Analysis adopted methodological improvements that revised substantially lower the official market value of U.S. DI liabilities.7 Table 1 shows that under the historical or current cost methods, U.S. net DI positions are slightly positive. Under the old market value measure, the net position had become substantially negative, largely corrected by the new methodology. This correction raised the net DI position by $5.6 trillion, or 18.7 percent of GDP, with a matching revision to the official market-value measure of the U.S. NIIP.
Table 1. U.S. Direct Investment Positions in 2025, $trillions
| DI Assets ($trillions) | DI Liabilities ($trillions) | Net DI positions ($trillions) | Net DI positions (% of GDP) | NIIP (% of GDP) | |
|---|---|---|---|---|---|
| Historical cost | 7.1 | 5.9 | 1.3 | 4.1 | -64.8 |
| Current cost | 8 | 7.1 | 0.9 | 2.9 | -66 |
| Market value, old method | 12.5 | 18.8 | -6.4 | -20.8 | -89.5 |
| Market value, new method | 12.4 | 13.1 | -0.7 | -2.1 | -71.1 |
Source: Bureau of Economic Analysis, U.S. direct investment positions at the end of 2025, on a directional basis. The old method for market value statistics were published March 25, 2026. All other series are as of June 24, 2026.
Understanding the drivers of the U.S. NIIP is critical to understanding and assessing the potential sources of risk to the U.S. economy and to foreign investors. For example, a rapid deterioration of a country's NIIP has traditionally been interpreted as a signal for growing financial vulnerabilities, especially when involving foreign-currency-denominated liabilities to foreigners. However, U.S. households and firms generally do not borrow in foreign currency, and rising equity liabilities represent risk-sharing with foreigners rather than defaultable obligations. Moreover, large gross equity positions imply that fluctuations in stock prices will become more important drivers of the U.S. NIIP relative to the effects of financial flows and CA deficits.
5. Which countries invest in the United States, and relatedly, are bilateral trade and financial flows correlated?
5.1. Which countries invest in the United States?
The geographic composition of foreign holdings provides a first indication that the countries investing in the United States are not necessarily the countries running the largest bilateral trade surpluses with it.
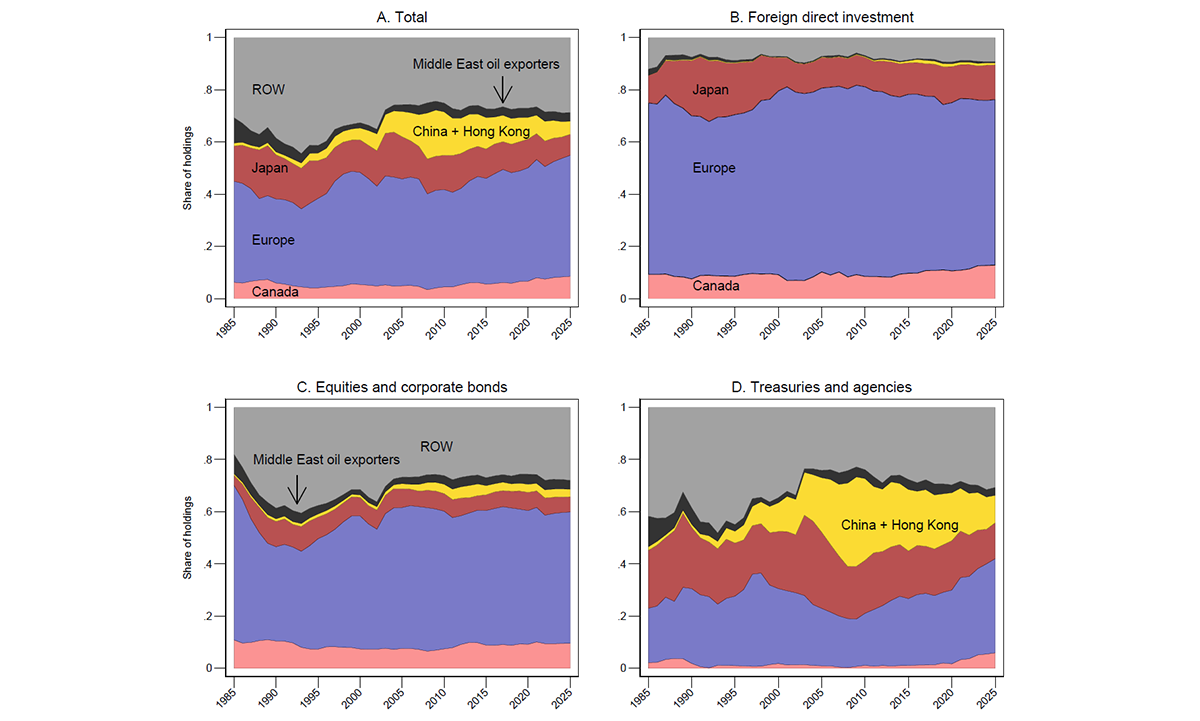
Focusing solely on foreign investment in the United States, Figure 8 shows that Europe has historically been the primary source of FDI (panel B) and a major holder of equities and corporate bonds (panel C). European investors hold a smaller but significant share of U.S. government bonds, including Treasuries and agency securities (panel D). Japan and Canada are also important investors in U.S. equities and corporate bonds, while Japan is a major holder of Treasuries.
Note: For FDI, the Middle East oil exporters are defined as the total Middle East minus Israel.
Source: Bureau of Economic Analysis, Foreign Direct Investment in the U.S.; Treasury International Capital; authors’ calculations.
China's investments in the United States have been concentrated in Treasuries, with little investment in FDI, equities or corporate bonds. China's share of U.S. government bond holdings expanded until the GFC but has gradually declined since.
Despite substantial CA surpluses from oil and gas exports, Middle Eastern countries have maintained relatively small holdings of U.S. assets, potentially reflecting either investment flows through financial centers or an overallocation to other regions. The rest of the world (ROW) has more substantial holdings of U.S. securities (both government and private), largely reflecting flows through Caribbean financial centers and other offshore investment hubs.
This geographic breakdown relies on the country of the immediate investor, and flows through investment hubs lead to geographic misattribution. Using more recent data on FDI by the country of the ultimate parent modestly reduces Europe's share and approximately doubles the shares from China and Middle East oil exporters. However, even with this correction, Europe remains the primary source of FDI into the U.S., and the shares from China and the Middle East remain small.
The immediate-investor problem outlined above is not merely a data caveat—it actually helps explain why bilateral financial geography is difficult to interpret, as financial centers break the apparent connection between the ultimate saver and the recorded investor country. In the next section we look precisely at the link between bilateral trade and financial flows.
5.2. Are bilateral trade and financial flows correlated?
A common perception is that countries running large trade surpluses with the United States also invest more in the United States. This is not true: while at the aggregate level, the current and financial accounts balance out, this identity need not and does not hold bilaterally.
And indeed, we find essentially no empirical relationship between bilateral current account and financial account balances. Across 21 U.S. trading partners over 2003–2025, the correlation is 0.078 in dollar terms and 0.004 when balances are scaled by GDP. The key implication is that trade deficits with one country are financed by net capital inflows from others.
Zooming on specific countries, shown in the scatter plots in Figure 9, offers additional insights. Although the United States has run large, persistent trade deficits with China (left panel, red diamonds), this has not generated consistent net financial inflows from China. Moreover, when scaled by partner country GDP (right panel), the large current and financial account flows with China are less exceptional, largely reflecting China's economic size. A similar story applies with other countries: while the United States has run both trade deficits and financial account deficits (net inflows) with Japan (dark red dots) and Germany (yellow squares), there is no clear correlation within-country between trade and financial flows with the U.S.
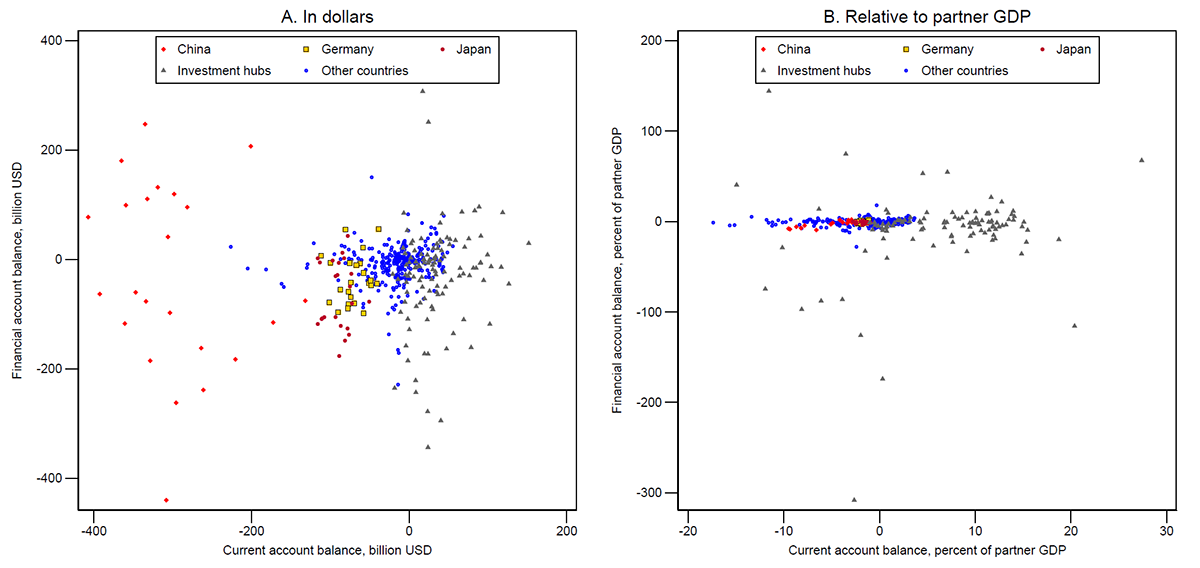
Note: The figures compare U.S. bilateral current account balances (x-axes) and financial account balances (y-axes) with 21 partner countries over 2003-2025 in dollar terms (left panel) and as % of GDP (right panel). The bilateral financial account balance is signed in terms of net outflows.
Source: Bureau of Economic Analysis, International Transactions; Haver, country GDP; authors’ calculations.
The link between bilateral trade (or current account) and financial account balances is relevant for the discussions of global imbalances because it tells us whether a bilateral trade deficit actually corresponds to bilateral financing. The result of no relationship between bilateral trade and financial flows underscores the distinction between bilateral trade balances and the aggregate saving-investment imbalance. Policies may change where the United States imports from without necessarily changing the aggregate current account balance or the global financial flows that finance it.
Conclusion
Global imbalances are often described in terms of current account surpluses and deficits. For the United States, however, looking at the financial side of the balance of payments reveals a more nuanced picture. The U.S. current account deficit necessarily has a financial counterpart, but the net capital inflow associated with that deficit is only a small part of much larger gross financial flows into and out of the United States. The composition, valuation, and geography of these flows contain information about the nature and risks of U.S. external imbalances that is not visible from the current account alone.
Several findings stand out. First, the financing of U.S. current account deficits has varied substantially over time. Foreign official purchases played an important role during some earlier periods, while private capital has dominated more recently. The composition of these flows also matters: FDI, portfolio investment, and cross-border banking flows differ considerably in their volatility, underlying motivations, and implications for financial stability.
Second, the deterioration of the U.S. net international investment position should not be interpreted simply as the cumulative result of current account deficits. In recent years, valuation effects—particularly the outperformance of U.S. equities—have accounted for much of the decline in the NIIP relative to GDP. The resulting increase in U.S. portfolio equity liabilities has different implications from an equivalent increase in portfolio debt liabilities: it increases the sensitivity of the measured external position to asset prices while also allowing gains and losses to be shared with foreign investors.
Third, the geography of trade and finance is strikingly different. Although the current and financial accounts must balance in aggregate, we find essentially no correlation between U.S. bilateral current account balances and bilateral financial balances. Countries with large trade surpluses vis-à-vis the United States are therefore not necessarily the countries financing the U.S. current account deficit. Capital is intermediated globally through financial centers, banks, institutional investors, and multinational firms.
These findings have implications for current policy debates. In particular, policies aimed at reducing individual bilateral trade deficits should not be assumed to reduce the aggregate U.S. external imbalance or the foreign financing associated with it. The bilateral composition of trade can change without materially changing either the U.S. saving-investment balance or global demand for U.S. assets. More broadly, assessing the sustainability and risks of U.S. external imbalances requires looking beyond the size of the current account deficit to the gross flows, asset composition, investor base, and valuation changes that determine how that deficit is financed and how the resulting external position evolves.
The financial lens therefore complements the traditional current-account perspective on global imbalances. Taken together, the two show not only the size and direction of international imbalances, but also how they are financed, where the associated exposures reside, and which policies are most likely to affect them.
References
Bayoumi, Tamim and Joseph E. Gagnon (2025). "The US trade deficit and foreign borrowing: How long can it continue?" Peterson Institute for International Economics working paper no. 25-14, https://www.piie.com/publications/working-papers/2025/us-trade-deficit-and-foreign-borrowing-how-long-can-it-continue.
Borio, Claudio and Piti Disyatat (2015). "Capital flows and the current account: Taking financing (more) seriously (PDF)." BIS Working Paper no. 525.
Caballero, Ricardo, Emmanuel Farhi and Pierre-Olivier Gourinchas (2008). "An Equilibrium Model of 'Global Imbalances' and Low Interest Rates." American Economic Review 98 (1).
Cesa-Bianchi, Ambrogio, Dan Christen, Peter Denton, Will Dison, Aydan Dogan, Ida Hjortsoe, Mark Joy, Jeremy Martin, Daniel Ostry, Roger Vicquery and Simon Whitaker (2026a). "Rethinking global imbalances: drivers, risks, and policy priorities (PDF)." Bank of England Staff Discussion Paper.
Cesa-Bianchi, Ambrogio, Andrea Ferrero, Luca Fornaro and Martin Wolf (2026b). "Industrial Policies, Global Imbalances and Technological Hegemony (PDF)." Barcelona School of Economics Working Paper no. 1558.
Chinn, Menzie and Eswar Prasad (2003). "Medium-term determinants of current accounts in industrial and developing countries: An empirical exploration." Journal of International Economics 59 (1), doi.org/10.1016/S0022-1996(02)00089-2.
Milesi-Ferretti, Gian Maria (2026a). "The return of global imbalances? The US case." Brookings blog post, April 14, 2026.
Milesi-Ferretti, Gian Maria (2026b). "A sizable, sensible downward revision to official measures of foreign direct investment in the U.S." Brookings blog post, July 27, 2026.
Mollerstrom, Johanna and David Laibson (2010). "Capital Flows, Consumption Booms and Asset Bubbles: A Behavioral Alternative to the Savings Glut Hypothesis." The Economic Journal, 120 (544), doi.org/10.1111/j.1468-0297.2010.02363.x.
Obstfeld, Maurice (2012). "Does the Current Account Still Matter?" American Economic Review, 102 (3).
Obstfeld, Maurice (2026). "Don't blame America's current account deficit on the dollar." Peterson Institute for International Economics, https://www.piie.com/blogs/realtime-economics/2026/dont-blame-americas-current-account-deficit-dollar.
Smolyansky, Michael, Gustavo Suarez and Alexandra Tabova (2019). "U.S. Corporations' Repatriation of Offshore Profits: Evidence from 2018." FEDS Notes.
Tabova, Alexandra and Francis E. Warnock (2026). "Preferred habitats and timing in the world's safe asset." Journal of International Economics, Volume 161, May 2026, doi.org/10.1016/j.jinteco.2026.104233.
Yan, Ho-don (2007). "Does capital mobility finance or cause a current account imbalance?" The Quarterly Review of Economics and Finance, 47 (1), doi.org/10.1016/j.qref.2005.08.001.
1. The U.S. began running notable current account deficits in 1983. After shrinking in the early 1990s, these deficits widened consistently between the late 1990s and 2007. After the Global Financial Crisis, U.S. current account deficits narrowed but persisted. Return to text
2. This has become particularly salient in recent years, as the U.S. CA deficit has widened markedly since the Covid pandemic (Milesi-Ferretti, 2026a). Return to text
3. Chinn and Prasad (2003) find evidence for both directions of causation. Return to text
4. In pure balance of payments accounting terms, the link matters because a CA imbalance necessarily has a financial counterpart. Return to text
5. As a result, gross financial inflows far exceed the CA deficit (grey) as because total financial inflows must finance both the CA deficit and U.S. investors' purchases of foreign assets. Return to text
6. For a detailed account of the evolution of foreign official and private investment in U.S. Treasuries, see Tabova and Warnock (2026). Return to text
7. In a contemporary to this note, Gian Maria Milesi-Ferretti (2026b) also discusses the BEA's methodological change in valuing direct investment in the U.S. official statistics. Return to text
Kallen, Cody, and Alexandra Tabova (2026). "Beyond the Current Account: U.S. Financial Flows and Global Imbalances," FEDS Notes. Washington: Board of Governors of the Federal Reserve System, October 09, 2026, https://doi.org/10.17016/2380-7172.4185.
Disclaimer: FEDS Notes are articles in which Board staff offer their own views and present analysis on a range of topics in economics and finance. These articles are shorter and less technically oriented than FEDS Working Papers and IFDP papers.