FEDS Notes
August 22, 2025
Corporate Cash Accumulation During the COVID-19 Pandemic
Elie Singer and Jie Yang
1. Introduction
Cash holdings of U.S. nonfinancial (publicly traded) corporations increased notably during the recent COVID-19 pandemic. As depicted in Figure 1, the median cash-to-assets ratio (black, solid line) – which remained near 12 percent in the years following the Great Financial Crisis (GFC) – surged to a historic high of over 20 percent in mid-2021. The average cash-to-assets ratio (blue, dashed line) exhibited a similar rapid increase, surpassing 30 percent in 2021. In this note, we investigate the dynamics and cross-sectional variation of cash accumulation during the COVID-19 pandemic among U.S. nonfinancial firms. Understanding heterogeneity in savings behavior is particularly relevant in the context of the subsequent monetary tightening, as prior research suggests that cash can buffer against higher borrowing costs, and that the same firms which typically hold more cash—those that also experience greater difficulties raising financing from external sources—may also be more sensitive to higher interest rates.
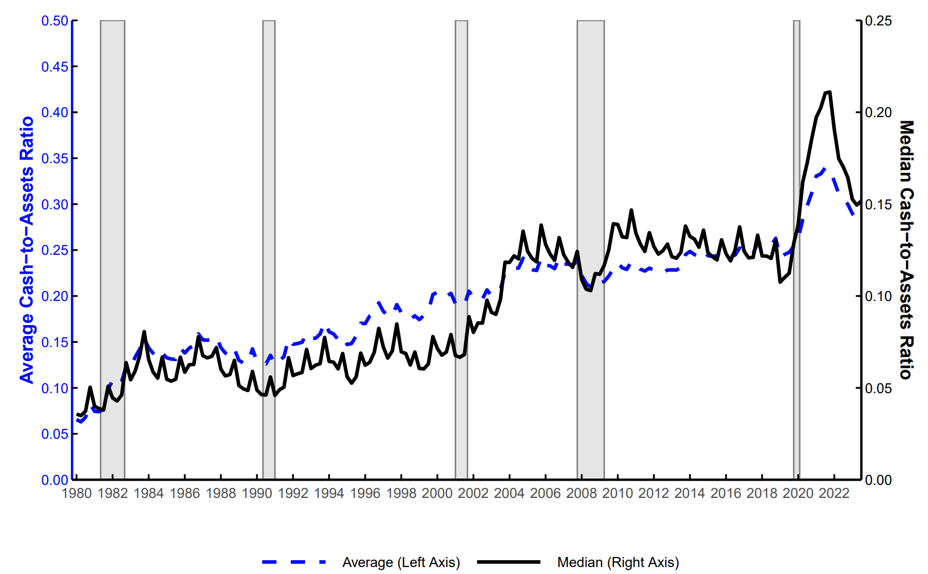
Notes: Sample includes all U.S. public, nonfinancial, non-utility firms with positive total assets. The shaded bars indicate periods of business recession as defined by the National Bureau of Economic Research (NBER): July 1981–November 1982, July 1990–March 1991, March 2001–November 2001, December 2007–June 2009, and February 2020–April 2020.
Source: S&P Compustat North America.
We find that, on average, during the COVID-19 pandemic, firms identified as being more financially constrained–defined as having restricted access to external funding markets at fair market borrowing costs–accumulated cash more rapidly and held onto cash for longer than firms identified as being less constrained. The additional savings by more constrained firms was larger during the Pandemic than in any other period in recent history. By contrast, within the subset of industries most adversely impacted by the pandemic, the opposite held true: more constrained firms within these "hard-hit" industries accumulated cash at a slower pace than less constrained firms, presumably reducing cash savings in response to immediate liquidity needs. By comparing the behavior of constrained firms in the hard-hit industries against the broader sample, we draw three important conclusions: (1) earlier in the Pandemic period, on average, both financially constrained as well as unconstrained firms accelerated their cash holdings amid elevated economic uncertainties and fears of recession, (2) the majority of more constrained firms–possibly being slow to adjust to the improving macroeconomic landscape–ended up with substantially higher cash holdings later in the Pandemic, and (3) for firms in the hard-hit industries, the most constrained firms were unable to accumulate cash as in the broader sample, likely due to immediate liquidity needs. These findings highlight significant non-linearities in the relationship between financial constraints and cash accumulation and retention during this period.
Our work contributes to the growing understanding of how Pandemic-era uncertainty led to cash accumulations among businesses and households.1 Our findings suggest that firms typically more vulnerable to higher interest rates had amassed significant cash buffers immediately prior to the onset of rate hikes in 2022. This note also contributes to the literature on the impact of financial constraints on corporate cash policies, highlighting the non-linear patterns of cash management by financially constrained firms during a period of economic uncertainty and stress.
2. Background and Motivation
2.1 Two Distinct Pandemic Periods
Taking the corporate manager's perspective, we separate the COVID-19 Pandemic into two periods characterized by evolving macroeconomic news and financial market conditions that may impact savings behavior in differing ways. The first period, or "early-Pandemic," spanned from 2020Q1 to Q4 and was defined by high uncertainty regarding the duration and extent of the pandemic and its macroeconomic consequences.2 The second period, or "late-Pandemic," spanned from 2021Q1 to Q4 and was characterized by the gradual relaxation of many pandemic-induced pressures and somewhat reduced uncertainties.3 We separate our subsequent analysis into early- and late-Pandemic periods as defined above to account for potential differences in the drivers of firms' cash savings behaviors across these periods.
2.2 Financial Constraints and Cash Holdings
Extensive research has examined why firms choose to retain earnings as liquid assets at the opportunity cost of investing or paying them out to shareholders in the form of dividends or share repurchases. One well-established stream of literature, hereby referred to as "precautionary savings motives," posits that during normal economic periods firms facing greater financial constraints should save more than their less constrained counterparts to safeguard against immediate and future liquidity needs given their limited access to external financing.4
The evolution of corporate cash holdings among constrained firms during economic downturns, however, remains less clear. On the one hand, the intensification of precautionary savings motives from heightened uncertainty during stressed times suggest that constrained firms might increase cash savings by even more relative to their unconstrained counterparts to build a more resilient financial buffer.5 On the other hand, constrained firms are typically more exposed to cyclical downturns and the first to be denied access to funding markets and/or experience larger drops in revenue during these same periods, thereby limiting their ability save.6 We will refer to pressures that reduce cash savings as "immediate liquidity needs." Our study examines these competing frameworks during the COVID-19 pandemic by studying cross-sectional differences in corporate cash accumulation.
3. Corporate Cash Holdings During the Pandemic
Our study uses quarterly firm accounting and financial data from S&P Compustat. We restrict our sample to U.S. nonfinancial, non-utility firms with positive reported assets from 2000 to 2021. As discussed above in Section 2.1, we define 2020Q1 through 2020Q4 as the "early-Pandemic" period and 2021Q1 through 2021Q4 as the "late-Pandemic" period, to distinguish between the different corporate outlooks as the pandemic evolved. To proxy for a firm's degree of financial constraints, we follow the approach described in Williamson and Yang (2021) to construct a composite financial constraints score (FC) comprised of the Whited and Wu (WW, 2006) index, Hadlock and Pierce's (2010) size-age (SA) index, and credit ratings.7
3.1 Cash Savings
First, we examine how financially constrained and unconstrained firms adjusted their cash savings during the early- and late- Pandemic periods, relative to their historical averages over the past two decades using a difference-in-difference empirical approach. Specifically, in Equation (1), we regress firm-level 4-quarter changes in cash holdings, defined as the ratio of cash over assets, on the firm's lagged financial constraints score (FC), time indicators for the early- and late- Pandemic periods, and their interaction term, along with control variables and fixed effects. We control for both the lagged level of cash holdings and the change in non-liquid assets (total assets minus cash) over the same period to ensure our results are not driven by changes in size.
Equation 1.
$$$$ \text{CHE}^{4qtr}_{i, (t, t+4)} = \beta_1\text{FC}_{i,t} + \beta_2\text{Pand}_{early/late} + \beta_3\text{FC}_{i,t}*\text{Pand}_{early/late} + \beta_4 X_{i,t} + \gamma_{i} $$$$
Notes: $$\text{CHE}^{4qtr}_{i, (t, t+4)}$$ is the 4-quarter change in cash holdings for firm $$i$$ between quarter $$t$$ and $$t+4$$; $$\text{FC}_{i,t}$$ is the composite financial constraints score for firm $$i$$ in quarter $$t$$; $$\text{Pand}_{early}$$ and $$\text{Pand}_{late}$$ are indicator variables for the early- and late-Pandemic periods; $$X$$ is a vector of firm characteristic control variables; $$\gamma$$ is a vector of industry fixed effects.
The coefficients on the interaction term between the lagged FC score and the early- or late-Pandemic indicators, $$\beta_3$$, capture the difference in savings by more constrained firms relative to their less constrained counterparts during the two respective periods. We interpret positive coefficients as consistent with precautionary savings motives having a larger impact than immediate liquidity needs among constrained firms and negative coefficients as supportive of the opposite.
Columns (1) and (2) of Table 1 present our results from Equation (1) for the early-and late-Pandemic periods, respectively.8 First, we find that, on average, more constrained firms saved more cash relative to less constrained firms over the past two decades, as shown by the positive and significant coefficients on the FC score in both columns. This result is consistent with the precautionary savings motives framework. Next, we find a positive and significant coefficient on the early-Pandemic indicator (column 1) and a negative and significant coefficient on the late-Pandemic indicator (column 2). We interpret these results as supporting strong precautionary savings from the high uncertainty and recession-fears in early-Pandemic among all firms–including less constrained firms–followed by a reduction in those uncertainties as advancements in vaccines and reopening plans mitigated fears of a prolonged adverse outcome.
Table 1. Changes in Cash Holdings by Financial Constraints During the COVID-19 Pandemic
| Term | Dependent Variable: $$ \text{CHE}^{4qtr}_{i, (t, t+4)} $$ | |||
|---|---|---|---|---|
| (Eq. 1) | (Eq. 2) | |||
| (1) | (2) | (3) | (4) | |
| $$ \text{FC}_{i,t} $$ | 0.002 | 0.002 | 0.002 | 0.002 |
| (***) | (***) | (***) | (***) | |
| $$ \text{Pand}_{early} $$ | 0.017 | 0.011 | ||
| (**) | (*) | |||
| $$ \text{FC}_{i,t}$$ * $$ \text{Pand}_{early} $$ | 0.002 | 0.003 | ||
| (*) | (***) | |||
| $$ \text{Pand}_{late} $$ | -0.030 | -0.032 | ||
| (***) | (***) | |||
| $$ \text{FC}_{i,t}$$ * $$ \text{Pand}_{late} $$ | 0.011 | 0.011 | ||
| (***) | (***) | |||
| $$ \text{FC}_{i,t}$$ *$$\text{HH}_i$$ | -0.001 | -0.001 | ||
| $$ \text{Pand}_{early} $$ *$$\text{HH}_i$$ | 0.053 | |||
| (***) | ||||
| $$ \text{FC}_{i,t} $$ *$$ \text{Pand}_{early} $$ *$$\text{HH}_i$$ | -0.009 | |||
| (***) | ||||
| $$ \text{Pand}_{late} $$ *$$\text{HH}_i$$ | 0.028 | |||
| (*) | ||||
| $$ \text{FC}_{i,t} $$ *$$ \text{Pand}_{late} $$ *$$\text{HH}_i$$ | -0.007 | |||
| (*) | ||||
| Adj. $$ R^2 $$ | 0.29 | 0.29 | 0.29 | 0.29 |
| Industry F.E. | Y | Y | Y | Y |
| Obs. | 375,383 | 375,536 | 375,383 | 375,536 |
Notes: Table 1 shows the results of Equations 1 (Columns 1 and 2) and 2 (Columns 3 and 4). Sample includes US public nonfinancial, non-utility firms with positive total assets from 2000Q1 to 2021Q4. Data are measured at the quarterly frequency. The dependent variable is the four-quarter change in the ratio of cash to assets. FC is the composite financial constraints score as defined in Williamson and Yang (2021), calculated by combining the Hadlock and Pierce (2010) Size-Age index, Whited and Wu (2006) index, and S&P credit ratings. $$ \text{Pand}_{early} $$ and $$ \text{Pand}_{late} $$ are time indicators for 2020 and 2021 respectively. $$\text{HH}_i$$ is an indicator for heavily-impacted industries during the COVID-19 Pandemic which include Airlines; Hotels, Restaurants & Leisure; Energy Equipment & Services; Automobiles; Auto Components; and Specialty Retail. Additional controls (not shown) include beginning-of-period cash, and the change in non-liquid assets (total assets minus cash and cash equivalents) over the period. GICS 6-digit industry fixed effects and clustered standard errors are used.
Source: S&P Compustat North America.
Turning to the coefficients on the interaction terms between the FC score and each Pandemic period, we find that the additional savings by more constrained firms was larger during both Pandemic periods than other periods in the rest of the sample. Our result suggests that, on average, increased precautionary savings outweighed immediate liquidity needs during the Pandemic for more constrained firms. Importantly, the reduction in cash savings as concerns eased (as represented by the negative coefficient on the late-Pandemic indicator) did not apply to the most constrained firms (as represented by the large positive coefficient on the interaction term between the FC score and the late-Pandemic indicator). Instead, as shown in Figure 2, the most constrained firms continued to accumulate cash even while less constrained firms began lowering cash holdings, leading to the notably larger differential observed during the late-Pandemic period. Our interpretation is that constrained firms were slower to react to improving macroeconomic conditions during this period and therefore continued to save at rates consistent with a gloomy economic outlook.
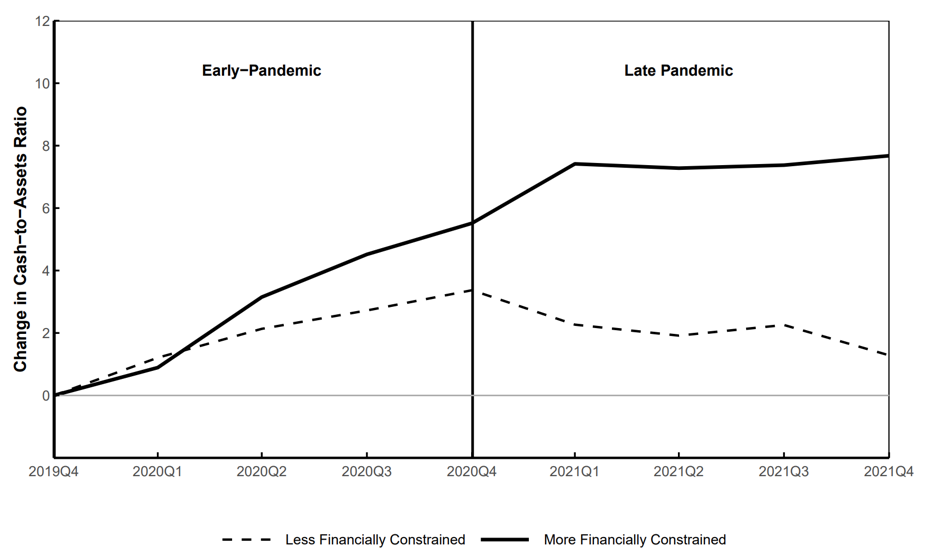
Notes: Sample includes all U.S. nonfinancial, non−utility firms with positive total assets. Firms are classified as being more (less) financially constrained if their 4-quarter lagged FC score among the top third (bottom) of the sample in a given quarter. FC is the composite financial constraints score as defined in Williamson and Yang (2021), calculated by combining the Hadlock and Pierce (2010) Size-Age index, Whited and Wu (2006) index, and S&P credit ratings.
Source: S&P Compustat North America.
Interestingly, we find notably smaller differences in cash savings behavior between more and less constrained firms during the early-Pandemic period than during the late-Pandemic, as shown in columns (1) and (2) of Table 1 and Figure 2. This is puzzling because uncertainty was higher during the early-Pandemic and we therefore expect precautionary motives to also be stronger. One explanation is that during periods of extreme stress, cross-sectional measures of financial constraints ceased to be meaningful as all but the highest rated firms temporarily became heavily constrained. Several studies support this idea, documenting that with a few exceptions only AAA-AA rated corporate bond issuers where able to come to market during the first weeks of the pandemic and even highly rated IG firms drew heavily on their credit lines (something only highly constrained firms typically do).9 The positive coefficient on the early-Pandemic indicator is consistent with this interpretation, suggesting previously less constrained firms rapidly increased their savings, behaving more like their constrained counterparts.
3.2 Hard-hit Industries
While all industries experienced high uncertainty regarding the duration and extent of the pandemic in 2020, generally speaking, only a subset of industries–predominately those in service and transportation–which we call the "hard-hit" industries, suffered extensively from supply-chain issues and pandemic-related shutdowns. The heterogeneous impact of the Pandemic on sales across industries coupled with the unexpected nature of the policy responses of mid-2020 provides a natural experiment for isolating the effect of uncertainty on cash savings from the direct impact of the economic shock itself. While all firms experienced high uncertainty, the anticipated severe adverse shock only materialized for firms in the hard-hit group (firms outside the hard-hit group still experienced a shock, just not as severe).
We therefore introduce an indicator variable classifying firms by industry into two groups: those heavily impacted by the pandemic and those that were not. We classify the following 6-digit GICS industries as hard-hit industries: Airlines, Hotels, Restaurants & Leisure, Energy Equipment & Services, Automobiles, Auto Components, and Specialty Retail.10 We then repeat our previous analysis studying the 4-quarter changes in cash savings using a model with triple interaction terms between the two pandemic periods, financial constraints index, and this new hard-hit industries indicator in Equation (2). The triple interaction term captures differences in savings between more constrained firms and their less constrained counterparts of firms in the hard-hit industries (which experienced high uncertainty and a large cashflow shock) from those in less impacted industries (which, generally speaking, only experienced high uncertainty).
Equation 2.
$$$$ \text{CHE}^{4qtr}_{i, (t, t+4)} = \beta_1\text{FC}_{i,t} + \beta_2\text{HH}_i + \beta_3\text{Pand}_{early/late} + \\ \beta_4\text{FC}_{i,t}*\text{Pand}_{early/late} + \beta_5\text{FC}_{i,t}*\text{HH}_i + \beta_6*\text{Pand}_{early/late}*\text{HH}_i + \\ \beta_7\text{FC}_{i,t}*\text{HH}_i*\text{Pand}_{early/late} + X_{i,t} + \gamma_{i} $$$$
Notes: $$\text{CHE}^{4qtr}_{i, (t, t+4)}$$ is the 4-quarter change in cash holdings for firm $$i$$ between quarter $$t$$ and $$t+4$$; $$\text{FC}_{i,t}$$ is the composite financial constraints score for firm $$i$$ in quarter $$t$$; $$\text{HH}_i$$ is an indicator variable equal to 1 if firm $$i$$ was in an industry hard-hit by the Pandemic and 0 otherwise; $$\text{Pand}_{early}$$ and $$\text{Pand}_{late}$$ are indicator variables for the early and late Pandemic periods; $$X$$ is a vector of firm characteristic control variables; $$\gamma$$ is a vector of industry fixed effects.
We present the results from Equation (2) in Columns (3) and (4) of Table 1. First, we find that firms in hard-hit industries previously classified as less constrained significantly increased their cash savings relative to less constrained firms in less impacted industries during both the early- and late-Pandemic periods, supporting the notion that these firms effectively became more constrained during the Pandemic and engaged in more intense precautionary savings.
Turning to the triple interaction terms, our analysis reveals a significant, negative coefficient on the triple interaction among the financial constraints score, the pandemic period indicators, and the indicator variable for hard-hit industries. This result is visualized in Figure 3, which shows the change for each one point increase in our financial constraints score grouped by hard-hit or not-hard-hit in both Pandemic periods. We show that in both the early- and late-Pandemic, constrained firms in the hard-hit industries (red bars) exhibited lower differential savings relative to unconstrained firms compared with firms outside of these industries (grey bars). In the early Pandemic, we observe that constrained firms in the hard-hit industries saved less than unconstrained firms (as shown by the negative bar in Figure 2), exhibiting behaviors consistent with a reduced savings capacity from immediate liquidity needs. We interpret this group as the most constrained set of firms, revealing an important non-linearity in the relationship between financial constraints and savings behavior during this period. While higher financial constraints are associated with increased cash savings up to a point, this relationship reversed for the most constrained firms, which drew down on cash savings, presumably to meet immediate obligations.
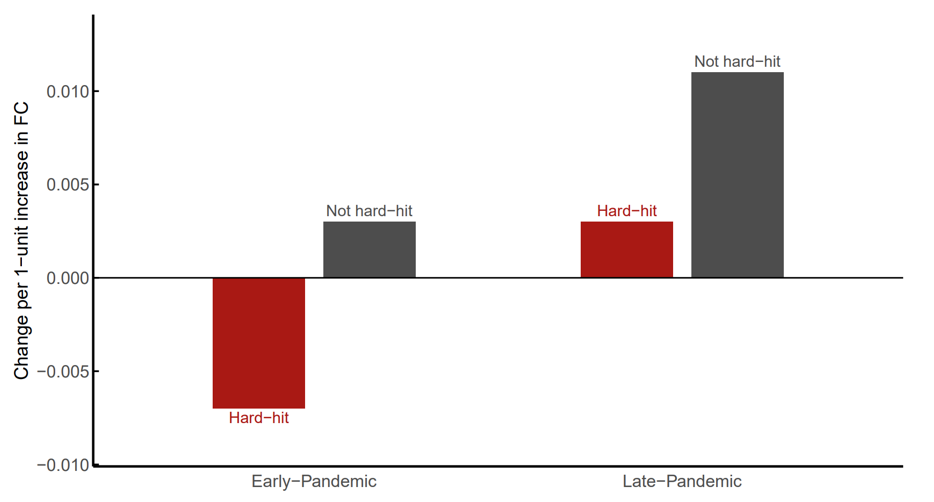
Notes: Figure 3 shows the regression results from Columns (3) and (4) of Table 1. Sample includes all U.S. nonfinancial, non−utility firms with positive assets. Bars show the estimated change in the cash-to-assets ratio per 1-unit increase in the financial constraints (FC) score during the early- and late-Pandemic periods by industry exposure. Hard-hit industries are those heavily−impacted during the COVID−19 Pandemic which include Airlines; Hotels, Restaurants & Leisure; Energy Equipment & Services; Automobiles; Auto Components; and Specialty Retail.
Source: S&P Compustat North America.
Overall, our findings show that the observed cash accumulation patterns during the pandemic are consistent with the precautionary savings motive, wherein firms save to insure against potential adverse cash flow shocks. In this context, the cash flow shock experienced by hard-hit industries can be viewed as the very outcome that precautionary cash balances were intended to buffer. Our findings support the notion that firms facing heightened uncertainty tended to accumulate cash, whereas those that actually experienced a severe negative cash flow shock (the hard-hit group) saw less accumulation—likely because the shock directly limited their ability to save. More broadly, this pattern suggests that a key feature of the Pandemic period was that many firms accumulated precautionary cash in anticipation of an adverse economic outcome that ultimately was less severe than originally feared. This resulted in unusually high cash balances, particularly for more constrained firms, at the end of 2021.
5. Conclusion
This note explored the dynamics of cash accumulation among U.S. nonfinancial firms during the COVID-19 pandemic, highlighting the significant role that financial constraints played in shaping corporate cash holdings. We found that firms previously identified as financially constrained accumulated cash at a significantly higher rate than their less constrained counterparts during the Pandemic, emphasizing the importance of precautionary motives driven by heightened uncertainty. Additionally, more constrained firms continued to accumulate cash at a higher rate during the later Pandemic even when less constrained firms began to deplete their cash balances, resulting in substantial difference in cash holdings by the end of 2021.
The implications of these findings are particularly relevant in environments of rising interest rates or limited capital supply as higher cash reserves can act as buffers against the impact of higher borrowing costs. This is especially important for financially constrained firms, which typically face higher borrowing costs and more significant challenges in accessing capital than their unconstrained counterparts. By maintaining elevated cash levels, these firms potentially mitigate the adverse effects of higher interest rates on their operations and investment capacities. Further research is required to empirically test these hypotheses.
References
Abdelrahman, H. and L.E. Oliveira, 2023, "The Rise and Fall of Pandemic Excess Savings", Federal Reserve Bank of San Francisco Economic Letter.
Acharya, V.V. and S. Steffen, 2020, "The Risk of Being a Fallen Angel and the Corporate Dash for Cash in the Midst of COVID", Review of Corporate Finance Studies, 9 (3), pp. 430-471, https://doi.org/10.1093/rcfs/cfaa013.
Aladangady, A., D. Cho, L. Feiveson, and E. Pinto, 2022, "Excess Savings during the COVID-19 Pandemic", FEDS Notes. Washington: Board of Governors of the Federal Reserve System, October 21, 2022.
Almeida, H., M. Campello, and M.S. Weisbach, 2004, "The Cash Flow Sensitivity of Cash", Journal of Finance, 59 (4), pp. 1777-1804, https://doi.org/10.1111/j.1540-6261.2004.00679.x.
Bates, T.W., K.M. Kahle, and R.M. Stulz, 2009, "Why Do U.S. Firms Hold So Much More Cash than They Used To?", Journal of Finance, 64 (5), pp. 1985-2021, https://doi.org/10.1111/j.1540-6261.2009.01492.x.
Bräuning, F., J.L. Fillat, and G. Joaquim, 2023, "Firms' Cash Holdings and Monetary Policy Transmission", Federal Reserve Bank of Boston Current Policy Perspective, October 12, 2023.
Campello, M., J.R. Graham, C.R. Harvey, 2010, "The Real Effects of Financial Constraints: Evidence from a Financial Crisis", Journal of Financial Economics, 97 (3), pp. 470-487, https://doi.org/10.1016/j.jfineco.2010.02.009.
Covas, F., and W. J. Den Haan, 2011, "The Cyclical Behavior of Debt and Equity Finance", American Economic Review, 101 (2), pp. 877-899.
Duchin, R., O. Ozbas, and B.A. Sensoy, 2010, "Costly External Finance, Corporate investment, and the Subprime Mortgage Credit Crisis", Journal of Financial Economics, 97 (3), pp. 418-435, https://doi.org/10.1016/j.jfineco.2009.12.008.
Halling, M., J. Yu, and J. Zechner, 2020, "How Did COVID-19 Affect Firms' Access to Public Capital Markets?", The Review of Corporate Finance Studies, 9 (3), pp. 501-533, https://doi.org/10.1093/rcfs/cfaa008.
Han S. and J. Qiu, 2007, "Corporate Precautionary Cash Holdings," Journal of Corporate Finance, 13 (1), pp 43-57, https://doi.org/10.1016/j.jcorpfin.2006.05.002.
Hadlock , C.J. and J.R. Pierce, 2010, "New Evidence on Measuring Financial Constraints: Moving Beyond the KZ Index", The Review of Financial Studies, 23 (5), pp. 1909-1940, https://doi.org/10.1093/rfs/hhq009.
Ivashina, V. and D. Scharfstein, 2010, "Bank Lending During the Financial Crisis of 2008", Journal of Financial Economics, 97 (3), pp. 319-338, https://doi.org/10.1016/j.jfineco.2009.12.001.
Opler T., L. Pinkowitz, R. Stulz, and R. Williamson, 1999, "The Determinants and Implications of Corporate Cash Holdings", Journal of Financial Economics, 52, pp. 3-46, https://doi.org/10.1016/S0304-405X(99)00003-3.
Sun, Z. and Y. Wang, 2015, "Corporate Precautionary Savings: Evidence from the Recent Financial Crisis", The Quarterly Review of Economics and Finance, 56, pp. 175-186, https://doi.org/10.1016/j.qref.2014.09.006.
Whited, T.M. and G. Wu, 2006, "Financial Constraints Risk", The Review of Financial Studies, 19 (2), 99. 531-559, https://doi.org/10.1093/rfs/hhj012.
Williamson, R. and J. Yang, 2021, "Tapping into Financial Synergies: Alleviating Financial Constraints Through Acquisitions", Journal of Corporate Finance, 68, pp. 1019-1047, https://doi.org/10.1016/j.jcorpfin.2021.101947.
1. Bräuning, Fillat, and Joaquim (2023) study how US firms used savings from the COVID-19 pandemic period to finance investment during 2022-2023. In addition, several recent studies identify excess savings by households, such as Aladangady, Cho, Feiveson, and Pinto (2022) and Abdelrahman and Oliveira (2023). Return to text
2. While multiple fiscal and monetary stimulus and relief packages went into effect early in 2020 providing liquidity support for capital markets and emergency loans for US businesses, a high degree of uncertainty remained throughout the year regarding how long the pandemic restrictions would last as well as a multitude of concerns impacting business (including supply chain disruptions, work from home arrangements, etc.). Return to text
3. The first COVID-19 vaccines were announced in late 2020, with the first implementations in the United States starting in December 2020. Vaccines were distributed in mass throughout early 2021, and major US states suspended stay-at-home ordinances and reopened their economies throughout the spring/summer. While the Pandemic was not declared over until May 2023 by the World Health Organization, we take the end of 2021 as a reasonable point at which pandemic-related concerns for businesses and the US economy had diminished greatly and the last period before inflation became the primary concern and uncertainty for corporate managers. Return to text
4. See, e.g., Opler, Pinkowitz, Stulz, and Williamson (1999), Almeida, Campello, and Weisbach (2004), Han and Qiu (2007), and Bates, Kahle, and Stulz (2009), among many others. Return to text
5. Almeida, Campello, and Weisbach (2004) theorize that constrained firms should save an even greater proportion of their cash flows during downturns and empirically verify this to be the case following macroeconomic shocks. Return to text
6. Covas and Haan (2011) show that debt and equity issuance are more cyclical for smaller firms. Moreover, Campello, Graham, and Harvey (2010), Duchin, Ozbas, and Sensoy (2010), and Ivashina and Scharfstein (2010), among others, document that during the Great Financial Crisis, financially constrained firms were more likely to exhaust their cash holdings, draw down their funding reserves, and reduce investments they faced greater difficulty in accessing external capital markets. Relatedly, Sun and Wang (2015) find that for the GFC firms saved less in the first stage of the crisis and more in the later stage. This effect was more pronounced for financially constrained firms. Return to text
7. Although the WW and SA indices are highly correlated with firm size, they also capture additional dimensions of financial constraints proxied by age, leverage, sales, and propensity to pay dividends among other variables. See Whited and Wu (2006) and Hadlock and Pierce (2010) for more details and Williamson and Yang (2021) for details on the construction of the composite financial constraints score. Credit ratings are from Standard and Poor's. Return to text
8. Our analysis includes both the 2001 and 2007-2008 recessions. Results are similar when excluding these recession periods from our analysis. Return to text
9. See, e.g., Acharya and Seffen (2020), Halling, Yu, and Zechner (2020). Return to text
10. The firms we identify as being hard-hit by the Pandemic are in the middle of the distribution of our financial constraints measure. That is, ex-ante, they are not more or less likely to be classified as financially constrained relative to the full sample. This suggests that the pandemic was truly a surprising and exogenous event for these firms. Return to text
Singer, Elie, and Jie Yang (2025). "Corporate Cash Accumulation During the COVID-19 Pandemic," FEDS Notes. Washington: Board of Governors of the Federal Reserve System, August 22, 2025, https://doi.org/10.17016/2380-7172.3736.
Disclaimer: FEDS Notes are articles in which Board staff offer their own views and present analysis on a range of topics in economics and finance. These articles are shorter and less technically oriented than FEDS Working Papers and IFDP papers.