FEDS Notes
February 11, 2022
Delinquency Rates and the “Missing Originations” in the Auto Loan Market
Vitaly M. Bord and Lucas M. Nathe1
Introduction
One of the surprising characteristics of the economic downturn induced by the COVID-19 pandemic is that delinquency rates in most consumer credit markets have remained low both during the downturn and the subsequent recovery. The existing literature has emphasized the roles that forbearance policies and various government stimulus programs played in helping households meet their debt obligations (Dettling and Lambie-Hanson, 2021; Bakshi and Rose, 2021). In this note, we examine an additional factor that has contributed to low delinquency rates: a drop in originations of new loans to risky borrowers most likely to become delinquent.
Figure 1 presents seasonally adjusted auto loan delinquency rates from the Federal Reserve Bank of New York Consumer Credit Panel/Equifax (hereafter CCP), a nationally representative, anonymized 5 percent random sample of U.S. consumers with Equifax credit report data.2 As the figure shows, delinquency rates fell markedly at the start of the pandemic and have remained low even as other factors that likely support these low rates may have changed.3
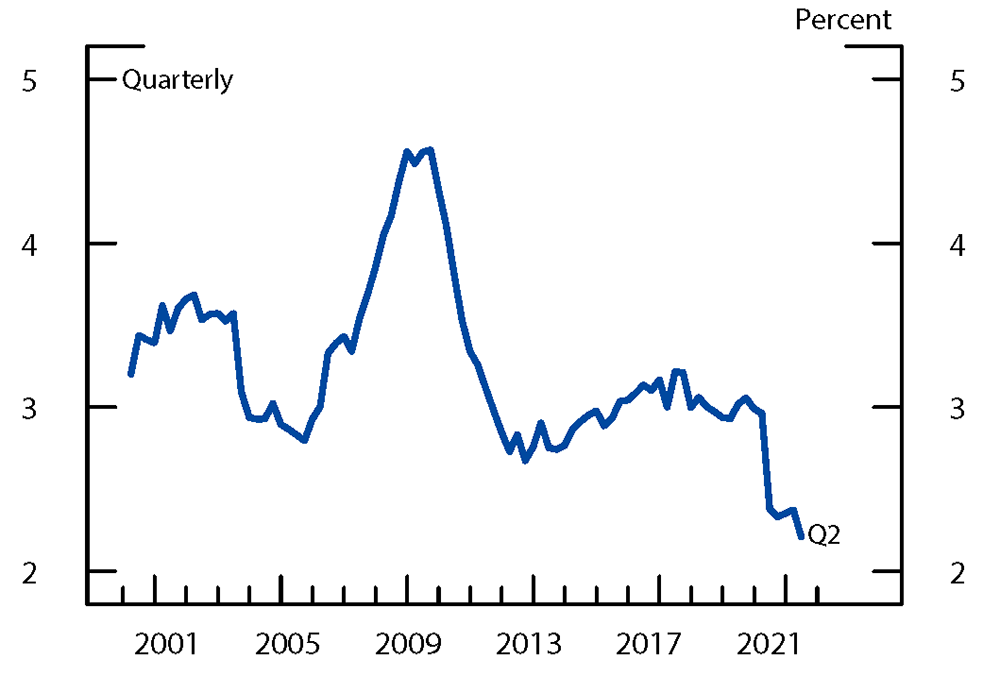
Note: Delinquency is at least 30 days past due, excluding severe derogatory loans. Delinquency rate is seasonally adjusted. Credit scores are lagged four quarters.
Source: Federal Reserve Bank of New York Consumer Credit Panel/Equifax.
Using loan-level data from the CCP, we examine how the reduction in originations among lower-credit-score applicants during 2020 can explain the low and stable delinquency rates. We find that originations plummeted among the lowest-credit-score borrowers at the start of the pandemic and have remained low, whereas originations for higher credit score borrowers have recovered. Consistent with lenders not originating the riskiest loans, delinquency rates among newly originated loans fell sharply during the pandemic and by more than delinquency rates on existing loans. Overall, we estimate that these "missing originations"—low-credit-score auto loans, many of which would have become delinquent if they had been originated—can explain up to 30 percent of the decline in delinquency rates from December 2019 to June 2021.
Further, we present suggestive evidence consistent with credit supply, rather than demand, driving the missing originations. While auto loan originations declined for low-credit-score borrowers during the pandemic, inquiries for credit increased for these borrowers. Finally, we examine concerns that the broad availability of mortgage and student loan forbearance made it more difficult for lenders to gauge the riskiness of prospective borrowers with these kinds of debts and resulted in a broad contraction of credit to these borrowers. Specifically, we examine whether low-credit score borrowers with existing mortgage or student loan debt were less likely to obtain new auto loans. We find the opposite; low-credit-score borrowers with existing mortgage or student loan accounts were relatively more likely to take out new auto loans during the pandemic than comparable borrowers without those accounts.
New Originations in the Auto Loan Market
The market for auto loans is large, with approximately $1.4 trillion of loans outstanding at the end of 2020. Notably, approximately 40 percent of auto loan balances comprise loans originated in the previous 12 months; thus, even short-lasting dislocations in auto loan originations can have large aggregate effects on the entire market.4 As Figure 2 shows, the volume of auto loan originations dropped sharply in the first two quarters of 2020 before rebounding in the second half of the year and into 2021.5 Further, both the decline in originations at the start of the pandemic, and the subsequent rebound varied by credit score.
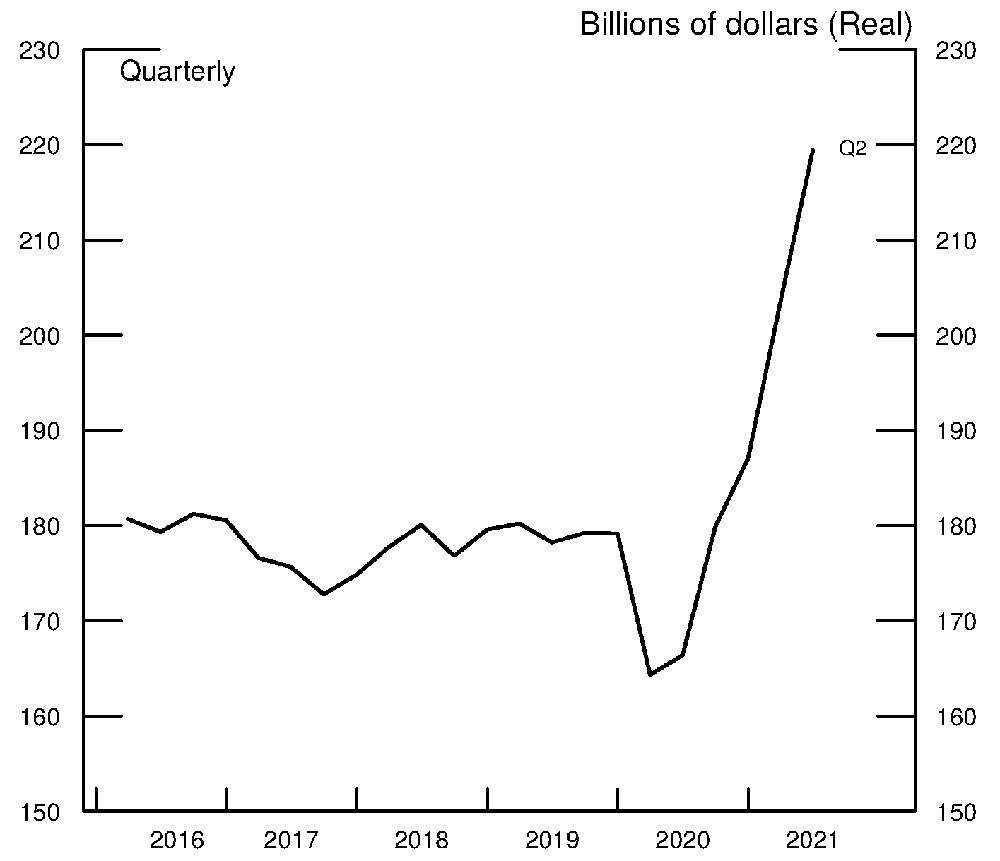
Note: Data are seasonally adjusted. Last three quarters of data are partially estimated.
Source: Federal Reserve Bank of New York Consumer Credit Panel/Equifax.
Figure 3 plots, within each credit score bin, the change in auto loan originations from 12 months earlier. As the figure illustrates, the 2020:Q2 originations (black line) remained approximately unchanged from 2019:Q2 in the highest-credit-score bins but declined markedly (and monotonically) among lower-credit-score loans.6 By 2020:Q4 (blue line), originations among higher credit score loans, particularly prime loans with credits scores above 720, recovered and experienced positive growth relative to 12 months earlier. By contrast, originations among loans with low credit scores—those below approximately 580—continued to show declines relative to their levels 12 months earlier. Finally, these patterns continued in 2021. For consistency, the red line shows the decline between 2020:Q1 and 2021:Q1. Whereas higher credit score originations continued to rebound in the first quarter of 2020, originations in the lower credit score bins remained depressed relative to 2020:Q1 levels.
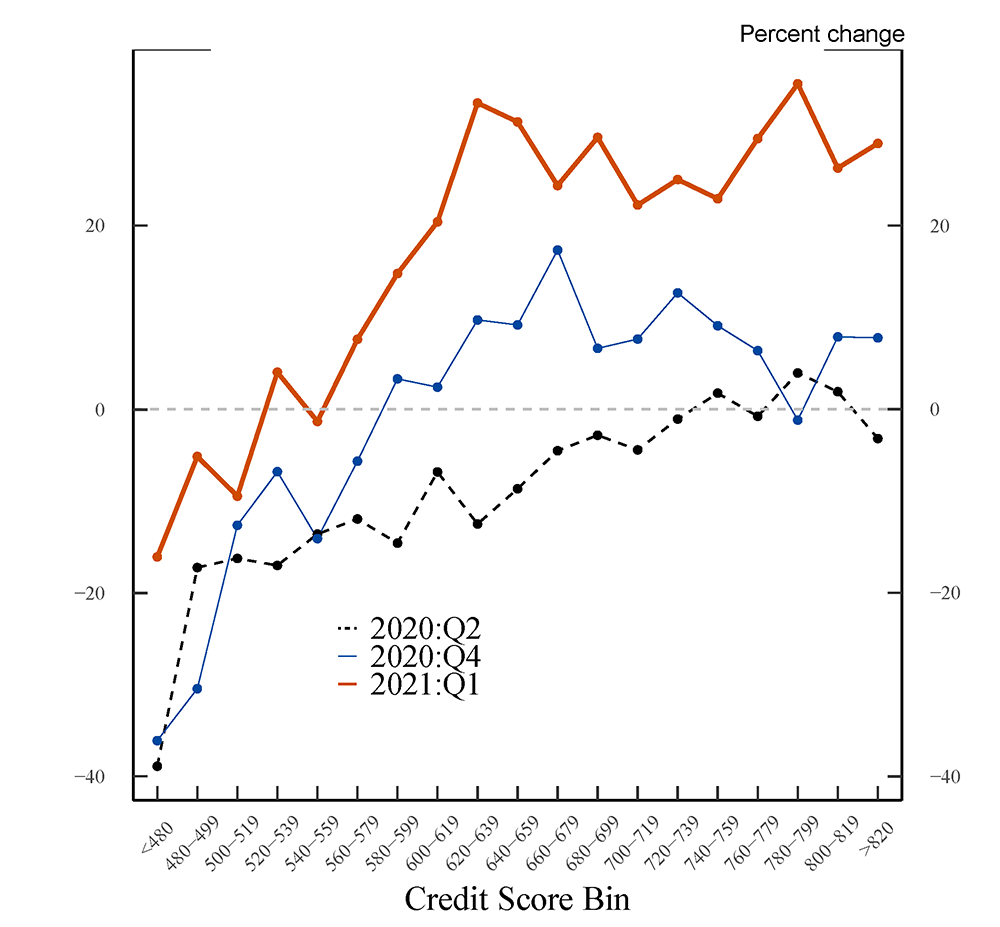
Source: Federal Reserve Bank of New York Consumer Credit Panel/Equifax.
Taken together, Figures 2 and 3 suggest that during the pandemic, a high share of low-credit-score loans were not originated, especially relative to higher-credit-score auto loans. Because most delinquencies occur among lower-credit-score borrowers, these missing auto loan originations may partly explain the low delinquency rates in the market, as low credit score borrowers who would have later defaulted are not granted credit in the first place.7 Before we turn to directly estimating the role of these missing originations in accounting for low delinquency rates, we examine whether the decline we document may instead be due to a secular increase in credit scores.
Alternative Explanation: Credit Score Migration
One complication with examining how trends in origination vary across credit score bins over time is that the share of consumers with low credit scores has been declining and the pace of this decline accelerated during the pandemic (Goodman et al, 2021). Thus, it is possible that a reduction in lower credit score originations is due to a general decrease in the number of lower credit score consumers. If that were the case, then we would expect the share of consumers, within each credit score bin, who originate a new auto loan would be relatively constant during the pandemic. To examine this directly, in Figure 4, we plot, for each credit score bin, the percent of consumers in the CCP with newly originated auto loans. That is, we plot $$s_{ct} = orig_{ct}/n_{ct}$$ , where $$orig_{ct}$$ is the number of new auto loans originated in credit score bin $$c$$ at time $$t$$ and $$n_{ct}$$ is the number of consumers in the CCP in credit score bin $$c$$ at time $$t$$. We plot this share by quarter from 2019:Q1 to 2021:Q2 in the four panels of Figure 4.
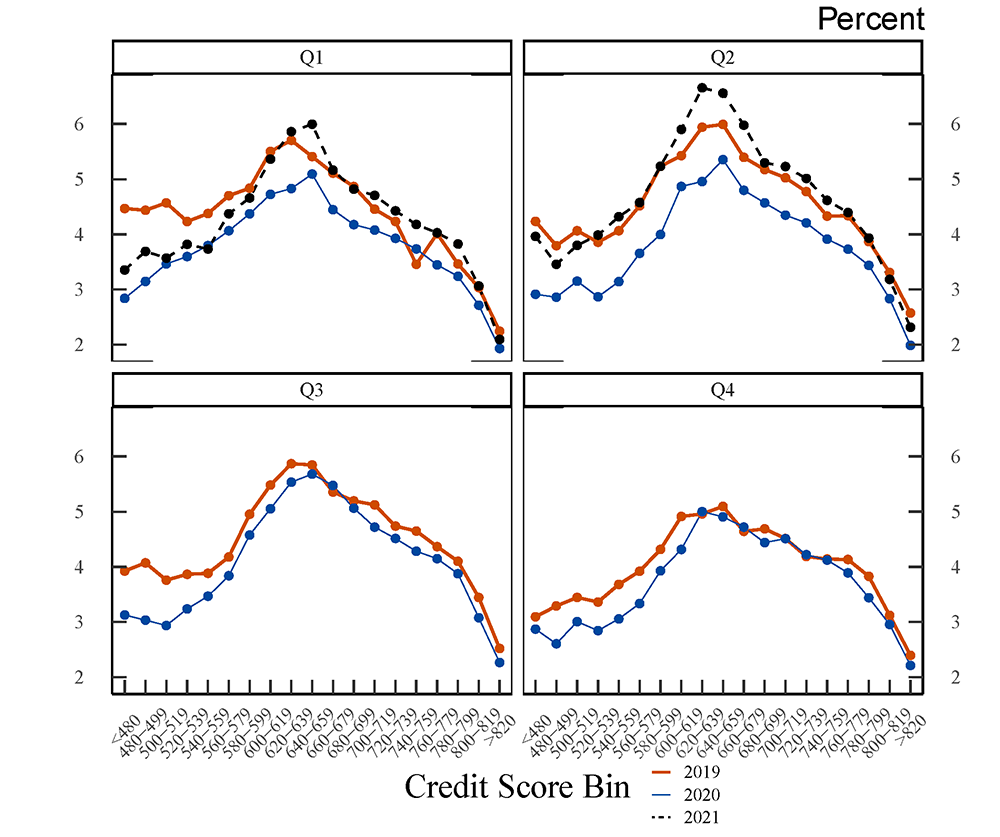
Note: The share of new auto loans is defined as the number of new loans originated divided by the number of consumers.
Source: Federal Reserve Bank of New York Consumer Credit Panel/Equifax.
If originations among lower-credit-score consumers decline solely due to migration out of the lower-credit-score categories, then we would expect both $$orig_{ct}$$ and $$n_{ct}$$ to decline during the pandemic and that $$s_{ct}$$ may remain approximately flat.8 However, Figure 4 shows this is not the case. In each of the first two quarters of 2020, shown in the top two panels of Figure 4, the share of new auto loans per consumer declined across the distribution. This is evidenced by the distance between the red line—new auto loans per consumer in 2019—and the blue line—new auto loans per consumer in 2020—in each quarter. By the second half of the year, shown in the bottom two panels, the share of new auto loans per consumer in 2020 (blue line) rebounds to 2019 levels (red line) for higher credit score bins. That said, a difference between the red and blue lines remains for lower-credit-score borrowers in 2020Q3 and 2020Q4, just as in Figure 3. By 2021Q2, the share of new auto loans (black dashed line) recovers to at or above 2019 levels (the red line) for even the lowest-credit-score borrowers.
"Missing Originations" and Auto Loan Delinquencies
We next turn to examining the role of the "missing originations" in explaining the low delinquency rates in the auto loan market. Figure 5 decomposes the auto loan delinquency rate into two components: the delinquency rate arising from loans originated more than 12 months earlier, in blue, and the delinquency rate arising from loans originated less than 12 months earlier, in white.9 Both the blue and white bars experienced significant declines during the pandemic, likely as a result of the forbearance policies many auto lenders implemented, the three rounds of stimulus payments, and the extended unemployment insurance (Dettling and Lambie-Hanson, 2021). At the same time, the contribution of new loans to the delinquency rate fell much more than the contribution of existing loans. At the end of 2019, prior to the pandemic outbreak, loans younger than 12 months accounted for 23 percent of all delinquent loans. The share declined to 19 percent by the end of 2020. In all, young loans that were delinquent, as a share of all loans, fell almost 30 percent (from 0.7 percent to 0.5 percent), whereas delinquent older loans, as a share of all loans, fell only 16 percent (from 2.4 percent to 2.1 percent).10
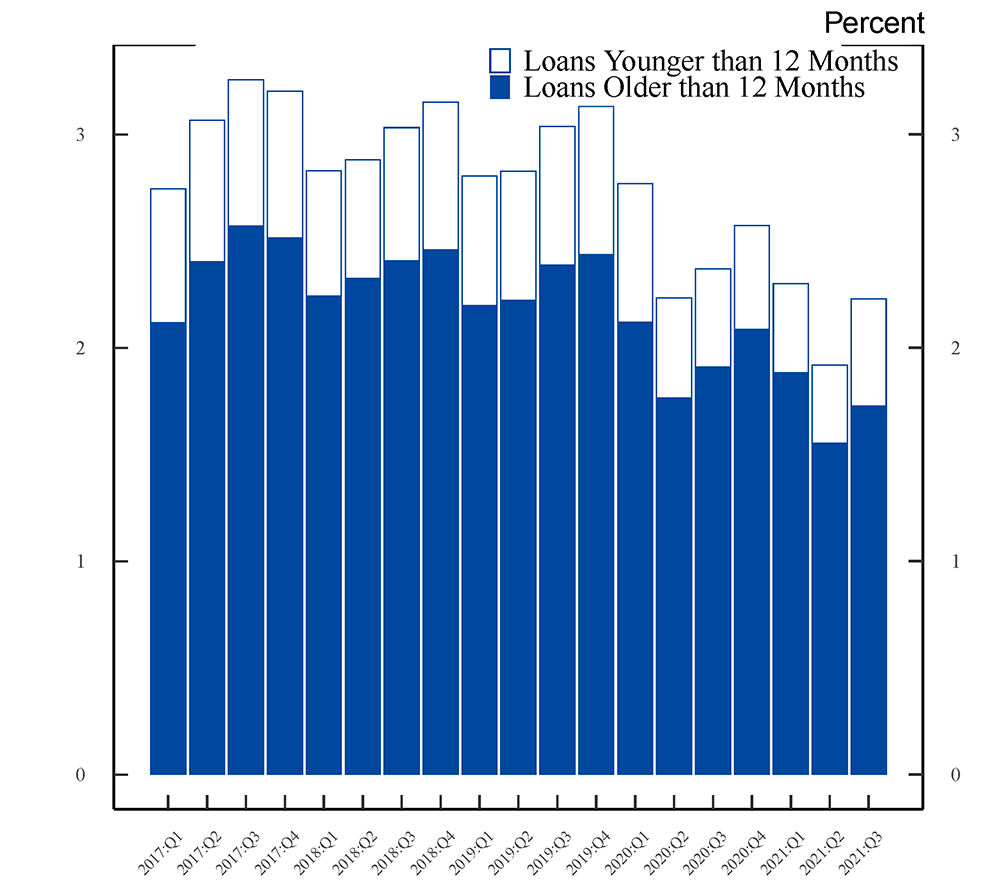
Note: Delinquency is at least 30 days past due, excluding severe derogatory loans.
Source: Federal Reserve Bank of New York Consumer Credit Panel/Equifax.
This larger decline in delinquencies among young loans is a proxy for the effects of "missing originations" on the delinquency rate: many higher-risk loans that would have been originated, and subsequently become delinquent, in normal times were not originated at all. Notably, it is unlikely that other factors that reduced overall delinquencies during the pandemic differentially affected younger loans. For example, younger loans were not more likely to enter forbearance during 2020, and there is no evidence that stimulus or unemployment payments would be more effective in reducing delinquencies for younger loans than for existing loans.
Finally, we calculate the share of the decline in the overall delinquency rate that can be explained by the "missing originations." To do so, we estimate the counterfactual delinquency rate that would have occurred if the delinquency rate among young loans had followed the same trend as among existing loans, rather than undergoing a larger decline.11 Figure 6 shows this counterfactual delinquency rate, as well as the actual rate. By the end of the second quarter of 2021, the counterfactual delinquency rate is 2.20 percent, 28 basis points higher than the actual delinquency rate. This difference between the actual and counterfactual delinquency rates is approximately 30 percent of the realized decline in delinquency rates since the end of 2019.12
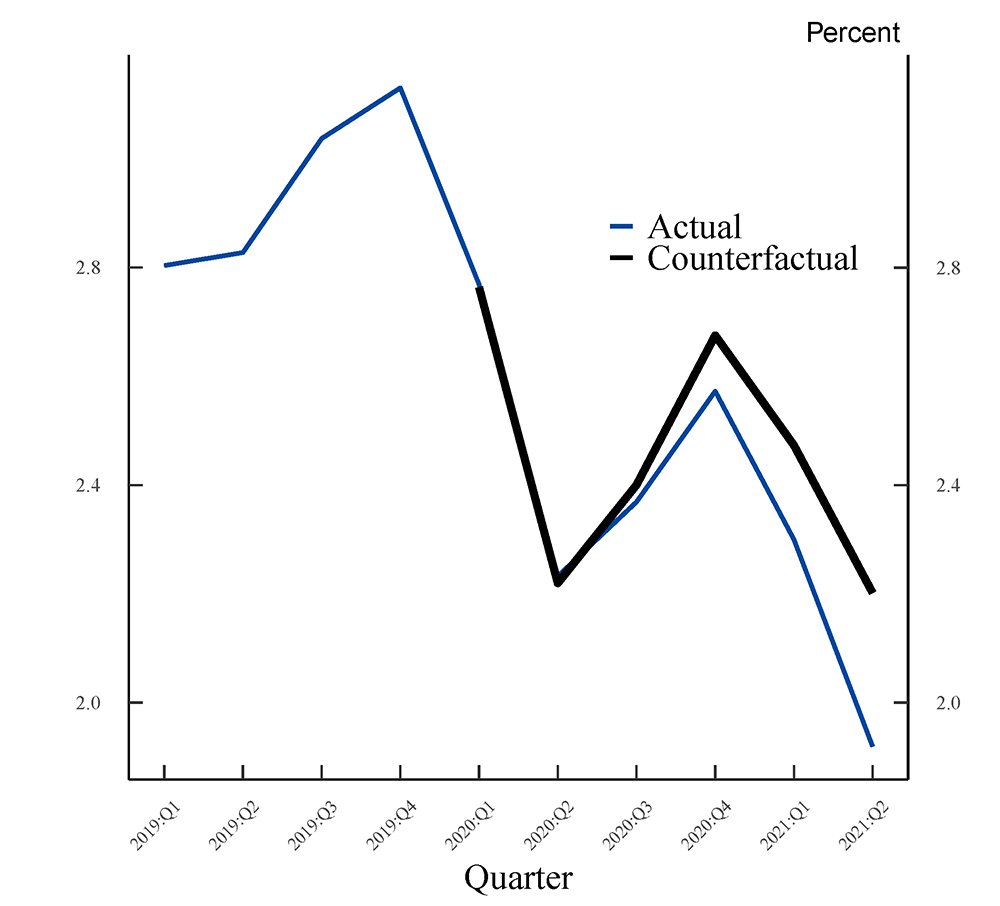
Note: Not seasonally adjusted.
Source: Federal Reserve Bank of New York Consumer Credit Panel/Equifax.
Are the "Missing Originations" Driven by Supply or Demand?
Having established the role of "missing originations" in partially explaining the decline in delinquencies, we next discuss the drivers of these "missing originations." The decrease in originations among low credit score borrowers may be due to either demand or supply. As stay-at-home orders were implemented and many workers began working from home, demand for vehicles, and thus auto loans, likely fell. At the same time, lenders reportedly tightened their standards, particularly for lower-credit-score households, in most categories of lending. It is beyond the scope of this analysis to fully disentangle the contribution of supply and demand to the reduction in equilibrium originations. That said, we next present some suggestive evidence consistent with supply driving these results.
We first run a difference-in-difference regression testing the results of Figure 4 for the 2018-21 time period.
$$$$ Y_{ict} = \beta {Subprime}_i \times {Pandemic}_t + \eta_i + \mu_c + \lambda_t, $$$$
Where $$ Y_{ict} $$ are new auto loan originations per 1000 consumers in the CCP in credit score bin $$i$$ county $$c$$ at date $$t$$. We include fixed effects for 20-point credit score bins (as in Figure 4) $$\eta_i$$, county fixed effects $$\mu_c$$, and year-quarter fixed effects $$\lambda_t$$. Our main coefficient of interest is $$\beta$$, the coefficient on the interaction between $${Subprime}_i$$ and $${Pandemic}_t$$. $${Subprime}_i$$ is defined as credit score bins less than 620 and $${Pandemic}_t$$ is equal to 1 starting in 2020:Q2.13 Specification (1) of Table 1 presents the results. Relative to non-subprime bins, originations in subprime credit score bins fell, on average, by 7 new car loans per 1000 consumers during the pandemic. This effect is both statistically and economically meaningful, as the average subprime credit score bin had 42 originations per 1000 consumers before the pandemic.
In specification (2), we use as the dependent variable the number of credit inquiries per 1000 consumers over the preceding 12 months. The coefficient on $${Subprime}_i \times {Pandemic}_t $$ is positive and significant, suggesting that consumers in these credit score bins had more credit inquiries over the preceding 12 months. Although we do not know whether these credit applications were for car loans or other products, this evidence suggests that the decline in originations among lower-credit score borrowers was due to supply, rather than demand, because a demand-based explanation would result in lower credit inquiries.
Table 1. Originations and Credit Inquiries
| Dependent Variable: | Originations (1) |
Inquiries (2) |
Originations (3) |
Inquiries (4) |
Originations (5) |
Inquiries (6) |
|---|---|---|---|---|---|---|
| Subprime x Pandemic | -7.11*** | 6.61*** | -8.37*** | 4.26*** | -9.49*** | 10.64*** |
| (0.66) | (0.91) | (0.69) | (0.99) | (0.72) | (0.99) | |
| Subprime x Pandemic | 4.70*** | 5.69** | ||||
| x Has Mort | (1.42) | (1.8) | ||||
| Pandemic x Has Mort | -2.54*** | -5.86*** | ||||
| (0.72) | (1) | |||||
| Subprime x Pandemic | 6.69*** | -12.68*** | ||||
| x Has Student Loan | (1.28) | (1.79) | ||||
| Pandemic | -0.62 | 5.12*** | ||||
| x Has Student Loan | (0.8) | (1.18) | ||||
| County FE | Yes | Yes | Yes | Yes | Yes | Yes |
| Year-Quarter FE | Yes | Yes | Yes | Yes | Yes | Yes |
| Credit Score Bin FE | Yes | Yes | ||||
| Credit Score Bin x Has Mortgage FE | Yes | Yes | ||||
| Credit Score Bin x Has Student Loan FE | Yes | Yes | ||||
| N | 650941 | 650941 | 1064544 | 1064544 | 1023851 | 1023851 |
| Adjusted R-squared | 0.016 | 0.346 | 0.018 | 0.332 | 0.01 | 0.249 |
This table examines the contraction in credit to subprime auto loan borrowers. In specifications (1), (3), and (5), the dependent variable is the number of new auto loan originations per 1000 consumers with a credit score in the CCP. In specifications (2), (4), and (6), it is the number of inquiries over the previous 12 months per 1000 consumers with a credit score. ***, **, and * indicate statistical significance at the 1%, 5%, and 10% levels, respectively.
There are several reasons why auto lenders may have cut credit to subprime borrowers during the pandemic. First, they may have decided to decrease the risk of their lending portfolio, particularly during a time of funding market turmoil such as March and April 2020. Second, lenders may have decreased credit because they were no longer sure of the true riskiness of potential borrowers. In the summer of 2020, news articles suggested that lenders were wary of the effects of forbearance programs on credit scores.14 Namely, the Coronavirus Aid, Relief, and Economics Security (CARES) Act passed by Congress in March 2020 stipulated that current accounts that subsequently enrolled in a forbearance program had to be reported as current rather than delinquent to credit reporting agencies. Thus, borrowers who are no longer able to make payments on a loan but are enrolled in a forbearance program do not count as delinquent, and their credit scores do not reflect their nonpayment status.
Although many lenders voluntarily implemented forbearance programs in the auto loan, credit card, and other consumer loan markets, the two major forbearance programs were federally mandated. The CARES Act allowed homeowners with federally backed mortgages to apply for forbearance programs from their lenders. In addition, the CARES Act extended an executive order mandating forbearance and a halt on interest accrual for almost all federal student loans. If lenders were wary of the opacity brought by forbearance programs and the new reporting rules, it is possible that they cut credit more to borrowers who may be enrolled in forbearance programs, which may partially account for the contraction in credit in Figure 2 and 4.
To test this hypothesis, we split consumers by whether they have an outstanding mortgage or student loan and run triple-difference regressions in specifications (3) through (6). First, in specifications (3) and (4), we group consumers by credit score bin $$i$$, county $$c$$, quarter $$t$$, and whether they have a mortgage. Grouping in this way allows us to include credit score bin x has mortgage fixed effects, as borrowers with the same credit score may be very different depending on whether they have a mortgage. As before, in specification (3), the dependent variable is originations and in specification (4) it is average inquiries. New auto loan originations decreased during the pandemic for borrowers with a mortgage. At the same time, however, the coefficient on the triple interaction term is positive and significant, suggesting that the decline in subprime new auto originations was relatively smaller for borrowers with a mortgage.15 Inquiries follow a similar pattern: decreasing more during the pandemic for borrowers with a mortgage but relatively less for subprime borrowers.
Specifications (5) and (6) repeat the analysis for student loans. Specification (5) shows a positive and significant coefficient on the triple interaction term, again suggesting that the contraction in credit was worse for borrowers without a student loan. By contrast, the triple interaction term on inquiries is negative and significant, suggesting that borrowers with student loans were relatively less likely to have applied for more credit over the preceding 12 months.
Overall, the results of Table 1 suggest that supply, rather than demand, likely drives the contraction in auto loan credit for subprime borrowers during the pandemic. The results also find no evidence that this contraction was of a larger magnitude for borrowers who had a mortgage or student loan—that is, borrowers who may be enrolled in a forbearance. Indeed, as both mortgage and student loan forbearance was federally mandated, and anyone could apply, it is possible that auto lenders were willing to extend more credit to borrowers eligible for forbearance, because these borrowers could reallocate towards a new auto loan funds they would have otherwise used to pay down their mortgage or student loan.
Discussion
In this note, we present evidence that originations to low-credit-score borrowers fell sharply at the onset of the pandemic and remained suppressed through the beginning of 2021. Consistent with the existence of these "missing originations," we show that delinquency rates among recently-originated loans fell much more than among loans originated prior to the pandemic outbreak. We estimate that "missing originations" can account for up to 30 percent of the realized decline in delinquency rates since the end of 2019. We also present suggestive evidence consistent with contractions in supply, rather than demand, driving the "missing originations."
Our analysis provides new evidence on the drivers of the decline in delinquency rates in the auto loan market. Our finding that "missing originations" account for as much as 30 percent of the decline in delinquency rates has important forward-looking implications. To the extent that low delinquency rates are supported by forbearance and income support measures, as these temporary programs expire, delinquency rates may rebound toward pre-pandemic levels. On the other hand, to the extent that the low delinquency rates are partly supported by reduced originations among low-credit-score borrowers, delinquency rates may remain suppressed, relative to pre-pandemic levels.
References
Andriotis, AnnaMaria (2020), "'Flying Blind into a Credit Storm': Widespread Deferrals Mean Banks Can't Tell Who's Creditworthy," Wall Street Journal, June 29.
Bakshi, Tanya and Jonathan Rose (2021). "What Happened to Subprime Auto Loans During the COVID-19 Pandemic?" Chicago Fed Insights. Federal Reserve Bank of Chicago, June 30.
Dettling, Lisa J., and Lauren Lambie-Hanson (2021). "Why is the Default Rate So Low? How Economic Conditions and Public Policies Have Shaped Mortgage and Auto Delinquencies During the COVID-19 Pandemic," FEDS Notes. Washington: Board of Governors of the Federal Reserve System, March 4, https://doi.org/10.17016/2380-7172.2854.
Goodman, Sarena, Geng Li, Alvaro Mezza, and Lucas Nathe (2021). "Developments in the Credit Score Distribution over 2020," FEDS Notes. Washington: Board of Governors of the Federal Reserve System, April 30, https://doi.org/10.17016/2380-7172.2902.
1. The views presented here are those of the authors and do not necessarily reflect those of the Federal Reserve Board or its staff. We thank Kamila Sommer and Geng Li for helpful comments and Jessica Flagg for outstanding research assistance. Return to text
2. Throughout this note, credit score refers to the Equifax Risk Score included in the CCP. The seasonal adjustment includes a level shift in 2020:Q2. Return to text
3. For example, the share of auto loan balances in forbearance plummeted from its peak of 8.3 percent in June 2020 to less than 2 percent by June 2021. Return to text
4. Another 30 percent of auto loan balances comprise loans originated between 12 and 24 months earlier. Return to text
5. Due to lags in when new auto loan originations are reported in the CCP, we examine originations only through the second quarter of 2021. Return to text
6. The very large declines in the bin corresponding to scores of less than 480 reflect, in part, the low number of originations in that bin even in normal times. Return to text
7. Approximately 60 percent of delinquent loans have a credit score of less than 580 12 months earlier and 75 percent have a credit score below 620. We calculate this statistic using a lagged credit score to avoid simultaneous declines in credit score due to delinquency. Return to text
8. It is possible that there is selection within credit score migration, with those consumers more likely to take out auto loans also being more likely to migrate to higher credit score bins during the pandemic period. Although we cannot fully rule this out, in so far as the credit score migration is due to the implementation of forbearance policies on existing loans, this selection is unlikely to drive our results. Return to text
9. Figure 5, as well as Figure 6, is not seasonally adjusted as the data do not provide a long enough time series that distinguishes young and existing loans. Return to text
10. Because delinquency rates have a strong seasonal component, it is difficult to compare the 2021:Q2 rates to pre-pandemic levels. That said, by 2021:Q2, young loans contributed only 0.37 percentage points of the 1.92 percent delinquency rate, corresponding to a decline of 47 percent from 2019:Q4 to 2021:Q2 in the contribution of young loans to delinquency, relative to a decline of 35 percent among older loans. Return to text
11. Specifically, under the counterfactual, for each quarter starting in 2020:Q1, we assume that the decline from 2019:Q4 in the delinquency rate for young loans of less than 12 months (that is, white bars of Figure 5) was the same as the decline for older loans of more than 12 months (blue bars of Figure 5). Return to text
12. Looking at earlier periods gives a lower estimate of explaining approximately 20 percent of the decline between 2019:Q4 and 2020:Q4 or 2021:Q1. Delinquency rarely occurs immediately after origination, consistent with "missing originations" explaining a larger share of the decline in delinquency by 2021:Q2. These estimates are robust to alternative specifications, including examining subsamples with low credit scores rather than the full sample. Return to text
13. Our results are robust to starting the pandemic in 2020:Q1. In addition, in unreported results we show that the effects are stronger for lower-credit-score bins, and there is no effect for non-subprime bins. Return to text
14. For example, see Andriotis (2020). Return to text
15. Although we cannot fully rule out that this result is driven by differences in the characteristics between consumers with and without mortgages, the credit score bin x has mortgage fixed effects should control for differences in levels between these groups. In addition, our results are unchanged when including county x has mortgage and year-quarter x has mortgage fixed effects. Return to text
Bord, Vitaly M., and Lucas M. Nathe (2022). "Delinquency Rates and the "Missing Originations" in the Auto Loan Market," FEDS Notes. Washington: Board of Governors of the Federal Reserve System, February 11, 2022, https://doi.org/10.17016/2380-7172.3053.
Disclaimer: FEDS Notes are articles in which Board staff offer their own views and present analysis on a range of topics in economics and finance. These articles are shorter and less technically oriented than FEDS Working Papers and IFDP papers.