FEDS Notes
December 03, 2021
Effects of Supply Chain Bottlenecks on Prices using Textual Analysis
Henry L. Young, Anderson Monken, Flora Haberkorn, and Eva Van Leemput
Introduction
After collapsing in the second half of 2020, global demand for goods, as reflected in global trade, has been exceptionally strong and now well exceeds pre-pandemic levels (Figure 1). The sharp bounceback reflects several factors, including an unprecedented amount of global stimulus and the drawdown of excess savings (especially for high-income households). In addition, given that COVID-19 restrictions disproportionally affected the services sector—restaurants, travel, etc.—consumers substituted towards goods purchases, especially for electronics products, household goods, and construction materials. As a result, significant bottlenecks manifested, such as a global container shortage, and were exacerbated by capacity constraints, as production was slow to come back online because of social distancing restrictions.
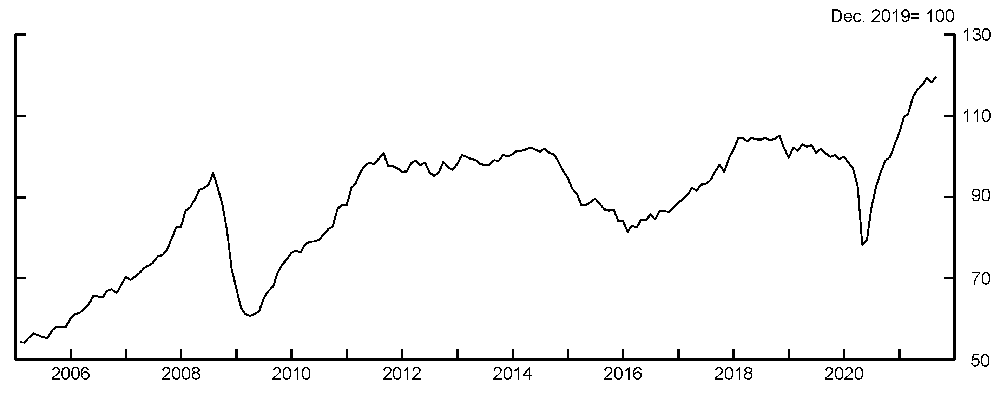
Note: Series are seasonally adjusted, comprise of 97% of world trade, and end in August 2021.
Source: Haver Analytics.
In this note, we first document to what extent companies are facing these supply bottlenecks and which sectors have been affected in a novel way. Specifically, we use textual analysis of earnings calls from the S&P Global Market Intelligence database,1 which includes 5,000-7,500 earnings calls from U.S. and foreign firms per quarter, to construct firm sentiment indexes about the bottlenecks. The benefit of this approach is that we have very timely data to synthesize information about what firms are seeing on the ground and what challenges they face. Additionally, we can differentiate firm sentiment across different industries. Second, we ask to what extent these supply bottlenecks have pushed up firms' prices as measured by the frequency of higher price references in their earnings calls.
We find that around the end of 2020, there was a notable increase in negative sentiment regarding shipping disruptions, consistent with the heavy strain on the world's transportation system as global demand rebounded strongly. Moreover, after the summer, firms' negative sentiment regarding supply chain disruptions has deteriorated significantly. With respect to the sectoral decomposition, we find that the supply chain disruptions have become more pronounced across all sectors in recent months, whereas bottlenecks were initially more concentrated in the automobile sector at the beginning of 2021. In addition, we provide evidence that those firms that face high supply bottlenecks mention higher prices in their earnings calls more often than firms that do not see major supply chain disruptions. That said, the increase in higher price mentions also reflects higher demand more broadly, which is also more pronounced for those firms facing higher supply chain bottlenecks. All told, this is suggestive evidence that the strong global increase in demand for goods together with supply chain disruptions have played a role in pushing up firm prices.
Data
To disentangle the sources of supply bottlenecks, we use textual analysis of earnings calls from the S&P Global database. This database contains transcripts from quarterly earnings calls and other company calls that include timely information about what firms are seeing on the ground and what challenges they face.2 Although earnings calls are released with a one-quarter lag, they provide timely information as they not only discuss the firm's earnings from the previous quarter, but also provide updates on their expected revenues and profitability for proximate quarters. In addition, the earnings calls also include a Q&A section, which includes information about developments up until that time. In this note, we use earnings calls that occurred from 2017-Q3 until 2021-Q3, which covers approximately 5,000-7,500 transcripts per quarter, of which approximately half are from U.S. corporations.3
We examine several sources of supply bottlenecks including shipping, supply chain disruptions, chip shortage, and capacity constraints. To quantify the severity of each of these bottlenecks, we construct firm sentiment indexes based on earnings call transcripts. We first look for specific terms in earnings calls, including "ship" or "container", "supply-chain", "capacity", and "chip". Then, we conduct a proximity search within ten words, before or after, each of the main search terms to look for negative sentiment words, including "bottleneck", "shortage", etc.4 To illustrate the methodology, Table 1 includes three different examples for Mitsubishi Motors, Peloton, and TSMC (Taiwan Semiconductor Manufacturing Company). After identifying the specific words in connection with negative sentiment qualifiers, we sum the word counts as a share of total words of the earnings call transcript and standardize each series to measure the number of standard deviations away the series is from its mean value.
Table 1: Earnings Call Transcripts - Examples
| Company | Earnings call transcript sentences | Main search term | Negative sentiment |
|---|---|---|---|
| Mitsubishi Motors | "Currently, the impact of the shortage in the supply chain for semiconductors is beginning to affect the automobile production…" | Supply chain | Shortage |
| Peloton | "There's a container shortage. There is an extended time of container ships sitting out on the ocean. There is a backlog to get those containers unloaded." | Container | Shortage, Backlog |
| TSMC | "Therefore, in the near-term, as demand from the automotive supply chain is rebounding, the shortage in automotive supply has become more obvious." | Supply Chain | Shortage |
Source: S&P Global Market Intelligence.
Firm sentiment indexes
Figure 2 plots the aggregate firm sentiment indexes of the supply bottlenecks. We plot these time series at a weekly frequency using a 90-day moving average. The vertical axis shows the number of standard deviations away the series is from its mean value. As the panel highlights, around the turn of the year, there was a notable increase in concerns (negative sentiment) regarding supply bottlenecks and especially shipping (shown in red), where the index is more than two standard deviations below its mean. However, since then, the series has continued to deteriorate and the index is now more than three standard deviations below its mean, significantly worse than the depth of the COVID-19 crisis. Similarly, capacity constraints have worsened notably in recent months. These results suggest that supply disruptions continue to persist in recent months and have even deteriorated when it comes to supply chain bottlenecks.
Next, we consider firm sentiment indexes by sector. The four panels in Figure 3 show indexes for each of the previously shown search terms for four industry groups: automobiles, electronics, semiconductors, and other industries. There are three main takeaways. First, the auto sector was hit hardest at the beginning of the year by supply chain disruptions (red line in the top-left panel), which corresponds with the beginning of the global chip shortage (red line in the bottom-left panel), and is even greater than at the depth of the COVID-19 crisis. Second, in recent months, these supply concerns have also severely affected other industries, including the electronics sector (blue line in the top-left panel). Third, as can be seen in the top-right panel, most industries seem to be concerned about a global container shortage, notwithstanding the small improvement in sentiment for the electronics sector in recent weeks. With the increase in supply bottlenecks, how has this impacted firms’ output prices? We provide some evidence on the transmission in the next section.
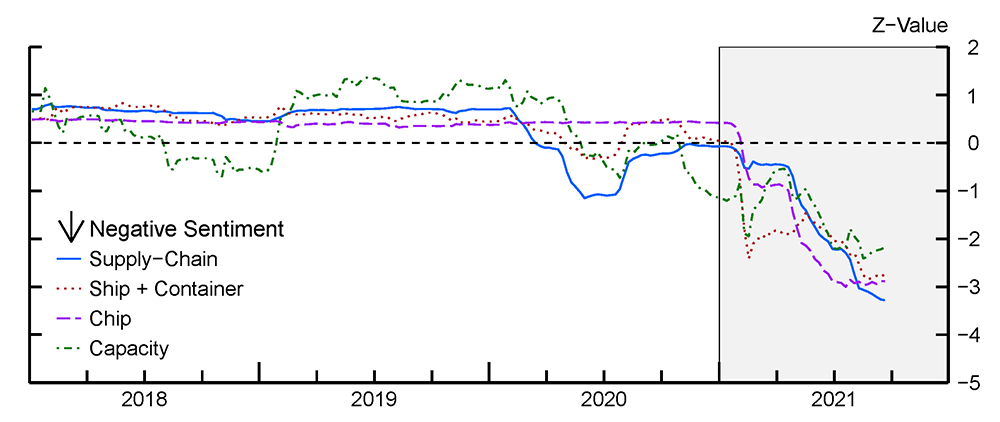
Note: *The Aggregate Negative Sentiment Index is constructed by counting the total number of negative sentiment words found within 10 words of the main search term from quarterly firm earnings call transcripts. This sum is then divided by the total number of words within the transcript and then the 90-day moving average of this ratio is calculated. Data are then aggregated to the weekly level by taking the last moving average value for each week and finally the z-value (z-score) is computed. The z-value is a measurement of the number of standard deviations that sentiment series are away from their mean value. Since the sentiment series have different means, the z-values better reflect relative changes in negative sentiment. The gray shading begins in January 2021. The series end on September 21, 2021.
Source: S&P Global Market Intelligence.
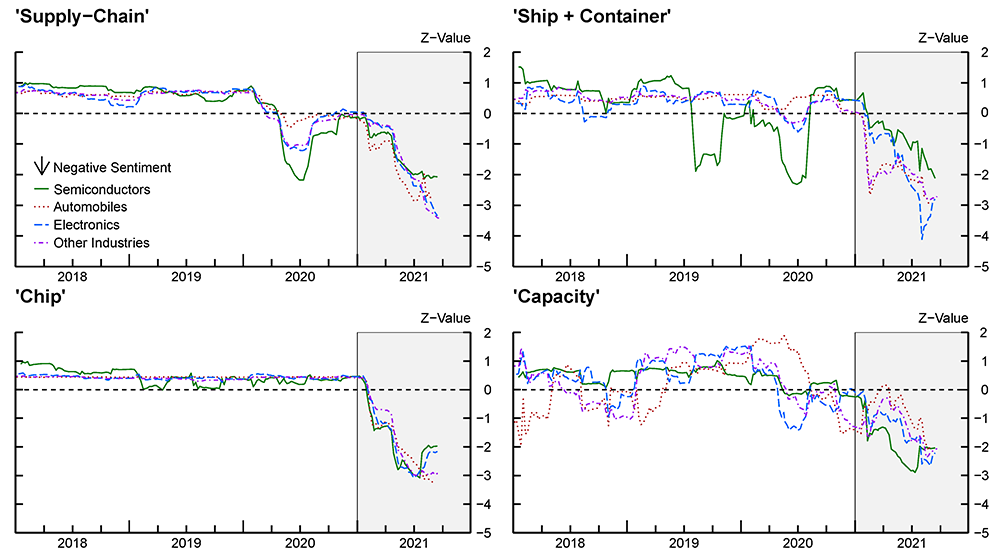
Note: *The Industry Negative Sentiment Index is constructed by first filtering firms by S&P Industrial Classifications. The "Automobiles" aggregate consists of firms that are classified as automobiles or automobiles components firms. The "Electronics" aggregate consists of firms that are classified as electronic equipment, instruments and components firms, technology hardware, storage and peripherals firms, or communications equipment firms. The "Semiconductors" aggregate consists of firms that are classified as semiconductors and semiconductor equipment firms. The "Other Industries" aggregate consists of all other S&P Industrial Classifications. The industry series are then constructed by counting the total number of negative sentiment words found within 10 words of the main search term from quarterly firm earnings call transcripts. This sum is then divided by the total number of words within the transcript and then the 90-day moving average of this ratio is calculated. Data are then aggregated to the weekly level by taking the last moving average value for each week and finally the z-value is computed. The z-value is a measurement of the number of standard deviations that sentiment series are away from their mean value. Since the sentiment series have different means, the z-values better reflect relative changes in negative sentiment. The gray shading begins in January 2021. The series end on September 21, 2021.
Source: S&P Global Market Intelligence.
Effects on output prices
We next analyze the effects these supply bottlenecks might have on firms' output prices. As highlighted before, these bottlenecks appear to have manifested as global demand for goods surged. Therefore, we want to control for changes in demand when assessing the effects of supply bottlenecks on output prices. In addition, data on firms' output prices are not readily available on a timely basis. Again, we circumvent these problems using textual analysis. We construct an aggregate index for prices sentiment and demand sentiment using a similar methodology described earlier. To construct the indexes, we first look for the specific terms "prices" or "price" and "demand" in earnings calls.5 Then, we conduct a proximity search within ten words, before or after, each of the main search terms to look for positive sentiment words, including "increase", "rise", "strong", etc. Thus, positive sentiment regarding demand and prices may be interpreted as to what extent earnings calls are emphasizing price or demand increases. Figure 4 plots the aggregate positive sentiment index for prices and demand. Initially, firms referenced stronger demand (as the red line indicates) starting in the second quarter of 2020 as consumption picked up again. We also find that firms' references to higher prices lag increases in the aggregate demand index as the price positive sentiment index was roughly stable throughout 2020 and started to rise rapidly only at the beginning of 2021.
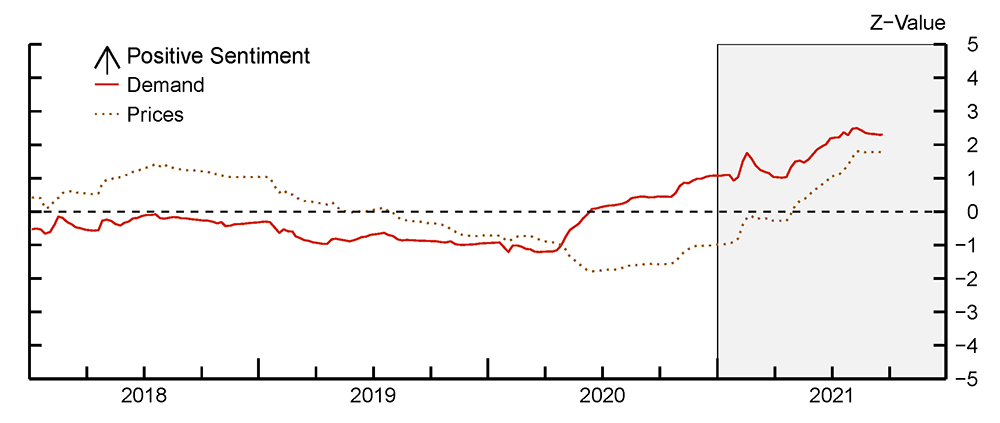
Note: *The Aggregate Positive Sentiment Index is constructed by counting the total number of positive sentiment words found within 10 words of the main search term from quarterly firm earnings call transcripts. This sum is then divided by the total number of words within the transcript and then the 90-day moving average of this ratio is calculated. Data are then aggregated to the weekly level by taking the last moving average value for each week and finally the z-value is computed. The z-value is a measurement of the number of standard deviations that sentiment series are away from their mean value. Since the sentiment series have different means, the z-values better reflect relative changes in negative sentiment. The gray shading begins in January 2021. The series end on September 22, 2021.
Source: S&P Global Market Intelligence.
Next, to analyze the impact supply bottlenecks concerns have on the discussion of firms' output prices, we run the following panel regression at a quarterly frequency for the sample from the first quarter of 2020 though the second quarter of 2021:
$$(1) \ \ \ \ \Delta p_{fit} = \alpha_f + \beta_{dem}\Delta X_{dem,fit} + \beta_n \sum_{n \in N} {\Delta X_{n,fit}} + \gamma_{dem} \Delta X_{dem,fit} * I_{2021} + \gamma_n \sum_{n \in N} {\Delta X_{n,fit}} * I_{2021} + \varepsilon_{fit} $$
Where $$f$$ denotes the firm, $$i$$ denotes the industry, and $$t$$ denotes the quarter. The term $$\Delta X_{dem,fit}$$ is the quarterly absolute change in higher demand references in firms' earnings calls. Similarly, $$\Delta X_{n,fit}$$ is the quarterly absolute change in mentions of $$n \in N$$ sources of supply bottlenecks, which includes supply chain disruptions, capacity constraints, chip shortage and shipping bottlenecks.6 We also include a 2021 time dummy variable that interacts with changes in demand and each supply bottleneck to disentangle the effects of recent price mentions in firms' earnings calls as shown in Figure 4.7 All regressions include firm and time fixed effects and standard errors are clustered at the industry level.
Table 2 presents the results. Column 1 presents the estimation results for equation (1) for all firms in the sample. As mentioned, we focus on the 2021 effects given that they highlight the effects of recent price increases, proxied by the change in price mentions in firms' earnings calls. There are three main takeaways. First, the coefficient on demand is positive and statistically significant. This highlights that stronger demand has contributed to an increase in firms' 2021 output prices, even higher than the normal response. Second, we find that several recent supply bottlenecks have translated into mentions of higher prices this year. In particular, we find a positive and highly significant effect of supply chain disruptions on the discussion of price increases.8 We also find a positive and significant effect of the chip shortage on higher prices. Third, our results suggest that capacity constraints and shipping bottlenecks have not significantly induced mentions of higher prices in 2021.
In columns (2) and (3) of table 2, we run the same regression specification as equation (1) but on different subsets of firms to parse out the heterogenous effects. Specifically, we differentiate firms that face high versus low supply chain disruptions. Again, we focus on the effects in 2021. There are two main takeaways. We find that the demand coefficient is positive and significant for firms that face high supply chain disruptions and not significant for firms that face few supply chain disruptions. This highlights that, in addition to the strong rebound in demand before 2021, the additional boost in demand in 2021 indeed contributed to the supply chain disruptions that have manifested throughout the year. Second, we find no significant effects of general supply bottlenecks on firms' price increases for firms that face low supply chain disruptions. One exception is the chip shortage, which seems to be affecting all firms.
Table 2: Textual Analysis Firm Panel of Supply Bottlenecks
| All Firms | High Bottleneck Firms | Low Bottleneck Firms | |
|---|---|---|---|
| (1) | (2) | (3) | |
| $$\Delta {Demand}_{fit} * 2021$$ | 0.064** | 0.066** | 0.044 |
| s.e. | (0.027) | (0.030) | (0.039) |
| $$\Delta {Supply\ Chain}_{fit}* 2021$$ | 0.140*** | 0.077* | -0.009 |
| s.e. | (0.045) | (0.043) | (0.382) |
| $$\Delta {Chip}_{fit}* 2021$$ | 0.215** | 0.140* | 0.578* |
| s.e. | (0.098) | (0.080) | (0.328) |
| $$\Delta {Ship+Container}_{fit}* 2021$$ | 0.108 | 0.055 | 0.112 |
| s.e. | (0.133) | (0.131) | (0.256) |
| $$\Delta {Capacity}_{fit}* 2021$$ | -0.029 | 0.016 | -0.135 |
| s.e. | (0.081) | (0.082) | (0.141) |
| $$\Delta {Demand}_{fit}$$ | 0.097*** | 0.095*** | 0.108*** |
| s.e. | (0.022) | (0.030) | (0.021) |
| $$\Delta {Supply\ Chain}_{fit}$$ | -0.060** | -0.025 | -0.103 |
| s.e. | (0.027) | (0.028) | (0.065) |
| $$\Delta {Chip}_{fit}$$ | -0.075 | -0.079 | -0.152 |
| s.e. | (0.069) | (0.069) | (0.190) |
| $$\Delta {Ship+Container}_{fit}$$ | -0.1 | -0.012 | -0.277** |
| s.e. | (0.075) | (0.082) | (0.125) |
| $$\Delta {Capacity}_{fit}$$ | 0.108*** | 0.125** | 0.089* |
| s.e. | (0.038) | (0.053) | (0.065) |
| Constant | -0.274 | -0.660*** | -0.052** |
| s.e. | (0.171) | (0.505) | (0.149) |
| Observations | 27,804 | 10,584 | 17,220 |
| R-squared | 0.078 | 0.097 | 0.064 |
Note: The time coverage for all models spans 2020 Q1-2021 Q3. Only firms that have a transcript that occurred in each quarter from 2019 Q4-2021 Q3 and also found within the S&P Global Market Intelligence database are included within the panel. Overall, there are 3,972 firms globally that meet this condition. The dependent variable is the quarterly change in positive "Price" sentiment. Positive sentiment is measured by the total number of instances positive secondary search terms are located within 10 words of the main search term. The "Demand" variable is constructed using the same methodology, but other variables use negative sentiment secondary search terms instead. Firms are classified in the "High Bottleneck" category if they discuss "supply-chain" within a negative context in at least one of their earnings calls in 2021. Firms that do not meet this condition are then classified in the "Low Bottleneck" category. The average treatment effect is calculated by multiplying coefficients by their mean values. All models have firm and time fixed effects and standard errors in parentheses are clustered at the industry level.
* p<0.1, ** p<0.05, *** p<0.01
Finally, we disentangle the drivers of the increase in the price sentiment since 2020. To do so, we first consider the average increase of demand and supply bottlenecks mentions in 2020 and 2021. As the left panel in Figure 5 highlights, we find that for prices and most supply bottlenecks, the average increase in number of mentions was higher in 2021 than 2020, whereas, for demand, the change was lower as global demand already rebounded strongly in the second half of 2020. We then multiply the respective increases by the estimates in Table 2 for both 2020 and 2021 and sum up those estimates. Figure 5 plots each computed estimate as a share of the sum of all estimates for demand and each supply bottleneck. There are two main takeaways. First, we estimate that demand has the most significant effect on the increase in price mentions in firms' earnings calls. Second, we find that supply chain disruptions and chip shortages had the most significant effect among supply bottlenecks on the increase in price mentions in firms' earnings calls.9 All told, while the significant rebound in global demand has contributed to the increase in price mentions in firms' earnings calls, we provide evidence that supply bottlenecks have also been a main contributing factor to higher prices.
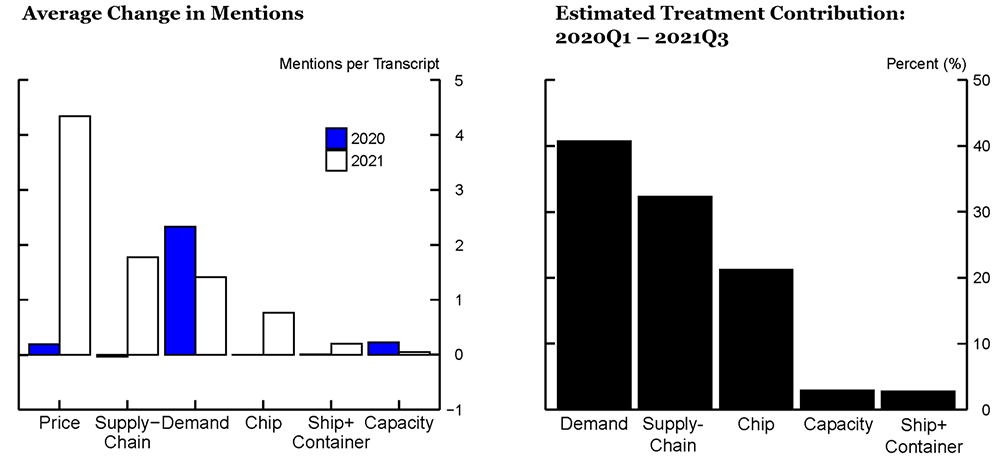
Left Panel:
Note: For each main search term, the average number of sentiment terms mentioned is calculated by summing the total number of positive or negative sentiment terms that are located within 10 words of the main search term for earnings calls that occurred in 2020 Q1, 2020 Q4, and 2021 Q3, respectively. The final values for each main search term for 2020 are constructed by subtracting the 2020 Q4 value by the 2020 Q1 value and then dividing by the total number of firms within the panel. The final values for 2021 are constructed similarly, but instead use data from 2021 Q3 and 2020 Q4. “Price” and “Demand” use positive sentiment terms while the other main search terms use negative sentiment terms.
Source: S&P Global Market Intelligence.
Right Panel:
Note: For each main search term, the 2021 Q3- 2020 Q1 estimated treatment contribution is calculated by first using the values calculated in the left-hand panel of Figure 5 and multiplying the 2020 value by the respective main search term’s standalone coefficient found in Table 2. The 2021 value found within the left-hand panel of Figure 5 is multiplied by the respective main search term’s 2021 interaction coefficient found in Table 2. The estimated treatment effect for each main search term is found by summing the respective products together. The estimated treatment effect values for Demand, Supply-Chain, Chip, Capacity, and Ship+Container are 0.32, 0.25, 0.16, 0.02, and 0.02. Finally, the contribution is found by dividing each main search term’s treatment effect value by the sum of all treatment effects and then multiplying by 100. “Demand” uses positive sentiment terms while the other main search terms use negative sentiment terms.
Source: S&P Global Market Intelligence.
1. The full citation is "S&P Global Market Intelligence, Transcripts Data Feed". More information on the data source can be found on the S&P Global Market Intelligence website. Return to text
2. Earnings calls are calls between the management of a public company, investors, equity analysts, and the media to discuss the company's financial results for a quarter. Return to text
3. The database covers over 8,000 public companies, of which approximately half are U.S. corporations, from 2009 on. That said, the firm coverage changes over time due to several factors including firm closures, firms going public, and missing transcripts. The transcript coverage has steadily increased over time from about 2,500 transcripts in the first quarter of 2009 to over 7,000 transcripts in the second quarter of 2021. Return to text
4. The full list of negative sentiment root words used are disrupt, trim, shortage, halt, close, idle, cancel, downtime, limit, shut, curtail, constrain, issue, and bottleneck. Past tense and plural forms are also used. Return to text
5. Earnings calls references to "prices" are in large part used in the context of output prices and not input prices. Return to text
6. Note that equation (1) is estimated in first differences in absolute levels of word counts rather than growth rates or z-values. Many firms often do not mention the whole set of these specific set of words in their earnings calls. As a result, the growth rates and z-values are undefined, thereby significantly restricting the sample size. Return to text
7. We chose to include a 2021 time dummy to capture the fact that certain supply bottlenecks (including the chip shortage) have only arisen recently and have historically been uncorrelated with prices as there is little historical variation. Return to text
8. Note that we estimate a negative and significant effect from supply chains before 2021 (Table 1). However, the estimated average effect (multiplying the coefficient with the average increase in supply bottlenecks mentions) is economically small, likely reflecting little impact of supply bottlenecks on price increases before 2021. Return to text
9. We estimated alternative models that included demand and bottleneck effects in separate regressions due to possible multicollinearity concerns. We find that the coefficients on "supply chain" and each bottleneck component is largely unchanged, suggesting that each bottleneck measure contains independent information. Return to text
Young, Henry L., Anderson Monken, Flora Haberkorn, and Eva Van Leemput (2021). "Effects of Supply Chain Bottlenecks on Prices using Textual Analysis," FEDS Notes. Washington: Board of Governors of the Federal Reserve System, December 03, 2021, https://doi.org/10.17016/2380-7172.3037.
Disclaimer: FEDS Notes are articles in which Board staff offer their own views and present analysis on a range of topics in economics and finance. These articles are shorter and less technically oriented than FEDS Working Papers and IFDP papers.