


FEDS Notes
October 16, 2026
Government Bonds’ Safe-Haven Property and Inflationary Pressures
1. Introduction
Earlier this year, escalation of the conflict in the Middle East resulted in sharp declines in major stock indexes as energy prices rose and the global economic outlook deteriorated, but prices of long-term government bonds in major advanced economies also declined (Figure 1). This prompted some commentators to question the premise that government bonds in these major advanced economies will rally in times of increased risk aversion and serve as a safe haven for investors (see for example, Kim, 2026). In this note we argue that the type of economic shock and inflationary dynamics matter greatly in determining whether bonds provide portfolio insurance and how investors assess their riskiness.
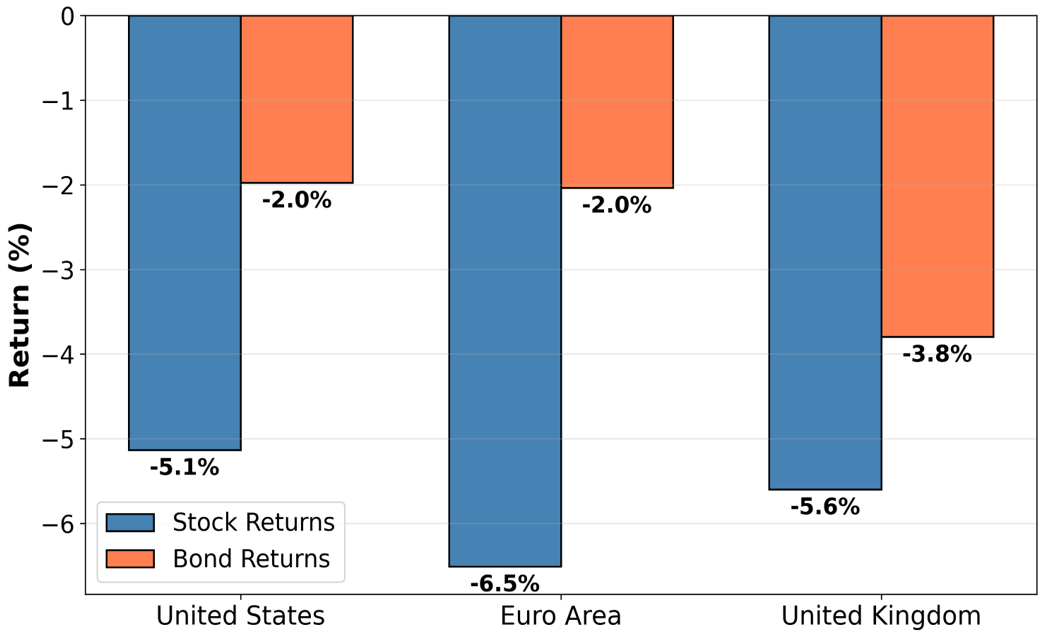
Note: Bond returns are approximated using 10-year on-the-run government bond yields and duration of 7 years. Stock returns are based on the S&P 500, Euro Stoxx, and FTSE 100 indexes for the United States, the euro area, and the United Kingdom, respectively. Euro-area bond yields are German 10-year government bond yields. Key identifies in order from left to right.
Source: Bloomberg.
Conventional wisdom suggests that central banks should look through temporary adverse supply shocks, such as the recent oil price spikes caused by the Middle East conflict. However, these shocks may prove persistent and have second-round effects leading to higher inflation expectations by households and firms. Such considerations are crucial when adverse supply shocks hit the economy in an environment of above-target inflation as persistent deviations from inflation targets may eventually lead inflation expectations to settle at a higher level. Against such a backdrop, bond markets could price in a significantly higher policy path in response to these adverse supply shocks as a tighter policy stance can ensure inflationary effects do not broaden and inflation expectations remain stable. This undermines the traditional safe-haven dynamics. In contrast, when inflation runs close to target and policymakers are not concerned about stability of inflation expectations, bonds can rally even in response to an adverse supply shock as policymakers can lower interest rates to cushion the hit to economic growth.
Motivated by these ideas, we use historical data on stock-bond correlations and inflation forecasts in three major advanced economies to show that the hedging property of bonds crucially depends on stability of inflation expectations and inflationary pressures. We also provide evidence from reactions of stock returns and bond yields to economic news that supports this hypothesis.
2. Stock-Bond Correlations and Inflation Regimes
Before examining the historical patterns, it is useful to understand conceptually how inflation dynamics can affect stock-bond correlations.2 In this note, we focus on the correlation between stock returns and bond yield changes. Therefore, positive correlation means falling stock prices coincide with falling yields (i.e. rising bond prices), as bonds provide portfolio insurance to investors. Negative correlation means falling stock prices coincide with rising yields (i.e. falling bond prices), amplifying portfolio losses on risky assets such as stocks.
Bonds' hedging property depends critically on the inflation environment and the kinds of shocks hitting the economy. When inflation is near target and expectations are well anchored, central banks can ease in response to adverse demand or supply shocks without threatening price stability, so bond prices rise when stock prices fall. However, if inflationary pressures are rising and output is close to potential, central banks may face a tradeoff between supporting growth and maintaining price stability. Adverse supply shocks, particularly those arriving amid above-target inflation, may pose similar challenges as central banks may need to keep policy tight to ensure stability of long-term inflation expectations (Covitz and Engstrom, 2026). In these cases, stock and bond prices can fall together.
2.1 Stock-Bond Correlations Across Three Historical Periods
Figure 2 shows how our measures of stock-bond correlations have evolved in the U.S., the euro area, and the U.K. using a 1-year rolling window. The figure reveals some broad patterns: the correlations were deep into negative territory in the early 1990s, were positive for most of the two decades from 2000 to the Covid pandemic, and then switched to negative in recent years. Table 1 provides a summary of the correlations for each period, isolating the noise from short-term fluctuations in the rolling sample. The patterns are broadly consistent with three distinct inflation regimes, which we will analyze next.
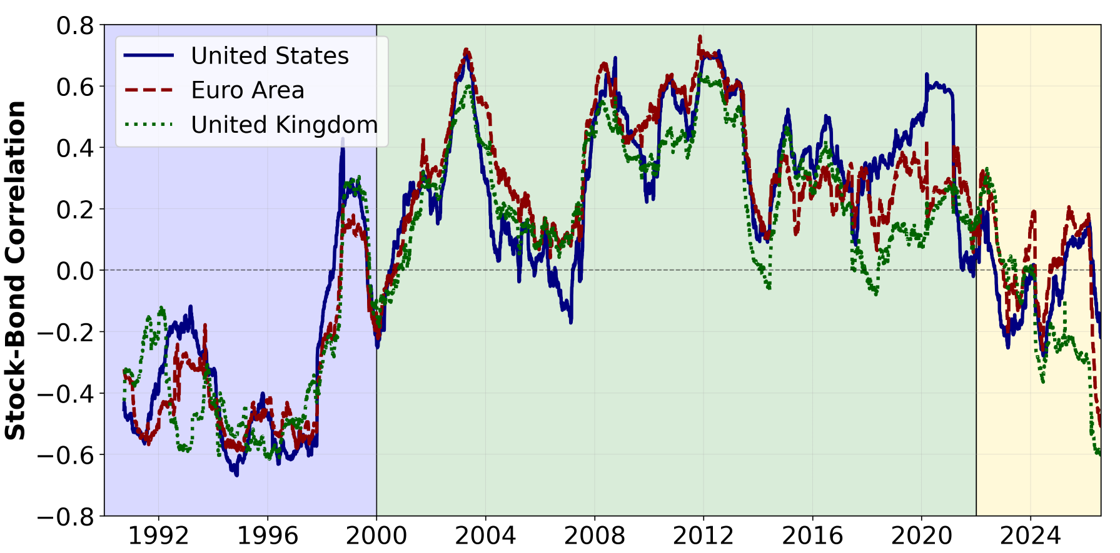
Note: Stock-bond correlation measured as correlation between daily stock returns and daily changes in 10-year government bond yields using 1-year rolling window (252 trading days). Stock returns are based on the S&P 500, Euro Stoxx, and FTSE 100 indexes for the United States, the euro area, and the United Kingdom, respectively. Euro-area bond yields are German 10-year government bond yields. Shaded regions indicate three historical periods: the left shaded area represents the pre-2000 period (1990–1999), the middle shaded area represents 2000–2021, and the right shaded area represents the post-2021 period (2022 onward).
Source: Bloomberg.
Table 1. Stock-Bond Correlations Across Three Historical Periods
| Country | Pre-2000 | 2000-2021 | Post-2021 |
|---|---|---|---|
| United States | -0.26 | 0.4 | -0.09 |
| Euro Area | -0.28 | 0.41 | -0.02 |
| United Kingdom | -0.29 | 0.31 | -0.14 |
Note: Stock-bond correlation measured as correlation between stock returns and changes in 10-year government bond yields over the entire period (not rolling window). Stock returns are based on the S&P 500, Euro Stoxx, and FTSE 100 indexes for the United States, the euro area, and the United Kingdom, respectively. Euro-area bond yields are German 10-year government bond yields. Positive correlation indicates stocks and yields move together; negative correlation indicates stocks and yields move in opposite directions. Sample: 1990-01-01 to 2026-07-31.
Source: Bloomberg.
2.2 Inflation Regimes
We examine the historical evolution of forward-looking inflation measures over the periods discussed above with respect to inflation forecasts from the Consensus Economics survey.3 Figures 3 and 4 plot 1-year and 6-to-10-year ahead inflation forecasts, respectively, over time with the 2 percent inflation goals marked by dashed lines. The 1-year horizon captures near-term inflationary pressures, which shape investors' expectations for the policy path, while the 6-to-10-year horizon indicates whether longer-term inflation expectations remain anchored at those goals.
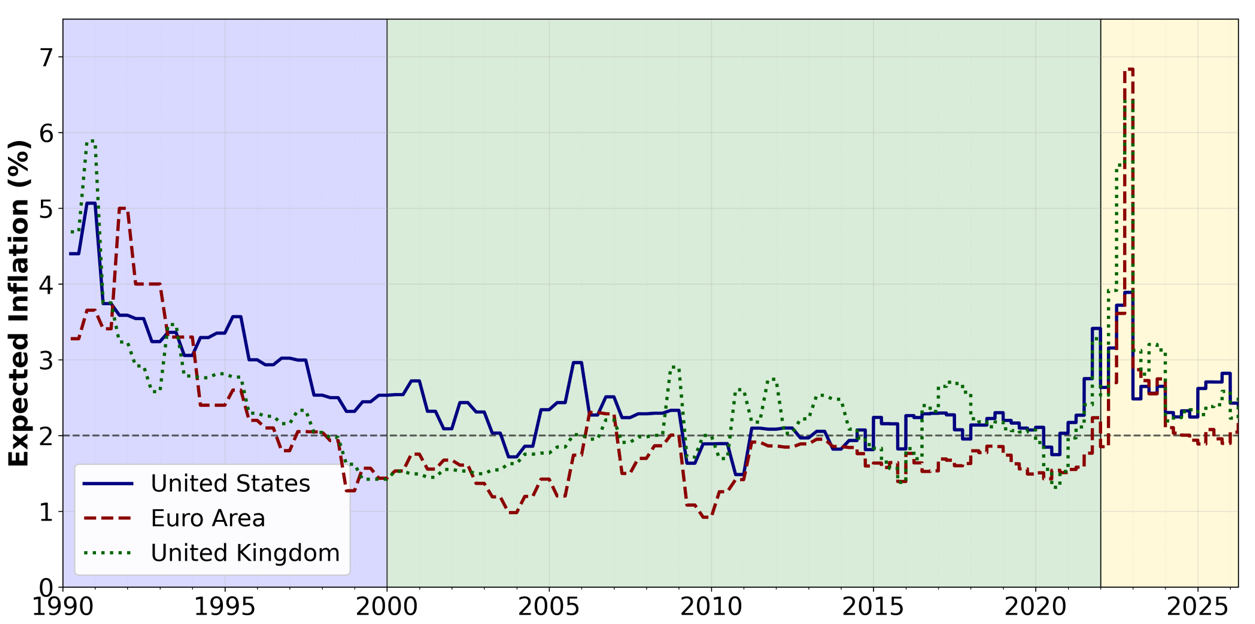
Note: One-year-ahead inflation forecasts from Consensus Economics survey based on CPI. For U.K., CPI forecasts start in 2004Q2, so we converted RPI forecasts to CPI for earlier years using the average RPI-CPI one-year-ahead forecast wedge (about 0.8 percentage point). Dashed line marks 2 percent, the inflation goal of each central bank. Shaded regions indicate three historical periods: the left shaded area represents the pre-2000 period (1990–1999), the middle shaded area represents 2000–2021, and the right shaded area represents the post-2021 period (2022 onward).
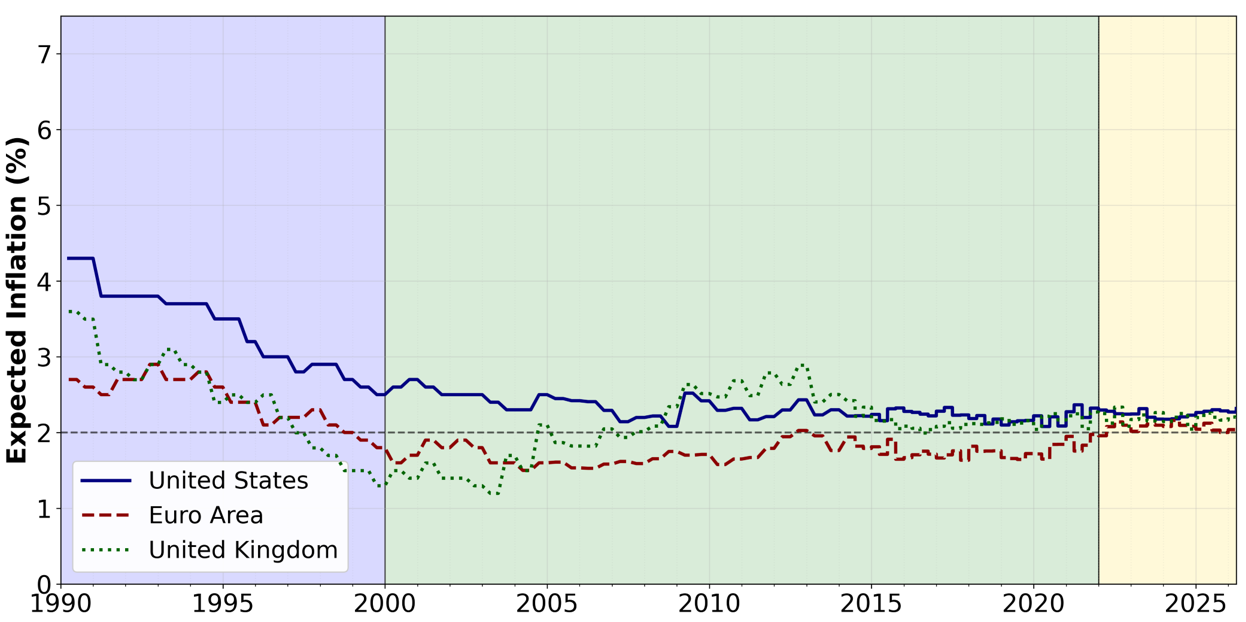
Note: Six-to-ten year-ahead inflation forecasts from Consensus Economics survey based on CPI. For U.K., CPI forecasts start in 2004Q2, so we converted RPI forecasts to CPI for earlier years using the average RPI-CPI six-to-ten-year-ahead forecast wedge (about 0.9 percentage point). Dashed line marks 2 percent, the inflation goal of each central bank. Shaded regions indicate three historical periods: the left shaded area represents the pre-2000 period (1990–1999), the middle shaded area represents 2000–2021, and the right shaded area represents the post-2021 period (2022 onward).
Pre-2000 (Establishing policy credibility): In the early 1990s, inflation expectations were elevated but moved lower and stabilized in the subsequent years as central banks established credibility. The evolution of stock bond correlations in 1990s was consistent with this change in inflation dynamics. Early in the decade, bonds amplified stock downturns in a portfolio, but later in the decade became a hedging asset. The anchoring of inflation expectations gave central banks flexibility to ease in response to adverse demand and supply shocks and support the economy, which made bonds a safe haven for investors in times of falling stock prices.
2000-2021 (Low inflation era): Correlations rose to strongly positive levels, and bonds became an excellent hedging asset during the Global Financial Crisis (GFC) and subsequent years, in part because of quantitative easing (QE). Long-term inflation expectations remained anchored, giving central banks flexibility to ease aggressively in response to market stress and economic weakness. This policy flexibility ensured that bonds rallied when stocks fell, producing the strong positive correlation observed during this period.
Post-2021 (Inflation makes a comeback): In recent years correlations returned to negative territory across all three economies, indicating severe deterioration in bonds' hedging property (Amundi Investment Institute, 2025). The key change was not a fundamental shift in the stability of longer-term inflation expectations, but rather a change in the mix of economic shocks requiring a different monetary policy response. First, the pandemic-induced inflationary pressures proved more persistent and required significantly higher real rates to bring inflation down and ensure stability of longer-term inflation expectations. This created a market environment where it was common for stock and bond prices to fall simultaneously. More recently, adverse supply shocks pushing prices higher in an economy already experiencing above-target inflation led to expectations of tighter policy even during periods of market stress. Bonds' safe-haven dynamics of the low-inflation era broke down.
The historical relationship between stock-bond correlations and the inflation backdrop strongly suggests a systematic relationship between inflationary dynamics and the hedging property of bonds. We next turn to an event study analysis to offer further evidence for this hypothesis.
2.3 Asset Responses to Inflation News
Prior work has established that U.S. macroeconomic news has substantial effects on global financial markets (Boehm and Kroner, 2026), making it natural to study responses across multiple countries simultaneously. Hence, we estimate regressions of each country's daily stock returns and bond yield changes on all three countries' daily inflation surprise indices from Bloomberg (we also include the growth surprise indices as control variables).4
$$$$ \text{Asset Change} = \alpha + \beta_1 \cdot \Delta\text{US Growth} + \beta_2 \cdot \Delta\text{US Inflation} + \beta_3 \cdot \Delta\text{EA Growth} \\ + \beta_4 \cdot \Delta\text{EA Inflation} + \beta_5 \cdot \Delta\text{UK Growth} + \beta_6 \cdot \Delta\text{UK Inflation} + \varepsilon $$$$
Table 2 presents the estimated asset responses to inflation news for the 2000–2019 and post-2021 periods.5 During 2000–2019, bond yields showed only modest sensitivity to inflation news and commensurately stock return responses were insignificant. During this period, inflationary pressures were subdued on average and adverse supply shocks were not common, so investors did not anticipate a significant and sustained change in real interest rates driven by inflation news. As a result, stock prices did not react significantly to inflation news. The modest bond yield increases likely reflected the change in inflation compensation component in response to incoming inflation data.
Table 2: Asset Responses to Multi-Country Inflation News
| Country | Asset | US Inflation News | EA Inflation News | UK Inflation News |
|---|---|---|---|---|
| 2000-2019 | ||||
| United States | Stock Returns | 0.208 | -0.328 | -0.203 |
| (0.42) | (-0.75) | (-0.93) | ||
| 10Y Yield Changes | 0.048** | 0.064*** | 0.011 | |
| (1.96) | (3.02) | (1.02) | ||
| Euro Area | Stock Returns | -0.271 | -0.501 | 0.088 |
| (-0.49) | (-1.05) | (0.38) | ||
| 10Y Yield Changes | 0.009 | 0.056*** | 0.012* | |
| (0.51) | (3.68) | (1.66) | ||
| United Kingdom | Stock Returns | -0.351 | -0.217 | -0.105 |
| (-0.71) | (-0.51) | (-0.51) | ||
| 10Y Yield Changes | 0.014 | 0.058*** | 0.043*** | |
| (0.70) | (3.33) | (5.00) | ||
| Post 2021 | ||||
| United States | Stock Returns | -1.719*** | 0.418 | -0.117 |
| (-3.04) | (0.96) | (-0.51) | ||
| 10Y Yield Changes | 0.155*** | 0.006 | -0.012 | |
| (4.93) | (0.23) | (-0.94) | ||
| Euro Area | Stock Returns | -0.001 | -0.746* | -0.412* |
| (-0.00) | (-1.88) | (-1.92) | ||
| 10Y Yield Changes | 0.113*** | 0.054** | 0.002 | |
| (3.97) | (2.49) | (0.19) | ||
| United Kingdom | Stock Returns | 0.494 | -0.029 | -0.567*** |
| (1.20) | (-0.09) | (-3.39) | ||
| 10Y Yield Changes | 0.078** | 0.02 | 0.044*** | |
| (2.19) | (0.74) | (3.06) | ||
Note: t-statistics in parentheses. *** |t| > 2.576, ** |t| > 1.96, * |t| > 1.645. Coefficients show percentage point change in asset for 1-unit change in surprise index. Stock returns are based on the S&P 500, Euro Stoxx, and FTSE 100 indexes for the United States, the euro area, and the United Kingdom, respectively. Euro-area bond yields are German 10-year government bond yields. Sample periods: 2000-01-01 to 2019-12-31 and 2022-01-01 to 2026-07-31.
Source: Bloomberg.
Post 2021, the picture changes dramatically. Higher-than-expected U.S. inflation news now raises U.S. 10-year yields about three times as much as before and also significantly lifts euro-area and U.K. yields, which did not respond to U.S. inflation news in the 2000–2019 sample. The Fed's global influence was present in both periods, so this change in spillovers likely reflects how much more U.S. inflation news moved investor expectations for Fed policy as U.S. inflation has remained above target since 2021. Stock returns also fall significantly on own-country inflation surprises in the post 2021 period, reflecting increased inflationary pressures. When inflationary pressures are strong, each inflation data release may carry heightened significance because investors reassess central banks' future policy paths and surrounding risks. Moreover, expectations for significantly tighter monetary policy in reaction to adverse inflation news suggest potential growth headwinds, which is bad news for stock investors.
Together, these patterns demonstrate that bond hedging property is not a fixed characteristic but depends critically on the macroeconomic environment and the types of economic shocks. The amplification of bond yield sensitivity to inflation news is the central mechanism breaking bonds' traditional safe-haven dynamics.
3. Discussion and Conclusion
Our analysis shows that government bonds' hedging property depends critically on the inflation environment and the types of economic shocks hitting the economy. When inflationary pressures are limited and inflation expectations are well-anchored, bonds provide reliable hedging because central banks can ease in response to both adverse demand and supply shocks that weigh on stocks. This was the typical experience during the GFC and its aftermath, which solidified bonds' safe-haven role. However, when inflationary pressures build up, such as following the Covid pandemic, the required monetary policy response changes; central banks must balance supporting real activity against their price stability objectives, which breaks the traditional flight-to-quality dynamics. In addition, adverse supply shocks may lead investors to expect tighter monetary policy as central banks seek to keep inflation expectations stable. The result is again a deterioration in bonds' hedging property. Our analysis of historical evolution of stock-bond correlations in relation to inflation regimes and different responses of asset prices to inflation news over time support these conjectures. The post 2021 deterioration in bonds' hedging property largely reflects this shift in the economic environment, not necessarily a fundamental change in bond characteristics. If inflationary pressures abate and the frequency of adverse supply shocks declines, bonds' hedging property is likely to improve.
References
Amundi Investment Institute (2025). "Rethinking the Stock-Bond Correlation." Working Paper 171, March 2025.
Boehm, Christoph E., and T. Niklas Kroner (2026). "The U.S., Economic News, and the Global Financial Cycle." Review of Economic Studies, 93: 215–249.
Covitz, Daniel, and Eric Engstrom (2026). "Why have far-forward nominal Treasury rates increased so much in the past few years? Old risks reemerge in an era of Fed credibility." FEDS Notes, Board of Governors of the Federal Reserve System, February 12, 2026.
Galvao, Ana and Bjorn van Roye (2023). "Economic Data Surprise Indexes" Bloomberg White paper.
Kim, Hakyung (2026). "Bonds have been a poor hedge during the war in Iran." Financial Times, April 18, 2026.
1. The views expressed here are solely those of the authors and should not be interpreted as reflecting the views of the Board of Governors, its staff, or any other person associated with the Federal Reserve System. We thank Stephanie Curcuru and Raven Molloy for very useful comments. Return to text
2. This correlation-based measure provides a simple and transparent view of bond hedging property, though it represents a partial view of bond risk. A complete assessment would also consider duration risk, credit risk, and liquidity risk. Return to text
3. The survey is semi-annual (April and October) from 1990 to approximately 2014, then quarterly thereafter. Alternatively, we could use inflation compensation measures from inflation-linked bonds or inflation swaps, but such measures become available only later in the sample period. Return to text
4. The Bloomberg economic surprise indices are not available for the pre-2000 period. See Galvao and van Roye (2023) for detailed description of these indices. Return to text
5. We exclude the 2020-2021 Covid pandemic period from the analysis as economic releases became less useful during the pandemic, and it took some time for them to go back to normal. Return to text
Li, Canlin, and Emre Yoldas (2026). "Government Bonds’ Safe-Haven Property and Inflationary Pressures," FEDS Notes. Washington: Board of Governors of the Federal Reserve System, October 16, 2026, https://doi.org/10.17016/2380-7172.4128.
Disclaimer: FEDS Notes are articles in which Board staff offer their own views and present analysis on a range of topics in economics and finance. These articles are shorter and less technically oriented than FEDS Working Papers and IFDP papers.