FEDS Notes
June 02, 2026
How U.S. Bank Stock Prices Respond to Geopolitical Risk
Friederike Niepmann, Leslie Sheng Shen, and Joshua Walker*
Geopolitical risk has emerged as a central driver of global financial markets, with episodes such as Russia's invasion of Ukraine and recent conflicts in the Middle East triggering sharp movements in asset prices and increases in market volatility. But not all industries are exposed to such shocks in the same way (Caldara and Iacoviello 2022; Culver, Niepmann, and Shen 2025). This note zooms in on the banking sector, examining how geopolitical risk affects U.S. bank valuations and which institutions are most vulnerable.
Banks, through cross-border lending, foreign subsidiaries, and trading activities, face multifaceted exposure that can affect their profitability via credit losses, disrupted funding markets, and altered fee income. Banks' valuations, in turn, influence their funding costs and capital-raising capacity, ultimately affecting credit supply to the real economy.1 And if geopolitical risk affects some banks more than others, it may create uneven vulnerabilities within the financial system, which would have implications for financial stability.
We examine how U.S. bank valuations—that is, their stock prices—respond to geopolitical risk and identify the institutional characteristics that drive variation across banks. While bank equity indexes broadly track the wider equity market, we document substantial differences between the responses of individual banks' stock prices. In particular, we find that banks with weaker earnings, smaller liquidity buffers, and larger operations in geopolitically stressed regions experience significantly larger equity declines from global geopolitical shocks.
How Bank Stock Prices Respond Relative to Other Industries
Industries differ substantially in their exposure to geopolitical risk. A natural way to measure such exposure is through the sensitivity of stock prices to changes in geopolitical risk, as changes in stock prices capture investors' expectations about how heightened risk will affect future profitability. As Culver, Niepmann, and Shen (2025) document, international conflicts can hurt some industries (for example, travel and transportation) and benefit others (for example, pharmaceuticals and defense).
We assess the effect of geopolitical risk on the banking sector by estimating the sensitivity of U.S. bank stocks, specifically the KBW Bank Index, to changes in the Caldara and Iacoviello (2022) daily global geopolitical risk (GPR) index. The KBW Bank Index tracks the performance of 24 major U.S. banking stocks and serves as a benchmark for the banking sector. Caldara and Iacoviello's GPR index is based on the content of newspaper articles and how frequently they include references to adverse geopolitical events and associated risks. The appendix accompanying this note describes our regression analysis associating daily changes in the KBW Bank Index to the GPR index.
The results from our analysis reveal three important patterns. First, bank stock indexes exhibit significant negative responses to GPR index increases when we do not account for the S&P 500 return, which reflects the status of the broader equity market. We estimate that a one-standard-deviation increase in the GPR index is associated with an approximately 0.1 percentage point decrease in the price of bank stocks. Second, bank stock prices are more sensitive to geopolitical risk during crisis episodes. Our analysis capturing the Global Financial Crisis, the European Sovereign Debt Crisis, and the COVID-19 pandemic suggests that a rise in geopolitical risk weighed on bank stock prices in particular during these episodes. This is consistent with the idea that markets are more sensitive to adverse geopolitical news when financial conditions are already strained. Third, when we control for the S&P 500 return, the effect of a change in the GPR index becomes small and statistically insignificant. This suggests that bank stock prices, on average, move in line with the broader equity market during geopolitical shocks.
Figure 1 shows changes in the S&P 500 index (solid line) and the KBW Bank Index (dashed line) around major geopolitical risk events. Specifically, we show movements around the terrorist attacks in Paris in 2015, Iranian missile attacks on U.S. bases in Iraq in 2020, Russia's invasion of Ukraine in 2022, and Liberation Day in 2025, when the United States introduced reciprocal tariffs on its imports. While there was some divergence around specific events, such as the outbreak of the Russia–Ukraine war, overall, both indexes moved largely in parallel as geopolitical events unfolded.
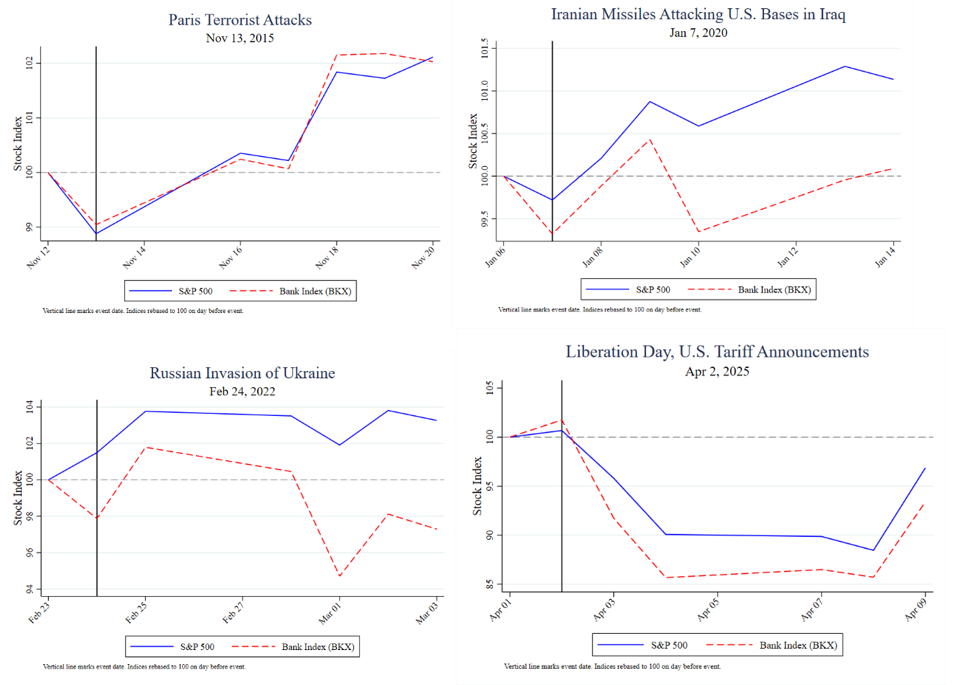
Notes: This figure plots log changes in the KBW Bank Index (BKX) and the S&P 500 around major geopolitical events. In each panel, the vertical line marks the date of the event. The indexes are normalized to 100 on the day before the event to facilitate comparison of their movements over time. Log changes can be interpreted approximately as percentage changes.
Sources: Bloomberg, Caldara and Iacoviello (2022), and authors' calculations.
The similarity between the responses of bank stock prices and the overall equity market to geopolitical risk likely reflects offsetting effects. On the one hand, banks often benefit from volatility through higher trading volume, which boosts their fee income. Additionally, geopolitical risk can trigger a rise in inflation and potentially higher interest rates, which banks can benefit from through higher net interest income. On the other hand, geopolitical risk can dampen economic activity (Caldara and Iacoviello 2022), reduce loan demand, and increase credit risk. For globally active banks, geopolitical shocks can have a direct effect through their foreign operations, as shown in Niepmann and Shen (2025).
Substantial Heterogeneity in Stock-price Sensitivity across Banks
While the banking sector as a whole responds to geopolitical risk similarly to the broader equity market, we find substantial variation across individual institutions. We measure bank-specific sensitivity to geopolitical risk by estimating bank-specific GPR betas.
A bank's GPR beta measures how its stock price tends to respond to changes in geopolitical risk. We estimate this relationship using daily stock returns (log changes in stock prices) and daily changes in the GPR index over the period from January 2000 to June 2025. Specifically, we relate stock returns to next-day changes in the GPR index because the index is constructed from newspaper coverage, which tends to reflect geopolitical developments with a short delay relative to financial markets. This estimated sensitivity coefficient captures how strongly a bank's stock price reacts, on average, to changes in geopolitical risk. A more negative value indicates that the bank's stock price tends to decline more sharply when geopolitical risk increases.
We focus on 38 large U.S. banks with at least 12 years of stock price data since 2000. This sample includes major universal banks, large regional institutions, and specialized banks, providing a diverse cross section of business models and geographic footprints.
Figure 2 charts the distribution of the estimated GPR betas for the 38 banks. While most banks experience negative stock price responses to geopolitical risk increases, the magnitude of this response varies considerably across institutions. GPR betas range from approximately –0.33 to –0.06, with a median of approximately –0.19. The median beta implies that a one-standard-deviation increase in the GPR index reduces bank stock prices by about 0.1 percentage point, which is consistent with our findings concerning the response of the KBW Bank Index to changes in the GPR index. This heterogeneity raises a natural question: Which bank characteristics explain the variation in GPR sensitivity?
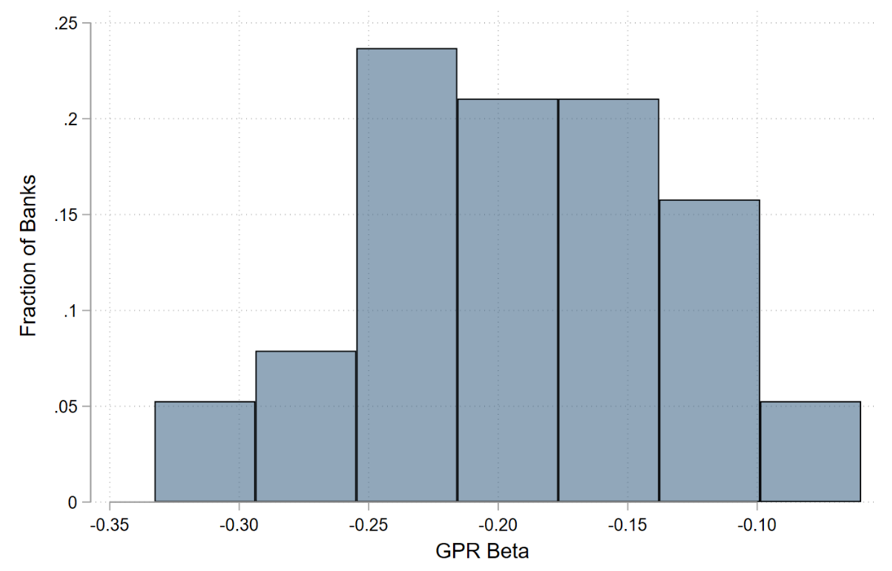
Notes: The figure shows the distribution of the estimated GPR beta coefficients across 38 U.S. banks.
Sources: Caldara and Iacoviello (2022), CRSP, and authors' calculations.
Explaining the Heterogeneity
To understand what drives differences in banks' stock price sensitivity to geopolitical risk, we examine the explanatory power of seven bank characteristics2:
- Tier 1 Capital ratio: Better-capitalized banks—those with a high ratio of regulatory capital to risk-weighted assets—may be more resilient to shocks, potentially exhibiting lower GPR sensitivity.
- Return on assets: More profitable banks—those that generate higher earnings relative to their assets—may be better positioned to deal with the effects of heightened geopolitical risk and continue distributing capital to shareholders.
- Liquid-asset ratio: Banks with larger liquidity buffers—measured as a high ratio of cash and securities to total assets—may be better protected during periods of market stress.
- Non-performing loan ratio: Non-performing loans are loans on which borrowers have fallen behind on payments or stopped making payments altogether. If a large share of a bank's loans are in default or significantly overdue, the bank may be more constrained in distributing profits and therefore more vulnerable to geopolitical risk shocks.
- Trading-assets share: Trading assets are securities and financial instruments held primarily for short-term resale or market-making activities. Banks with larger trading operations may benefit from volatility-induced fee income, potentially offsetting negative effects of geopolitical risk.
- Internationalization: Banks with larger foreign operations may face greater direct exposure to geopolitical events.
- Geography of foreign operations: Beyond the overall extent of international activity, banks with greater exposure to countries experiencing geopolitical risk may be more vulnerable to geopolitical shocks.
We measure whether the geography of banks' foreign operations matters by following Niepmann and Shen (2025) and constructing bank-specific geopolitical risk (BGPR). BGPR captures not just whether a bank is internationally active, but where it operates and whether those foreign countries are experiencing geopolitical risk.3 Because claims data from FFIEC 009 reports are available at quarterly frequency while country-specific GPR indexes from Caldara and Iacoviello (2022) are available monthly, BGPR is a monthly measure of bank-specific geopolitical risk. We construct other explanatory variables using balance sheet data from regulatory filings (FFIEC031 or FR Y-9C reports), which we merge with stock price and GPR data.
We explore the explanatory power of the proposed variables using two complementary approaches. First, we relate the estimated bank betas to each bank's average characteristics over the sample period (Figure 3). Second, we estimate panel regressions that relate individual banks' daily excess stock returns to changes in the GPR index while allowing this relationship to vary with bank characteristics (Figure 4).
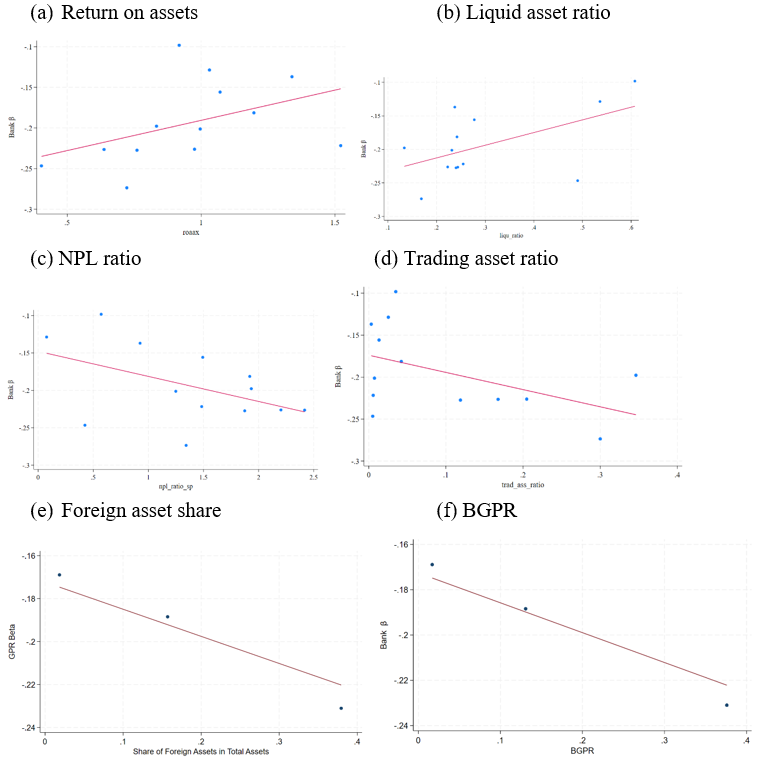
Notes: The various panels in the figure plot the relationship between different bank characteristics and estimated GPR betas, showing bin scatter plots in panels (e) and (f) to preserve the confidentiality of the data. Each point represents the (average) estimated GPR beta and the corresponding bank characteristic. BGPR is computed following Niepmann and Shen (2025) by weighting country-level GPR indexes by each bank's geographic exposure shares and is summed over the sample period of stock returns used to estimate the GPR beta of each bank. The line shows the fitted relationship from a linear regression.
Sources: FR Y-9C regulatory filings, FFIEC 009, Caldara and Iacoviello (2022), CRSP, and authors' calculations.
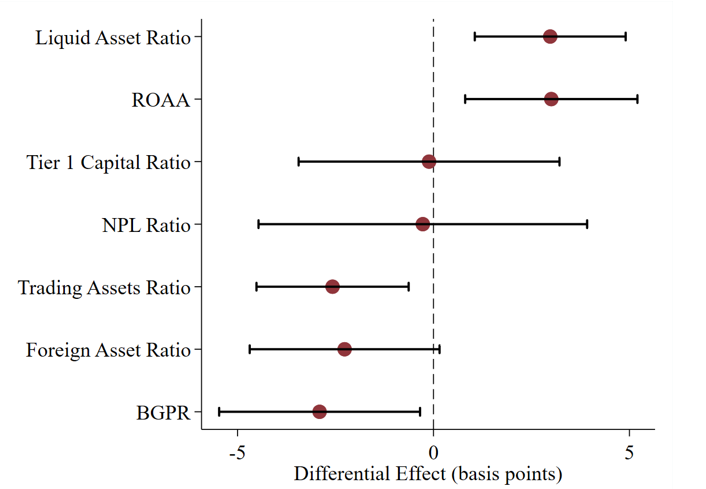
Notes: Each bar shows the difference in the stock return response to a one-standard-deviation increase in the GPR index between a bank at the 90th percentile and a bank at the 10th percentile of the indicated characteristic. Units are basis points. Bank characteristics other than BGPR are measured with a 60-trading-day lag. Estimates are based on separate regressions of daily log equity returns on the GPR index interacted with each characteristic for large banks (total assets ≥ $250 million), controlling for day fixed effects. Whiskers denote 95 percent confidence intervals. Standard errors are clustered by bank for balance sheet variables and by day for BGPR. See the appendix for more details.
Sources: FR Y-9C regulatory filings, FFIEC 009 Caldara and Iacoviello (2022), CRSP, and authors' calculations.
Specifically, we examine in a regression framework how the response of bank excess stock returns to changes in the global GPR index depends on lagged bank characteristics measured at the quarterly or monthly frequency. This approach allows the sensitivity of stock returns to geopolitical risk to differ systematically across banks with different balance sheet features, while controlling for each bank stock's typical co-movement with the broader stock market.4 Time fixed effects are included to absorb common shocks affecting all banks at a given point in time, and the regression pools observations across all banks rather than estimating separate regressions for each institution.
Formally, the regression specification is:
$$$$ ExR_{b,t}=\alpha_t+\beta_1\ \Delta\log{\left(GPR_{t+1}\right)}+\beta_2\ \Delta\log{\left(GPR_{t+1}\right)}\times Z_{b,q-1}+\epsilon_{b,t}\ (1)$$$$
where $$Z_{b,q-1}$$ represents the bank-level characteristics at quarterly or monthly frequency of bank b. As before, $$ExR_{b,t}$$ is the daily excess return of bank $$b$$ on day $$t$$, and $$\Delta\log{\left(GPR_{t+1}\right)}$$ is the daily log change in the Caldara-Iacoviello global GPR index on the following day, divided by 100. $$\alpha_t$$ are time-fixed effects.
In our analysis, we examine heterogeneity in stock price responses among smaller and larger banks separately. The relationships are substantially stronger for the larger banks—those with more than $200 billion in average total assets. These institutions are generally more internationally active and more integrated into global financial markets and therefore more exposed to the cross-border channels through which geopolitical risk is likely to operate. This is consistent with the broader literature on global banks and international shock transmission (for example, Peek and Rosengren 1999 and Fillat, Garetto, and Corea-Smith 2023). Several of the factors we propose significantly explain differences in stock price responses within this group of banks. By contrast, we find fewer robust relationships between bank characteristics and geopolitical risk sensitivity among smaller, more domestically oriented banks.5
Figures 3 and 4 show the results based on our analysis of the 13 largest banks. Figure 3 plots the relationship between each bank characteristic and estimated GPR betas. Figure 4 quantifies these relationships based on the regression analysis: Each bar shows, in basis points, the differential excess stock return response to a one-standard-deviation increase in the GPR index between banks at the 90th and 10th percentiles of each characteristic based on the regressions reported in Appendix Table A2.
Capitalization does not seem to systematically affect banks' stock price responses to geopolitical shocks.6 By contrast, profitability matters: A bank at the 90th percentile of return on average assets experiences a 3 basis point smaller decline in stock prices compared with a bank at the 10th percentile, which is consistent with greater profits increasing banks' ability to distribute capital under adverse circumstances. Banks that have larger liquidity buffers exhibit lower sensitivity to geopolitical risk by the same magnitude. This is consistent with the view that liquidity provides protection during periods of elevated uncertainty and market stress when funding costs may rise.
The non-performing loan ratio shows a negative relationship with GPR betas, providing some evidence that asset quality affects geopolitical risk sensitivity, though the effect is not statistically significant. The results run counter to the hypothesis that trading banks benefit from volatility: A bank at the 90th percentile of the trading assets share experiences a 3 basis point larger decline than one at the 10th percentile, suggesting that the risks associated with holding trading positions during geopolitical turmoil outweigh the potential fee income benefits, at least from the perspective of equity investors.
Internationalization matters, in terms of both the extent to which a bank operates abroad and the geographic locations of their foreign operations. A bank at the 90th percentile of the foreign claims share experiences a 2 basis point larger decline in response a one-standard-deviation increase in the GPR index compared with a bank at the 10th percentile, although the difference is statistically significant at only the 10 percent significance level.
The effect is slightly more pronounced for BGPR, which captures not just whether a bank is internationally active but where it operates and whether those countries face heightened geopolitical risk: The differential between the 90th and 10th percentiles is 3 basis points. This result echoes findings by Niepmann and Shen (2025), who show that banks reduce lending and tighten credit standards when BGPR increases.7 The stock market response documented here suggests that investors anticipate these operational consequences and price them into bank valuations. Relative to the baseline effect of a one-standard-deviation change in the GPR index on bank stock returns of about –10 basis points, a differential effect across banks of as much as 3 basis points appears notable.
Our findings shed light on financial stability risks in an era of elevated and evolving geopolitical tensions. With mounting geopolitical conflict, pressures on banks can build indirectly through weaker economic activity and rising inflation, higher loan losses, and volatility in financial markets as well as through direct exposure to conflict. As economic fragmentation progresses and supply chains realign, banks face differentiated exposures depending on whom they lend to and where they operate. At the same time, their balance sheet vulnerabilities differ. Banks with higher profits and more liquid assets appear better positioned to weather geopolitical risk shocks. The stock market responses for the largest U.S. banks documented here suggest that investors recognize these vulnerabilities and price them into bank valuations, highlighting how geopolitical risk affects financial institutions unevenly.
References
Caldara, Dario, and Matteo Iacoviello. 2022. "Measuring Geopolitical Risk." American Economic Review 112(4): 1194–1225.
Converse, Nathan, and Anil Jain. 2024 "Do Banks Gain from Inflation? Evidence from Inflation Surprises." Working Paper.
Culver, Isabel, Friederike Niepmann, and Leslie Shen Sheng. 2025. "Measuring Geopolitical Risk Exposure Across Industries: A Firm-Centered Approach." FEDS Notes. Washington: Board of Governors of the Federal Reserve System. August 29, 2025.
Dieckelmann, Daniel, Chloe Larkou, Peter McQuade, Cosimo Pancaro, and Denise Röβler. 2025. "Geopolitical Risk and Euro Area Bank CDS Spreads and Stock Prices: Evidence from a New Index." Economics Letters 254: 112461. https://doi.org/10.1016/j.econlet.2025.112461.
Fillat, José L., Stefania Garetto, and Arthur V. Corea-Smith. 2023. "Global Banking and the International Transmission of Shocks: A Quantitative Analysis." Journal of International Economics 145: 103808. https://doi.org/10.1016/j.jinteco.2023.103808.
Niepmann, Friederike, and Leslie Sheng Shen. 2025. "Geopolitical Risk and Global Banking." International Finance Discussion Papers 1418. Washington: Board of Governors of the Federal Reserve System. https://doi.org/10.17016/IFDP.2025.1418
Peek, Joe. and Eric S Rosengren. 2000. "Collateral Damage: Effects of the Japanese Bank Crisis on Real Activity in the United States." American Economic Review 90(1): 30–45.
Appendix
Figure A1 and Table A1 present results from regressions of daily log changes in the KBW index on the one-day-ahead daily log change in the GPR index (divided by 100 for readability), both unconditionally and controlling for the S&P 500 return. We allow stock returns to respond to next-day changes in the GPR index because the index is constructed from newspaper coverage, which tends to reflect geopolitical developments with a short delay relative to financial markets. This approach follows Caldara and Iacoviello (2022).
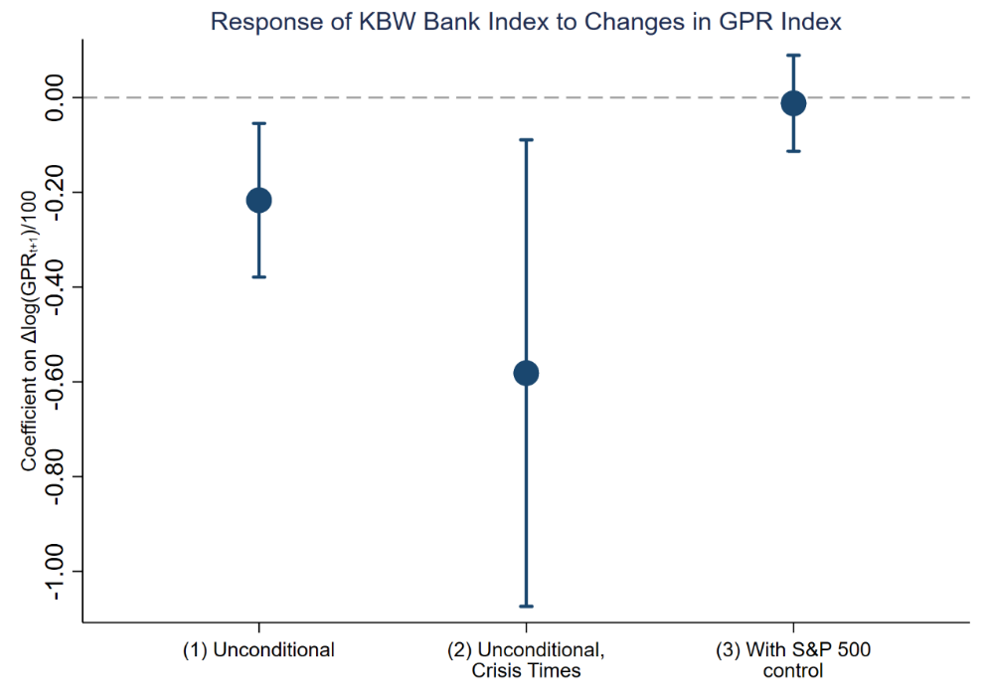
Notes: This figure plots the estimated coefficients from a regression of the log change in the KBW Bank Index (BKX) on the log changes of the GGPR index unconditionally (columns 1 and 2) and conditioned on the return of the S&P 500 index (column 3).
Sources: Bloomberg, Caldara and Iacoviello (2022), and authors' calculations.
Table A1: The Response of the KBW Bank Index to Changes in the GPR Index
| $$\Delta\log(KBW_t)$$ | (1) | (2) | (3) | (4) |
|---|---|---|---|---|
| $$\Delta\log(GPR_{t+1})$$ | -0.217** | -0.0811 | -0.0121 | 0.012 |
| (0.0827) | (0.0637) | (0.0517) | (0.047) | |
| 1(crisis) | -0.00205** | -0.000769 | ||
| (0.00101) | (0.000591) | |||
| 1(crisis) $$\text{x} \Delta\log(GPR_{t+1})$$ | -0.501* | -0.0900 | ||
| (0.259) | (0.150) | |||
| $$\Delta\log \text{(S&P)}500_{t+1})$$ | 1.440*** | 1.439*** | ||
| (0.0387) | (0.0386) | |||
| Observations | 4,689 | 4,689 | 4,689 | 4,689 |
| R-squared | 0.002 | 0.005 | 0.619 | 0.619 |
Notes: This table reports regression coefficients from estimating the relationship between daily log changes in the KBW Bank Index and one-day-ahead daily log changes in the Caldara-Iacoviello (2022) GPR index. $$\Delta\log(GPR_{t+1})$$ has been divided by 100 for readability. Crisis is a dummy that takes the value of one during the Global Financial Crisis (8/9/2007-3/9/2009), the European Sovereign Debt crisis (1/14/2010-7/26/2012) and the Covid 19 pandemic (2/24/2020-12/31/2020). Columns (1) and (2) show the unconditional relationship. Columns (3) and (4) control for contemporaneous S&P 500 returns. The sample period extends from January 2007 to January 2026. Robust standard errors are in parentheses. *** p<0.01, ** p<0.05, * p<0.1.
Sources: Caldara and Iacoviello (2022), Bloomberg, and authors' calculations.
Table A2: Explaining Heterogeneity across Banks in their Stock Price Sensitivities
| $$\Delta\log(price_{b,t})$$ | (1) | (2) | (3) | (4) | (5) | (6) | (7) | (8) |
|---|---|---|---|---|---|---|---|---|
| $$\Delta\log(GPR_{t+1})$$ | -0.0623 | |||||||
| (0.0423) | ||||||||
| $$\text{Capital ratio}_{b,q-1}$$ | -2.38e-06 | |||||||
| (3.23e-06) | ||||||||
| $$\text{Capital ratio}_{b,q-1} \text{x} \Delta\log(GPR_{t+1})$$ | -0.000174 | |||||||
| (0.00261) | ||||||||
| $$ROAA_{b,q-1}$$ | -0.000160 | |||||||
| (0.000118) | ||||||||
| $$ROAA_{b,q-1} \text{x} \Delta\log(GPR_{t+1})$$ | 0.0852** | |||||||
| (0.0318) | ||||||||
| $$\text{Liquid asset ratio}_{b,q-1}$$ | 0.000185 | |||||||
| (0.000125) | ||||||||
| $$\text{Liquid asset ratio}_{b,q-1} \text{x} \Delta\log(GPR_{t+1})$$ | 0.292** | |||||||
| (0.0963) | ||||||||
| $$\text{NPL ratio}_{b,q-1}$$ | 1.46e-05 | |||||||
| (2.37e-05) | ||||||||
| $$\text{NPL ratio}_{b,q-1} \text{x} \Delta\log(GPR_{t+1})$$ | -0.00202 | |||||||
| (0.0159) | ||||||||
| $$\text{Trading asset ratio}_{b,q-1}$$ | -0.000405** | |||||||
| (0.000185) | ||||||||
| $$\text{Trading asset ratio}_{b,q-1} \text{x} \Delta\log(GPR_{t+1})$$ | -0.226** | |||||||
| (0.0868) | ||||||||
| $$\text{Foreign claims share}_{b,q-1}$$ | -0.000200** | |||||||
| (8.75e-05) | ||||||||
| $$\text{Foreign claims share}_{b,q-1} \text{x} \Delta\log(GPR_{t+1})$$ | -0.133* | |||||||
| (0.0727) | ||||||||
| $$BGPR_{b,m-1}$$ | 0.000217*** | |||||||
| (5.92e-05) | ||||||||
| $$BGPR_{b,m-1} \text{x} \Delta\log(GPR_{t+1})$$ | -0.170** | |||||||
| (0.0614) | ||||||||
| Time FE | no | yes | yes | yes | yes | yes | yes | yes |
| Observations | 58,892 | 58,892 | 30,152 | 58,892 | 56,161 | 58,892 | 58,892 | 58,892 |
| R-squared | 0.000 | 0.529 | 0.590 | 0.529 | 0.529 | 0.529 | 0.529 | 0.529 |
Notes: This table reports the regression results from equation 1. Capital ratio is Tier 1 capital divided by risk-weighted assets. ROAA is return on average assets. Liquid-asset ratio is cash plus securities divided by total assets. NPL ratio is non-performing loans divided by total loans. Trading-assets ratio is trading assets divided by total assets. Foreign claims share is foreign claims divided by total assets. BGPR is the bank-specific geopolitical risk index following the methodology in Niepmann and Shen (2025). Standard errors clustered by time in column (1) and by bank in the remaining columns are in parentheses. *** p<0.01, ** p<0.05, * p<0.1.
Sources: FR Y-9C, FFIEC031, and FFIEC009 regulatory filings; Caldara and Iacoviello (2022); CRSP; and authors' calculations.
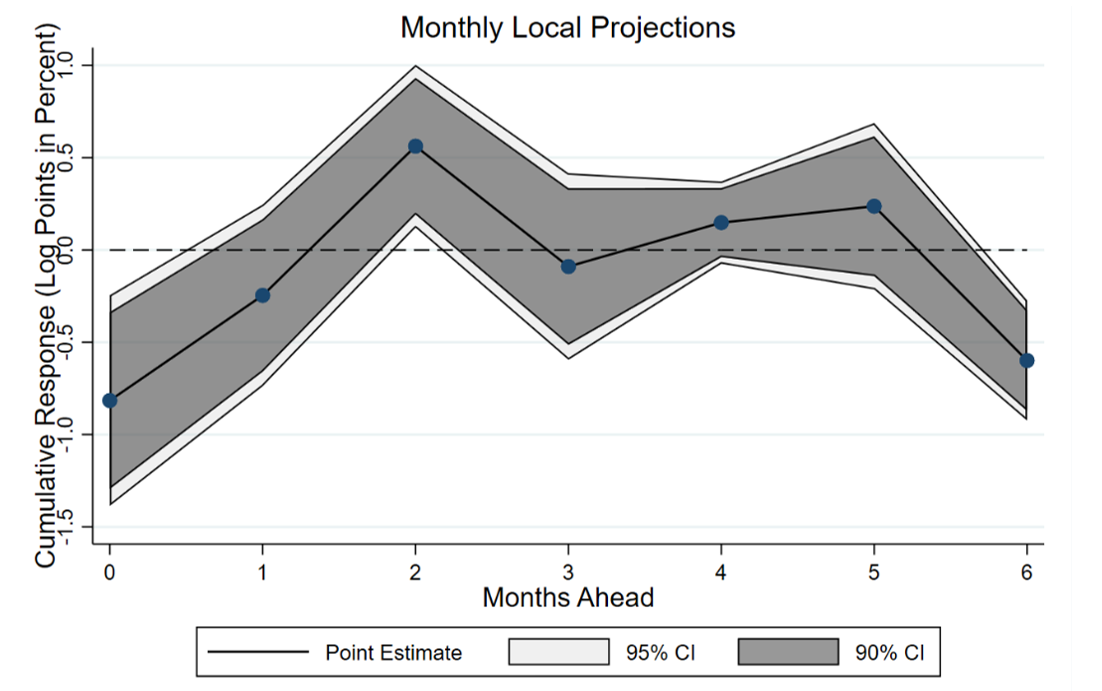
Notes: The figure shows the cumulative response over six months of U.S. bank stock prices to a shock to BGPR. The local projections include one lag and are estimated over a six-month horizon. The regression equation includes bank-fixed effects and four bank-level controls: a bank's Tier1 capital ratio, its non-performing loan ration, its return on average assets, and its liquid-asset ratio. Standard errors are clustered at the bank level. The sample includes 30 banks.
Sources: FR Y-9C regulatory filings, Caldara and Iacoviello (2022), CRSP, and authors' calculations.
* The analysis and conclusions set forth are those of the authors and do not indicate concurrence by other members of the research staff or the Board of Governors of the Federal Reserve System. The authors would like to thank Isabel Culver for analytical support.
Friederike Niepmann is an economist and assistant director in the Division of International Finance at the Federal Reserve Board. Leslie Sheng Shen is a principal economist in the Federal Reserve Bank of Boston Research Department. Joshua Walker is a senior research assistant at the Federal Reserve Board. Return to text
1. Geopolitical risk shocks tend to be inflationary and can lead to tighter monetary policy. Banks can benefit from higher inflation through higher interest rates raising net interest income (Converse and Jain 2024). Therefore, in principle, geopolitical risk, through higher inflation and interest rates, could be positive for bank valuations. In our analysis, we tested for this channel but did not find evidence for its relevance. Return to text
2. Following Converse and Jain (2024), we also investigated whether greater securities holdings or larger short-term deposit liabilities predict a larger negative effect of GPR on a bank's excess return because banks with these characteristics tend to benefit more from inflation, which GPR can increase. However, we did not find evidence for this channel. Return to text
3. Specifically, BGPR is constructed as a weighted average of country-level geopolitical risk indices, where each country's weight corresponds to the share of the bank's total assets represented by its claims on that country (measured with a lag). For countries without available country-specific GPR indices, we use the global GPR index expressed in shares of articles mentioning words related to geopolitical risk in line with the country-level GPR indices. Return to text
4. We obtain excess returns $$ExR_{b,t}$$ by regressing, bank-by-bank, daily stock returns on daily S&P500 returns and calculating the residuals from these regressions. We run rolling-window regressions with a window length of 120 business days. Return to text
5. For the set of smaller banks, we find that only the non-performing loans ratio consistently affects the sensitivity of bank stock prices to geopolitical risk—when the ratio rises, stock price sensitivity increases. The coefficient on the foreign asset share tends to be positive, but other bank characteristics do not robustly predict the stock price responses of smaller banks to GPR. Return to text
6. Figure 3 omits a panel showing the relationship between the GPR beta and the Tier1 capital ratio; our analysis finds no relationship between these two variables. Return to text
7. The predictive power of BGPR for bank stock prices is supported by local projection estimates that additionally shed light on the dynamics of the effects. The results of local projections of monthly bank stock returns on monthly BGPR with one lag and a six-month horizon are shown in Appendix Figure A2. The figure indicates that the effects of BGPR on stock prices occur immediately during the first month of a BGPR shock with effects largely reversed by month 3. This result is in line with the findings by Dieckelmann et al. (2025). Return to text
Niepmann, Friederike, Leslie Sheng Shen, and Joshua Walker (2026). "How U.S. Bank Stock Prices Respond to Geopolitical Risk," FEDS Notes. Washington: Board of Governors of the Federal Reserve System, June 02, 2026, https://doi.org/10.17016/2380-7172.4091.
Disclaimer: FEDS Notes are articles in which Board staff offer their own views and present analysis on a range of topics in economics and finance. These articles are shorter and less technically oriented than FEDS Working Papers and IFDP papers.