FEDS Notes
November 19, 2025
Implications of Growth in ETFs: Evidence from Mutual Fund to ETF Conversions
Mehmet Saglam and Tugkan Tuzun
1. Introduction
The growth in exchange-traded funds (ETFs) in the United States has coincided with outflows from mutual funds. As shown in figure 1, in the past 10 years, there have been strong inflows into equity ETFs while equity mutual funds have experienced notable outflows. The shift from mutual funds to ETFs gives rise to questions about how this trend affects the stocks that these funds hold. For example, does this shift improve or hurt market liquidity? Does it increase or decrease stock volatility?
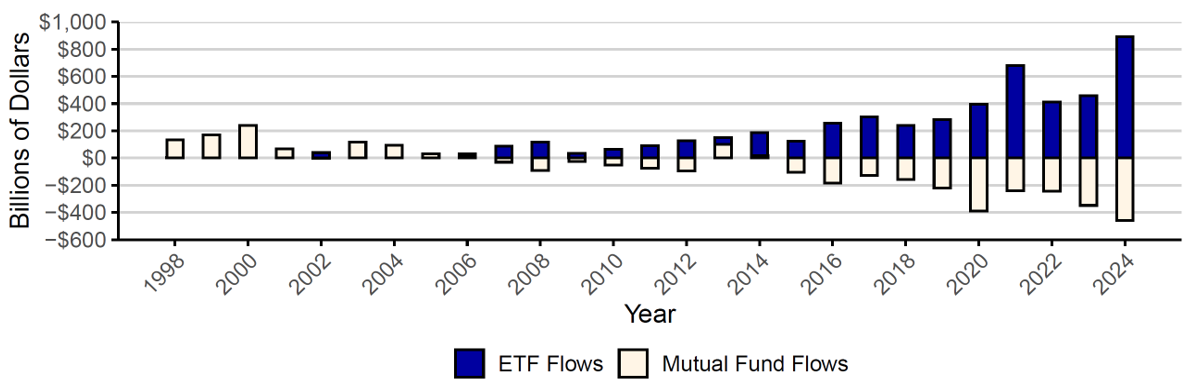
Source: Morningstar Direct.
In this note, we try to answer these questions by focusing on conversions of mutual funds to ETFs. The U.S. Securities Exchange Commission (SEC) issued a rule in 2019 that significantly simplified and streamlined the creation of new ETFs.1 Following this rule's adoption, 125 mutual funds were converted to ETFs as of the end of 2024. These conversions totaled roughly $80 billion, with about $1.6 billion worth of conversions on average each month. Conversions from mutual funds to ETFs were particularly large in June 2021, when a large asset manager converted several of its equity mutual funds into ETFs. These mutual funds held over $30 billion worth of U.S. equities prior to their conversions to ETFs. This transfer of $30 billion of stocks from mutual funds to ETFs on a single day provides a novel setting to study the implications of the shift from mutual funds to ETFs in the U.S. equity market.
Specifically, we analyze how these conversions affected equity market volatility and liquidity. Our results suggest that the conversions to ETFs improve market quality by increasing market liquidity and lowering stock price volatility.
2. Mutual Fund to ETF Conversions
An asset manager converted several of its mutual funds into ETFs on June 11, 2021.2 In its filing for the conversions, the asset manager stated that "Each [ETF] will pursue the same investment objective and investment strategies as the corresponding [mutual fund] but in the ETF structure. ETFs have the same investment objective and investment strategies as the converting mutual fund." The converted funds are "plain vanilla," that is, they do not follow exotic strategies such as levered or inverse investment objectives. The primary motivation behind these conversions appears to have been exploiting the ETF structure's tax efficiencies.
Table 1 lists the mutual funds that were converted to ETFs by the asset manager on June 11, 2021. The conversions transferred ownership of about $30 billion worth of U.S. stocks from mutual funds to ETFs.
Table 1: Mutual Funds Converted to ETFs on June 11, 2021
| Mutual Fund Name | Converted ETF Name | Net Assets (Billion) |
|---|---|---|
| DFA T.A. US Core Equity 2 | Dimensional US Core Equity 2 ETF | $13.32 |
| DFA Tax-Managed US Equity | Dimensional US Equity ETF | $5.58 |
| DFA Tax-Managed US Small Cap | Dimensional US Small Cap ETF | $3.97 |
| DFA Tax-Managed US Targeted Value | Dimensional US Targeted Value ETF | $5.91 |
Source: Center for Research in Security Prices, CRSP Survivor-Bias-Free US Mutual Fund Database, Wharton Research Data Services.
Our main analysis focuses on the ETF ownership increase around these conversions. Using quarterly holdings data, we identify stocks held by the converting mutual funds before June 11. Table 2 shows that 2,449 stocks were impacted with 0.27% of their ownership being transferred from mutual funds to ETFs, on average.3 There was considerable variation in the effects on ownership. Changes were very small for some stocks but exceeded about 0.5 percent for a quarter of the sample. Hence, these conversions created meaningful variation in ETF ownership for the underlying stocks.
Table 2: Summary statistics. All statistics (except $$\Delta \text{ETF}$$ ownership) are the last observations immediately before the conversion date of June 11, 2021.
| Statistic | N | Mean | Std. Dev. | Min. | 25th Percentile | Median | 75th Percentile | Max. |
|---|---|---|---|---|---|---|---|---|
| $$\Delta \text{ETF}$$ Ownership (%) | 2,449 | 0.27 | 0.25 | 0.0001 | 0.05 | 0.18 | 0.47 | 1.34 |
| Effective Spread (%) | 2,449 | 0.35 | 0.5 | 0.02 | 0.09 | 0.19 | 0.4 | 6.6 |
| Volatility (%) | 2,448 | 3.13 | 1.71 | 0.17 | 2.04 | 2.72 | 3.81 | 20.93 |
| Market Cap ($Billion) | 2,449 | 15.71 | 76.84 | 0.007 | 0.5 | 2.04 | 7.54 | 2,043.80 |
Source: Center for Research in Security Prices, CRSP Survivor-Bias-Free US Mutual Fund Database, Wharton Research Data Services. Center for Research in Security Prices, CRSP 1925 US Stock Database, Wharton Research Data Services. New York Stock Exchange, Daily TAQ (Historical Trades & Quotes), Wharton Research Data Services and Intraday Indicators by WRDS.
3. Results
3.1 Volatility effect
We first examine the impact of ETF ownership changes on stock volatility by analyzing volatility patterns for affected stocks around the conversion event. As shown in figure 2, stocks with larger changes in ownership due to the ETF conversions (labeled "High ETF Ownership Increase") experienced lower volatility following the conversion date.
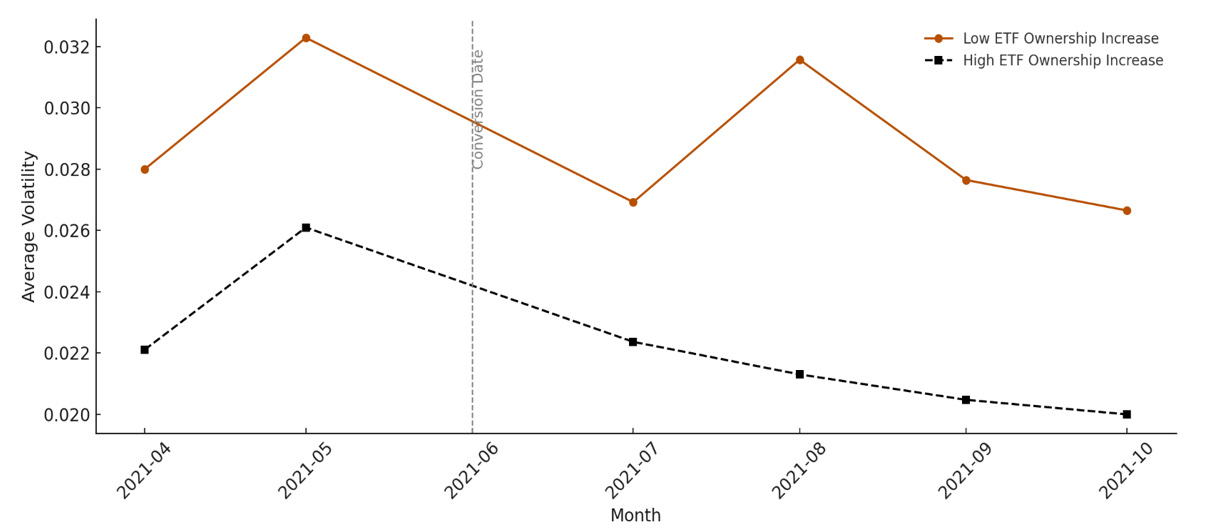
Source: Center for Research in Security Prices, CRSP Survivor-Bias-Free US Mutual Fund Database, Wharton Research Data Services. Center for Research in Security Prices, CRSP 1925 US Stock Database, Wharton Research Data Services.
To analyze this relationship more rigorously, we run the following regression specification:
$$$$\Delta \text{Volatility}_i = \beta_0 + \beta_1 \Delta \text{ETF_Ownership}_i + \gamma' X_i + \epsilon_i\ (1)$$$$
where the dependent variable is the percentage change in volatility for stock $$i$$ between March 2021 and September 2021, $$\Delta \text{ETF_Ownership}_i$$ is the corresponding change in ETF ownership over the same period, and $$X_i$$ is a vector of control variables including percentage changes in market capitalization and trading volume. Volatilities for March and September 2021 are the standard deviations of daily returns in each month.
Table 3 presents the regression results. We use the percentage change in volatility as the main dependent variable. Column (1) shows the baseline specification with only ETF ownership changes. The coefficient on ETF ownership changes is −10.39 and is statistically significant at the 1% level. This indicates that a one percentage point increase in ETF ownership is associated with a decline in daily return volatility of over 10 percent.
Table 3: ETF Conversions and Stock Volatility
| Dependent variable: $$\Delta \text{Volatility}$$ (%) |
|||
|---|---|---|---|
| (1) | (2) | (3) | |
| $$\Delta \text{ETF_Ownership}$$ | −10.39*** | −8.66*** | −7.96*** |
| (2.89) | (2.89) | (2.77) | |
| % Change in Market Cap | 0.11*** | 0.11*** | |
| (0.04) | (0.04) | ||
| % Change in Volume | 0.01*** | ||
| (0.001) | |||
| Constant | −0.23*** | −0.24*** | −0.24*** |
| (0.01) | (0.01) | (0.01) | |
| Observations | 2,427 | 2,427 | 2,427 |
| Adjusted $$R^2$$ | 0.004 | 0.01 | 0.07 |
Notes: Heteroskedasticity-adjusted standard errors are reported in parentheses. *** denotes significance at 0.01 level.
Source: Center for Research in Security Prices, CRSP Survivor-Bias-Free US Mutual Fund Database, Wharton Research Data Services. Center for Research in Security Prices, CRSP 1925 US Stock Database, Wharton Research Data Services. New York Stock Exchange, Daily TAQ (Historical Trades & Quotes), Wharton Research Data Services and Intraday Indicators by WRDS.
Columns (2)-(3) progressively add control variables. Column (2) adds changes in market capitalization, and column (3) further controls for changes in trading volume. Increases in market capitalization and trading volume are both associated with greater increases in volatility.4
Across all specifications, the negative relation between change in ETF ownership and change in volatility remains economically and statistically significant, with coefficients ranging from −7.96 to −10.39. The most conservative coefficient suggests that a one percentage point increase in ETF ownership is associated with a 7.96 percent decline in daily return volatility. For example, for a stock with 2 percent daily volatility, this effect would amount to a 16 basis point decline in daily volatility. This finding differs from Ben-David et al. (2018), who find that ETF ownership increases stock price volatility.
3.2 Liquidity effect
We examine the impact of ETF ownership changes on stock liquidity using the following regression specification:
$$$$\Delta \text{EffectiveSpread}_i = \beta_0 + \beta_1 \Delta \text{ETF_Ownership}_i + \gamma' X_i + \epsilon_i\ (2)$$$$
where $$\Delta \text{EffectiveSpread}_i$$ is the change in the effective spread for stock $$i$$ between March 2021 and September 2021. $$\Delta \text{ETF_Ownership}_i$$ is the corresponding change in ETF ownership over the same period, and $$X_i$$ is a vector of control variables including changes in market capitalization, and trading volume. The effective spread is defined as the transaction price minus the mid-point of the bid and ask prices divided by the mid-point, and it is calculated using daily trade-weighted averages from Trade and Quotes (TAQ) data.
Table 4 presents the regression results. Column (1) shows the baseline specification with only ETF ownership changes. The coefficient for ETF ownership changes is -0.06 and statistically significant at the 5% level, indicating that a one percentage point increase in ETF ownership is associated with a 6 basis point reduction in effective spreads.
Table 4: ETF Conversions and Stock Liquidity
| Dependent variable: $$\Delta \text{EffectiveSpread}$$ |
|||
|---|---|---|---|
| (1) | (2) | (3) | |
| $$\Delta \text{ETF_Ownership}$$ | −0.06*** | −0.07*** | −0.07*** |
| (0.02) | (0.02) | (0.02) | |
| % Market Cap Change | −0.001*** | −0.001*** | |
| (0.0002) | (0.0002) | ||
| % Volume Change | −0.0000 | ||
| (0.0000) | |||
| Constant | −0.0004*** | −0.0003*** | −0.0002*** |
| (0.0001) | (0.0001) | (0.0001) | |
| Observations | 2,431 | 2,431 | 2,431 |
| Adjusted $$R^2$$ | 0.003 | 0.03 | 0.03 |
Notes: Heteroskedasticity-adjusted standard errors are reported in parentheses. *** denotes significance at 0.01 level.
Source: Center for Research in Security Prices, CRSP Survivor-Bias-Free US Mutual Fund Database, Wharton Research Data Services. Center for Research in Security Prices, CRSP 1925 US Stock Database, Wharton Research Data Services. New York Stock Exchange, Daily TAQ (Historical Trades & Quotes), Wharton Research Data Services and Intraday Indicators by WRDS.
Columns (2)-(3) progressively add control variables. Column (2) controls for changes in market capitalization, and column (3) further controls for changes in trading volume, both measured on a percentage basis. Across all specifications, the negative relationship between changes in ETF ownership and changes in effective spreads remains economically and statistically significant, with coefficients being either -0.06 or -0.07.5 These results suggest that increases in ETF ownership lead to meaningful improvements in stock liquidity, consistent with findings that ETFs can enhance the liquidity of the securities they hold (Saglam et al., 2025).
4. Conclusion
We analyze the effects of large conversions of mutual funds to ETFs in June 2021 to show that increases in ETF ownership led to significant decreases in stock price volatility and greater market liquidity. This result runs contrary to concerns that plain-vanilla ETFs may amplify price volatility in the stocks they hold. Our findings are consistent with the view that ETFs improve the market quality of the stocks in their portfolios by lowering their price volatility and increasing their market liquidity.
References
Ben-David, I., F. Franzoni, and R. Moussawi (2018). Do ETFs increase volatility? The Journal of Finance.
Saglam, M., T. Tuzun, and R. Wermers (2025). Do ETFs increase liquidity? Working Paper.
1. See https://www.sec.gov/newsroom/press-releases/2019-190. Return to text
2. See https://www.sec.gov/Archives/edgar/data/1816125/000179420221000103/dimensionaletf497.htm. Return to text
3. There is not enough data to compute the volatility of one stock that was impacted from the conversions. Return to text
4. The results are similar even after including change in effective spread as a control variable. Return to text
5. The results are similar even when we also include change in daily volatility as a control variable. Return to text
Saglam, Mehmet, and Tugkan Tuzun (2025). "Implications of Growth in ETFs: Evidence from Mutual Fund to ETF Conversions," FEDS Notes. Washington: Board of Governors of the Federal Reserve System, November 19, 2025, https://doi.org/10.17016/2380-7172.3909.
Disclaimer: FEDS Notes are articles in which Board staff offer their own views and present analysis on a range of topics in economics and finance. These articles are shorter and less technically oriented than FEDS Working Papers and IFDP papers.