FEDS Notes
June 20, 2018
Where’s the Money Going? The Importance of Accounting for Rent Payments in Measuring a Household’s Financial Obligations
Andrew C. Chang, Joanne W. Hsu, Sarah J. Pack, and Michael G. Palumbo 1
Note: This note was updated on June 29, 2018 to correct the accessible version of Figure 3.
According to the Federal Reserve Board's Survey of Consumer Finances (SCF), in 2016 about 12 percent of American families' monthly income was needed to cover payments associated with the various types of debt they owed--mostly mortgages, car loans, student loans, and credit card bills.2 This fraction was significantly lower than the 16-1/2 percent of monthly income needed to cover such payments in 2010 and noticeably below the average of 14 percent needed from 2004 to 2010. This recent fall in monthly debt payments means that the fraction of American families' income that is "uncommitted" to debt payments has risen. At face value, this rise in families' uncommitted income indicates an overall increase in their financial "cushion." That is, the rise in uncommitted income could be expected to give families some additional flexibility to weather adverse economic shocks or to accumulate wealth.3
However, monthly rent payments--which are not included in the particular measure of committed debt payments cited above--are sizable for many families. With the fall in homeownership in recent years, rent payments have likely become more important in the aggregate.
To get a more comprehensive picture of how families' uncommitted income has evolved since the financial crisis, we analyze a broader measure of households' committed monthly payments that includes rent for renters, as well as payments to cover mortgages for homeowners and other debt obligations for all families.4 We focus on families with below-median incomes, as they tend to have much smaller fractions of uncommitted income and, thus, appear to have a much smaller financial cushion.
Compared with the debt-payments measure, financial obligations inclusive of families' rent payments point to a smaller increase in families' uncommitted incomes since the financial crisis--and no net increase for families with below-median income levels (as a group). For these lower-income families, monthly rent payments have increased since the financial crisis, offsetting their small reduction in required debt payments and suggesting no net material improvement in their financial cushions.
On Average the Financial Cushion of American Families has Improved since the Financial Crisis
We take the ratio of required monthly payments to pre-tax income as a summary measure of families' financial vulnerability and the complement of this ratio--uncommitted monthly income--as an indicator of their financial cushion. All else equal, a high ratio of uncommitted to total monthly income indicates a family with more resources available to pay for an unexpected financial need, to weather loss in earnings, or to build up savings for future circumstances. We consider families with required payment-to-income ratios above 40 percent--or, equivalently, with uncommitted monthly income below 60 percent of total income--more likely than others to be in a particularly vulnerable financial position.
First, we consider the evolution of both debt-only and rent-inclusive versions of payment-to-income ratios (PIRs) over time. Figure 1 plots the median monthly payments needed to cover families' debt obligations from 1995 through 2016 as a proportion of monthly income, in blue, and our more comprehensive measure, in red, that adds in monthly rent payments for renters and monthly payments for leased autos. Both lines show declines in monthly payment ratios since the financial crisis (that is, following the 2007 survey) and values in 2016 near the bottom of their range since 1995. Still, the median rent-inclusive PIR is about twice the value of the debt-only ratio in all years. This suggests that using the debt payment-to-income ratio considerably understates the actual payment burdens faced by American families and, thus, their financial vulnerability.
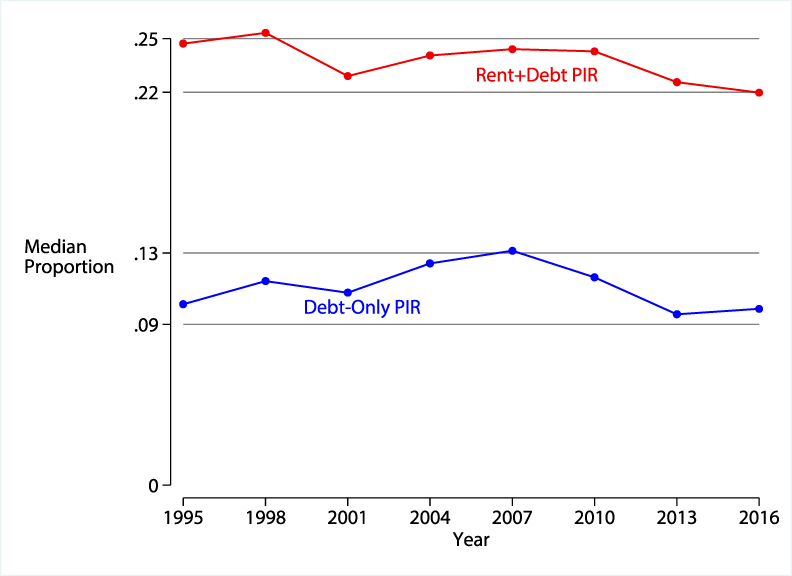
Description: This figure plots medians for two distinct measures of PIRs using the SCF from 1995 through 2016. Debt-only PIR is defined in Bricker et al. (2017) and is the ratio of mortgage debt, revolving consumer debt, and non-revolving consumer debt to income. The broader measure ("Rent+Debt PIR") also includes auto lease and housing rent payments.
Figure 2 plots the percent of families with high-burden payment commitments, which we define as PIRs exceeding 40 percent of monthly income. These measures convey a broadly similar pattern to median PIRs: when only families' debt payments are considered (blue line), this measure of financial vulnerability looked quite low in 2016 by the standards since 1995 and showed a substantial improvement between 2007 and 2016. While the rent-inclusive PIR (red line) has also improved since the financial crisis, in 2016 20 percent of families continued to face high rent-inclusive PIRs and, therefore, a relatively small financial cushion. These high payment burdens could make it difficult for families to qualify for additional credit, or manage any additional expenditures should urgent needs arise. In all, Figures 1 and 2 portray a less sanguine state of financial stability for American families when rents are factored into the required payment measures.
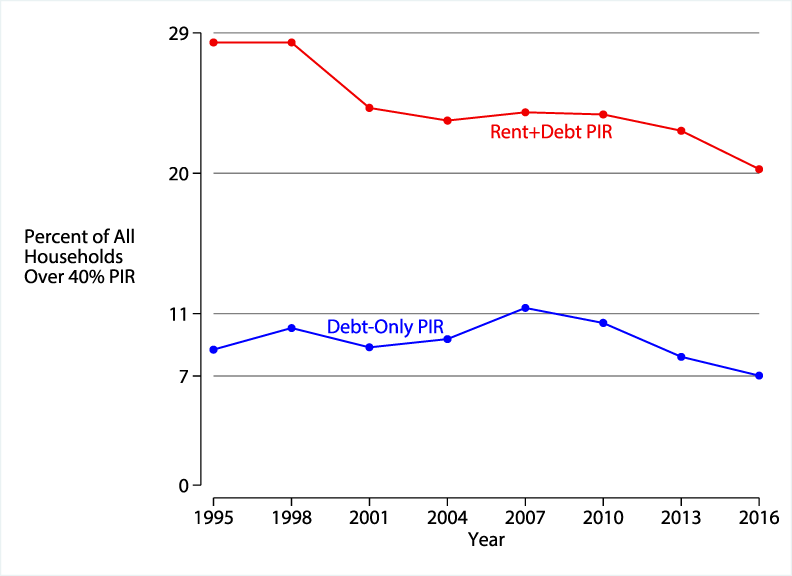
Description: This figure plots the percentage of households with PIRs exceeding 40 percent and shows that, in 2016, those percentages were lower than in any survey since 1995.
There Have Been Fewer, If Any, Improvements in the Financial Cushion of Lower-Income Households since the Financial Crisis
Debt-only PIRs miss the fact that lower-income households spend a disproportionate share of their incomes on rent (Larrimore and Schuetz, 2017). High PIRs leave families with little uncommitted income available, which would be particularly challenging for families with few assets to draw upon in the event of a shock or to finance investments.
Figure 3 plots the cumulative change, since the financial crisis (that is, after the 2007 survey), in median rent-inclusive PIRs for families in three different income groups.5 The negative light red and dark red bars in 2016 imply that families in the top 10 percent (light red) and the next 40 percent (dark red) of the income distribution have less financial vulnerability and greater financial stability in 2016 than in previous years. These patterns stand in contrast to the black bars that cover families in the bottom half of the income distribution. For these families with relatively low incomes, rent-inclusive PIRs actually increased somewhat in the years following the financial crisis, indicating that, as a group, their financial cushions were unimproved despite a lengthy overall economic recovery.
Figure 3: Measured by rent-inclusive PIRs, higher-income households have lower required payments now than during the financial crisis, but lower-income households face higher required payments
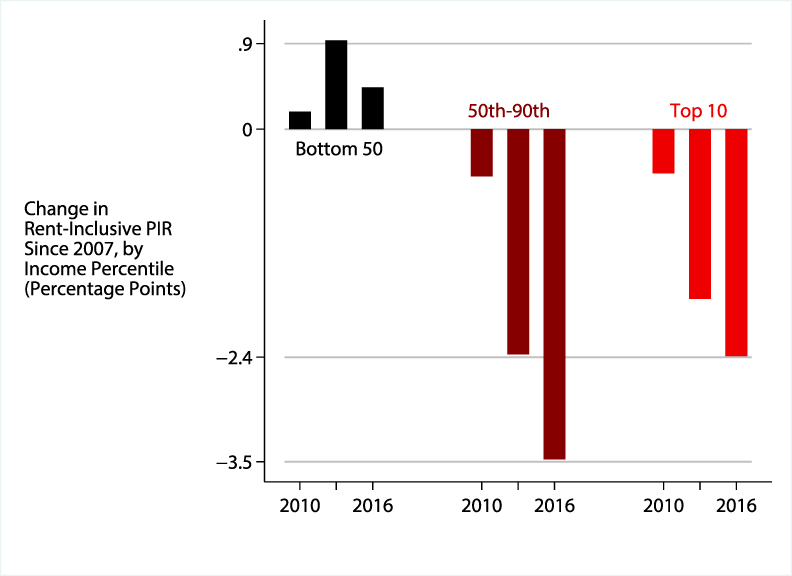
Description: This figure plots the cumulative percentage point change, since 2007, in rent-inclusive PIRs for three usual-income percentile groups: below-median (black, left three bars), the 50th-90th percentiles (dark red, middle three bars), and the top 10 percent (light red, right three bars).
Figure 4 plots median PIRs for these families using the rent-inclusive measure (red) and the debt-only measure (blue). For most families with relatively low incomes, monthly debt payments represent 5 percent or less of their income and median debt PIRs have improved after peaking in 2004. However, when rent is factored in the ratio of payments to income is about 30 percent and suggests no net improvement in families' financial cushions since the financial crisis.6
Figure 4: Rent-inclusive PIRs are significantly higher than debt-only PIRs for families with incomes below the median level
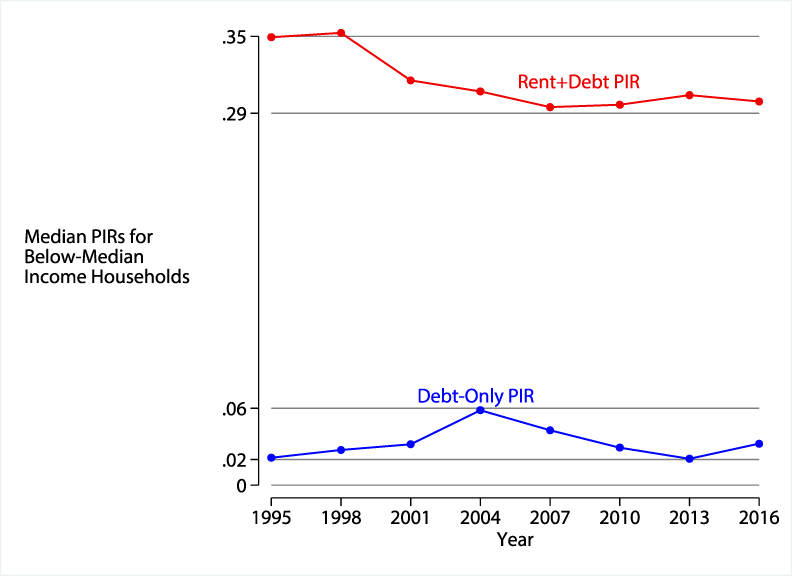
Description: This figure plots debt-only and rent-inclusive PIRs for families with below-median usual income.
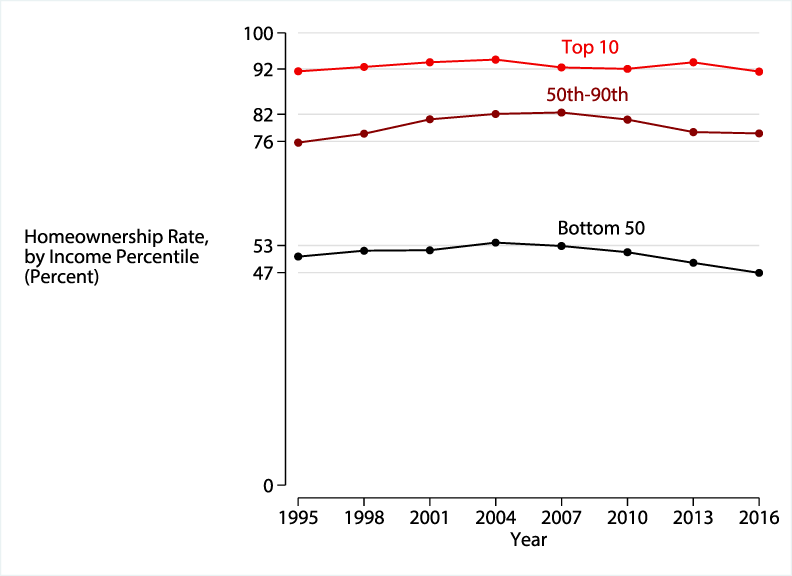
The rise in rent-inclusive PIRs for below-median income households suggests that many of these households are about as vulnerable as near the onset of the financial crisis, as more of their income is committed to rent payments, possibly at the expense of saving for down payments for home purchases. As shown in Figure 5, homeownership rates have fallen for all income groups since the financial crisis, but the decline in rates has been most dramatic for below-median income households. Moreover, the homeownership rate for below-median income families was lower in 2016 than in any of the prior surveys back to 1995.
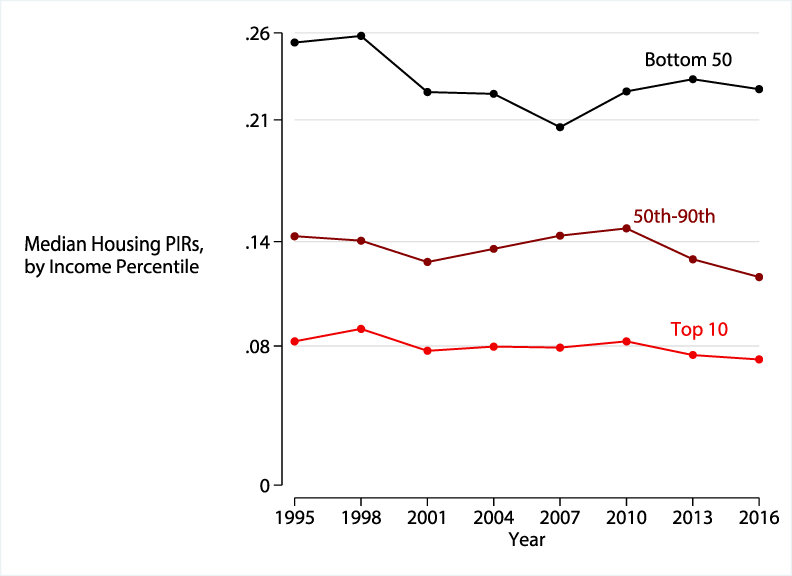
Despite falling homeownership rates, below-median income households are paying more for housing when both mortgage payments and rent payments are considered. Figure 6 plots the ratio of total payments on housing to income, by income group. While above-median income households have seen a decrease in the fraction of their incomes devoted to housing expenditures since 2007, below-median income households are spending an increasing share of their incomes.
Works Cited
Bricker, Jesse, Lisa J. Dettling, Alice Henriques, Joanne W. Hsu, Lindsay Jacobs, Kevin B. Moore, Sarah Pack, John Sabelhaus, Jeffrey Thompson, and Richard A. Windle (2017). "Changes in U.S. Family Finances from 2013 to 2016: Evidence from the Survey of Consumer Finances," Federal Reserve Bulletin, vol. 103, no. 3 (September), pp. 1-42, https://www.federalreserve.gov/publications/files/scf17.pdf .
Dynan, Karen, Kathleen Johnson, and Karen Pence (2003). "Recent Changes to a Measure of U.S. Household Debt Service," Federal Reserve Bulletin, vol. 89 (October), pp. 417-426, https://www.federalreserve.gov/pubs/bulletin/2003/1103lead.pdf .
Larrimore, Jeff, and Jenny Schuetz (2017). "Assessing the Severity of Rent Burden on Low-Income Families," FEDS Notes. Washington: Board of Governors of the Federal Reserve System, December 22, 2017, https://doi.org/10.17016/2380-7172.2111 .
1. All four authors are from the Division of Research and Statistics, Board of Governors of the Federal Reserve System, 20th St. NW and Constitution Ave. Washington DC, 20551 USA. We thank Sarena F. Goodman, Kevin B. Moore, and Karen Pence for helpful comments. Return to text
2. The figure of 12 percent is the ratio of aggregate monthly payments on households' debt obligation to their aggregate monthly income, as reported in the top row of table 5 in Bricker et al. (2017). For many households, a much larger fraction of income is required to cover monthly debt payments, and the second row of table 5 in that paper reports that, in 2016, 36 percent of income was needed to cover monthly payments for the median family in the SCF owing some debt. Return to text
3. The extra income uncommitted to debt payments could also be used for additional "ordinary" or ongoing expenditures rather than future contingencies. Return to text
4. In a recent complementary analysis of data from the American Community Survey, Larrimore and Schuetz (2017) show that, among families in the bottom 20 percent of the income distribution, rising real rents were accompanied by falling real incomes between 2000 and 2015, resulting in a material increase in relative "rent burdens." Our work extends theirs by factoring in monthly payments required to service families' debt obligations. Our analysis also builds on Dynan, Johnson, and Pence (2003), who developed an improved methodology for estimating both average household minimum required debt payments and a second, broader measure of minimum required payments. Here, we analyze financial obligations within the distribution of households. Return to text
5. We grouped families by their self-reported "usual" level of income. This income measure is intended to capture a version of family income that abstracts from transitory fluctuations (both up and down) that may have occurred during the year covered by the survey and approximates the economic concept of permanent income. For additional detail, see Box 4, "Usual versus Actual Income," in Bricker, et al. (2017). Return to text
6. Lower-income households also tend to have few liquid assets. For example, in 2016, households below the 50th percentile of usual income had median liquid assets of $1,150, where "liquid" is defined as the sum of the dollar value for transactions accounts, call accounts at brokerages, and prepaid cards. Return to text
Chang, Andrew C., Joanne W. Hsu, Sarah J. Pack, and Michael G. Palumbo (2018). "Where’s the Money Going? The Importance of Accounting for Rent Payments in Measuring a Household’s Financial Obligations," FEDS Notes. Washington: Board of Governors of the Federal Reserve System, June 20, 2018, https://doi.org/10.17016/2380-7172.2213.
Disclaimer: FEDS Notes are articles in which Board staff offer their own views and present analysis on a range of topics in economics and finance. These articles are shorter and less technically oriented than FEDS Working Papers and IFDP papers.