FEDS Notes
May 22, 2026
Measurement of “Computer Software and Accessories” Inflation
Alessandro Barbarino, Anthony M. Diercks, and Stephen Miran
From November 2025 to March 2026, the "Computer Software and Accessories" category of the Personal Consumption Expenditures (PCE) price index made an unprecedented contribution to the rise in core and core goods inflation.1 Figure 1 shows the historical average since 2000 for core and core goods inflation while excluding software (blue bars) along with the contribution of software (gray bars). The figure also displays the most recent observation, calculated as a four-month annualized inflation rate through March 2026.2 Notably, the recent software contributions are more than 9 standard deviations above their historical means.
Figure 1. PCE Inflation Decomposition: Historical Average (since 2000) vs March 2026 (Annualized 4-mo. Rate)
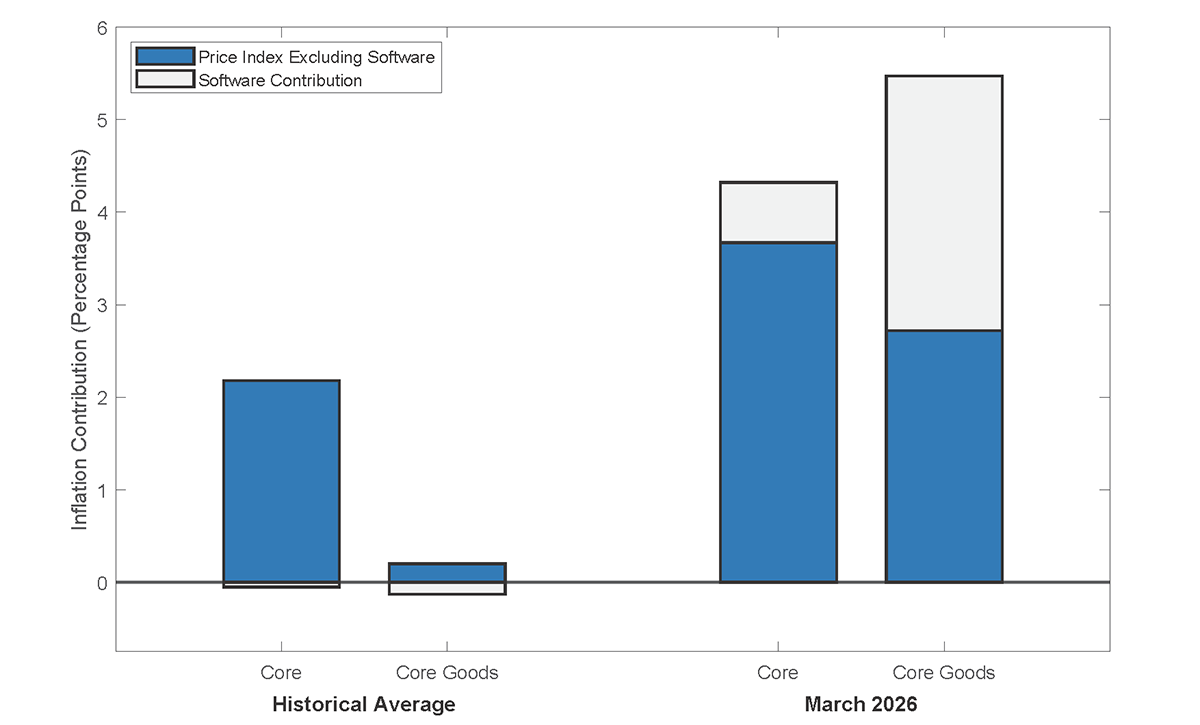
Note: The figure shows the average historical contribution since 2000 for software (gray bars) and the most recent contributions for the four-month annualized rate on the right. The four-month annualized rate is intended to capture developments since November 2025. Data is from the Bureau of Economic Analysis.
Since November, the annualized difference between core PCE and core PCE excluding software is two-thirds of a percentage point. This is a notable contribution as core PCE has risen 4.4 percent (annualized) over the last four months and is particularly striking given that the software category comprises only 1.2 percent of the core PCE basket and has trended downward for decades.3
The effect is even more pronounced when examining the core goods component of the PCE price index. Core goods PCE has risen at a 5.5 percent annualized rate over the past four months. Because the software category comprises 5.1 percent of the core goods basket, it accounts for approximately 2.8 percentage points of that increase, or over half.4 Consequently, core goods PCE excluding software would be running at 2.7 percent over the past four months (still well above its near-zero historical mean). This indicates that the unusually large software readings are an important driver of the recent elevated levels of core goods inflation.5
Part of the recent increase in the PCE "Computer Software and Accessories" category may be the product of measurement error. In particular, we describe three channels through which measurement error may contaminate the contributions of "Computer Software and Accessories" to PCE inflation:
- The BEA category contains no physical IT accessories, while the CPI category includes flash drives and blank media. The BEA uses the "Computer Software and Accessories" CPI price index to deflate the "Computer Software and Accessories" PCE category. However, the products in this category in the CPI only partially overlap with the products in the category in the PCE.
- Changes in pricing practices by software providers may confound standard measurement practices and induce bias in the "Computer Software and Accessories" CPI index, as matched-model comparisons become more difficult.
- Finally, the lack of explicit quality adjustment in the CPI "Computer Software and Accessories" index may be problematic, particularly in light of the recent surge of AI-related software and improvements in products (e.g., Microsoft Excel with an LLM is superior to without).
In this note we investigate the potential mismeasurement sources that we have identified and propose possible adjustments. We estimate that accounting for the category mismatch between BLS and BEA reduces the contribution of "Computer Software and Accessories" to core goods PCE by up to 25 percent. Furthermore, we find that one of our quality adjustment scenarios, in combination with the category mismatch adjustment, could offset well over half of the rise in the "Computer Software and Accessories" price index.
The remainder of this note expands on the three sources of measurement error listed above. We begin by reviewing the recent price dynamics of the "Computer Software and Accessories" category. Next, we explore the composition of this category, detailing how the individual components differ between the CPI and PCE indexes and how their respective weights might be determined. We then isolate the contribution of accessories to the observed price increases. Following this, we examine software price dynamics, highlighting the challenges introduced by changes in pricing and quality adjustment. We then provide a range of possible adjustments. We conclude by discussing the forward-looking implications of these measurement issues.
Price Dynamics of the "Computer Software and Accessories" Category
Figure 2 shows that the price index for the "Computer Software and Accessories" category of PCE has been falling over the past 25 years at an average annualized rate of –5.3 percent.6 However, starting in November of last year, the series displays an uptrend.
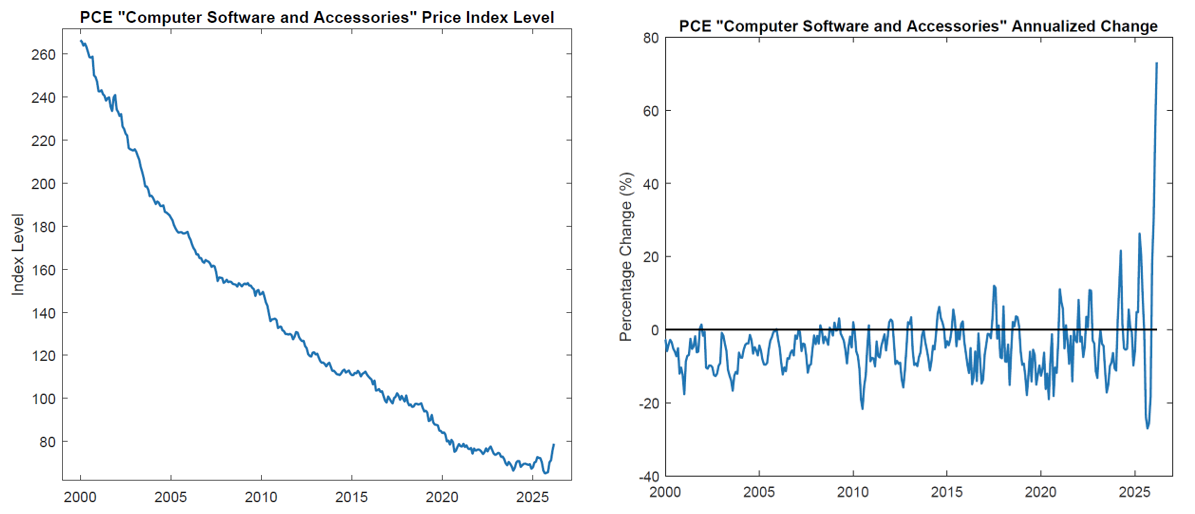
Note: The figure shows the PCE “Computer Software and Accessories” Price Index level in the left panel. The right panel shows the 4-month annualized change in the price index dating back to 2000. The 4-month annualized change is shown to be consistent with developments since November 2025.
Drivers of historical deflation in software prices. The decades-long downward trend is likely attributable to several factors. First, production and distribution costs plummeted as the industry transitioned from physical media to digital distribution and increased outsourcing to low-cost countries. Second, intensified competition from ad-supported, web-based alternatives has likely exerted downward pressure on margins and reduced the price of consumer software (relative to a market with less competition).
The matched-model approach. Mechanically, this downward trend in prices appears in the price index as follows: Under the standard matched-model approach, which aggregates the price trends for the items in a representative basket of software over time, discounting of the existing software versions captures the quality improvements introduced with new versions. This approach relies on market competition: the law of one (quality-adjusted) price ensures that the discount on old versions matches the value of the new features. That is, as versions with new features are introduced, the prices of older versions fall, incorporating an implicit quality adjustment into price indices. However, this implicit adjustment may no longer be as effective when AI improvements are introduced continuously and as pricing models switch to subscriptions with more frequent updates, as we discuss below.
The unprecedented recent surge in prices. Figure 2 (right panel) illustrates the annualized inflation rate for the "Computer Software and Accessories" category of the PCE price index. We calculate the annualized change over a trailing four-month window to capture the onset of the most recent inflationary surge. As depicted in the figure, the historical average annualized price change for this category has been approximately –5 percent since the late 90s.
In stark contrast to this historical trend, the most recent observation shows the category surging to a record 73 percent annualized increase from November 2025 through March 2026. This spike is nearly triple the previous peak in April 2025 and is responsible for the recent abnormal contribution to core PCE.
The Composition of "Computer Software and Accessories" in the CPI and the PCE Index
Although the granular microdata underlying the "Computer Software and Accessories" category are not publicly accessible, available methodological documentation provides valuable insight into its construction. As detailed in Table 5.A (Chapter 5) of the Bureau of Economic Analysis (BEA) National Income and Product Accounts (NIPA) Handbook:
- The price index for the PCE category is derived directly from the corresponding Bureau of Labor Statistics (BLS) Consumer Price Index (CPI) for "Computer Software and Accessories."7
This reliance on CPI source data is fairly standard methodological practice for constructing PCE price indices, but in this case it is particularly challenging for reasons that we discuss below.
"Computer Software and Accessories" Has Much Higher Weight in the PCE Price Index than in the CPI
"Computer Software and Accessories" accounted for 0.035 percent of the core CPI basket in March, 2026, markedly less than the 1.2 percent weight the category holds within the core PCE index.8 9 The reason for the difference stems from the different methodologies used by the BLS and BEA to attribute weights.
Expenditure vs supply-based weights. The BLS attributes weights to CPI categories using the Consumer Expenditure Survey, which collects information provided by consumers regarding expenditures on items that make up the CPI categories. In contrast to the BLS expenditure-based system, the BEA computes weights on a supply-basis, that is from shipments of products as declared by businesses in the Census. That said, the striking difference in weights raises concern that the items included in the CPI price index may not match the items included in the PCE category deflated by the index.10
The Mismatch of Categories Between PCE and CPI
PCE categories.11 Analysis of the 2017 PCE Bridge Table (the latest available) shows that the "Computer Software and Accessories" category consists of the products of two industries: (1) Software Publishers (NAICS industry 5112) and (2) a portion of Data Processing, Hosting, and Related Services (NAICS industry 5182).12
BLS categories.13 Analysis of appendix 2 of the CPI Handbook of Methods shows that the sole underlying entry-level item (ELI) for this CPI is "Computer Software and Blank Media" (EE021). The BLS definition indicates that this ELI encompasses not only traditional software (including mobile applications and videogames) but also media storage devices, such as flash drives and also blank DVDs and CDs (and possibly VHS). Of note, despite the category name, it excludes other hardware accessories like keyboards or webcams.
In other words, unlike the CPI category, the BEA category excludes blank media, such as Flash drives.14 Thus, disentangling the implications of the recent move in the CPI for PCE requires examination of two classes of products: software and memory products. We first present the available information on the relative importance of each product class within the CPI and PCE baskets, then we turn to the behavior of the price index for each.
CPI Product Weights
The weights for the sampling process of the entry level items in the CPI basket are derived from the Consumer Expenditure Survey (CEX), which was last conducted in 2024.15 Appendix 5 of the CPI Handbook of Methods provides a concordance between CE categories and the ELIs comprising the "Computer Software and Accessories" index.16 The three relevant CE categories are "Computer Software," "Portable Memory," and "Apps/Games/Ringtones For Devices." According to the 2024 survey, average annual household expenditures are $27.52 on software, $3.75 on portable memory, and $3.48 on device applications.17
As a result, we expect that software and applications will receive a larger weight than portable memory in the BLS sampling process. That said, there is considerable uncertainty regarding the relative weights of the two categories in the published index. In fact, the BLS collects price data regionally using local CEX weights for each city/region, and substantial heterogeneity may exist across areas. Small regional samples can thus disproportionately influence the national index. Given the lack of public information on the exact sampling scheme and implied weights for software versus blank media, we will infer these weights using a statistical model.
PCE Weights from the Economic Census
The product composition of PCE categories is constructed using entirely different sources and methods. The anchor for BEA in building the current PCE item weights is the 2017 Economic Census. Each U.S. business in the sample was asked, "what was the estimated percentage of this establishment's total sales by class of customer in 2017?" Respondents provided an answer for "household consumers and individuals" as well as 10 other categories. These shares, extrapolated using indicator data such as retail sales by industry, are used to allocate a portion of sales in quarterly GDP source data to PCE. These industry consumer sales are apportioned to PCE categories according to a bridge table as mentioned above.
As shown in table 1, these differences in sources, methods, and scope result in rather different baskets between CPI and PCE and markedly different weights. For PCE, 84 percent of the weight is on products provided by software publishers, 16 percent is on consumer services provided by the data processing, hosting, and related services industry, and 0 percent is on blank media (or any physical computing accessories).18
Table 1: Comparison of PCE, CPI, and Model Weights for Software Categories
| PCE Computer Software and Accessories | CPI Computer Software and Accessories | ||||
|---|---|---|---|---|---|
| PCE Bridge Components | % of Basket | Exp. Survey Components | % of Basket | Model Components | % of Basket |
| - Software publishers | 84% | - Software | 80% | - Software and Apps | 70% |
| - Data processing, hosting, and related services | 16% | - Apps | 9% | - Blank Media | 30% |
| - Portable Memory | 11% | ||||
| Percent of Core PCE | 1.20% | Percent of Core CPI: | 0.035% | ||
| Associated Price Index for PCE and CPI | |||||
| CPI Computer Software and Accessories Price Index | |||||
Note: This table shows the items that make up each category for the PCE and CPI Computer Software and Accessories. The source of the weights for the PCE is the PCE Bridge 2017 table provided by the Bureau of Economic Analysis. The CPI weights are from the Consumer Expenditure Survey conducted by the Bureau of Labor Statistics.
CPI Product Weights from the Estimation of a Statistical Model
An alternative approach for generating weights for the two categories in the CPI index consists of using available PPI price indexes for them and estimating weights for software and blank media according to how proxies correlate with the observed "Computer Software and Accessories" dynamics. We estimate a dynamic model that regresses the 4-month percent change in CPI "Computer Software and Accessories" on PPIs that represent "Storage Media" and "Software".19
The "Computer Storage Device" PPI appears to be the most proximate PPI that captures the concept of "Storage Media". There are various "Software" indices available and we experimented with several of them. 20 The model estimated on the full sample suggests weights of 87 percent on software and 13 percent on storage, close to the CEX proportions.21
When we restrict the sample to more recent data, the fit of the regression improves and the coefficient on software declines monotonically. In the more recent window from January 2024 to April 2026, the model suggests a 70 percent weight on software. A possible interpretation of the model's results is that blank media has become gradually more important in the "Computer Software and Accessories" aggregate relative to a few years ago given recent hefty price increases.22
The "Accessories" Contribution: Flash Drive and Blank Media Price Increases
The inclusion of flash drives and other blank media is likely a key contributor to the recent surge in the "Computer software and accessories" CPI. Global prices for Flash memory chips (found in Flash drives) have more than doubled over the past year (see left panel figure 3). Large increases in products related to semiconductors have also been recorded in the domestic PPIs. Figure 3 right panel shows that prices of circuit boards, printed circuit boards, and computer storage have posted hefty increases since 2025Q4. These price rises are in large part a byproduct of the data center investment boom: the massive data storage requirements for AI training are largely met by solid state drives (SSDs), which contain Flash memory. To quantify the pass-through of these component costs to consumer prices, we can examine the evolution of retail flash drives and blank media since November.
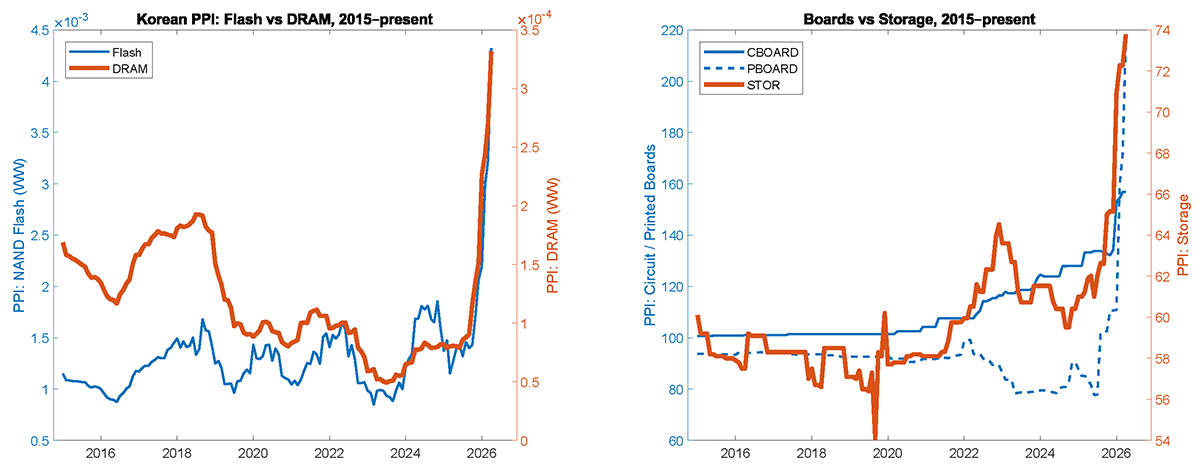
Note: We show the PPI for Flash and DRAM from Korea, where approximately 30 and 50 percent of capacity for Flash memory and DRAM production is located, according to Semiconductor Equipment and Materials International. Less than 5 percent of capacity for both memory types is in the United States. The right panel shows the PPI for Bare Printed Circuit Board Manufacturing (PCU334412334412), Printed Circuit Assembly Manufacturing (PCU3344183344189) and PPI Computer Storage Device Manufacturing (PCU334112334112). Data is from the Bureau of Labor Statistics and Bank of Korea.
Flash drive prices are up 69 percent. We conducted several searches on multiple e-commerce platforms. We found that the average price for the 20 best-selling flash drives increased about 70% since November 2025. We also noticed that there's little to no increase in the prices of these flash drives in the year prior to November 2025 and no evidence of seasonality.
Other blank media. Flash drives are not the only item listed in the "Computer Software and Accessories" category, as blank DVDs and CDs are also explicitly mentioned. Given that there's no available information on how much these items are contributing, we also consider the extent to which their prices have increased since November. Similar to the exercise we conducted with flash drives, we find that the top sellers for blank DVDs, CDs, and Blu-ray discs on average changed by -1 percent, 0 percent, and 10 percent, respectively. Given that it is not clear how much weight is placed on these items versus the flash memory, we assign equal weights to each and compute the average across the subcomponents. Under certain circumstances, using equal weights is broadly consistent with the details provided by the Calculation chapter in the CPI Handbook of Methods. We find that when included with the 69 percent increase in flash drives, the combined average across each subcomponent is about 19.5 percent or 70.6 percent annualized.
Contribution of "Accessories" to the rise in "software" prices. Recall that expenditure levels in the CEX survey imply that portable memory accounts for approximately 11 percent of the total sampling weight in CPI category. Assuming that is also the final effective weight on the category and applying the observed 70.6 percent price increase over the four-month window, portable memory would contribute roughly 7.8 percentage points to the 73.1 percent (annualized) aggregate increase in the "Computer Software and Accessories" CPI, or about one-tenth of the total observed increase. Alternatively, based on the weights from the model-based analysis, blank media contributes 21.1 percentage points to the 73.1 percent (annualized) aggregate increase, or about a quarter of the total increase. The remainder must be driven by underlying price increases within the core software component itself.
Software Price Increases and the Challenge of Capturing Quality and Pricing Changes
Whereas the recent increase in prices of blank media likely reflects the AI boom, the increased volatility and recent acceleration in the core software component is more uncertain. It may reflect a combination of structural market shifts and evolving business models, and disentangling genuine price increases from quantity and quality increases is not straightforward.23
Among the factors that lead to genuine price increases are operating costs for cloud-based consumer software, which appear to be rising relative to historical trends.24 This is likely driven by intense competition for data center capacity, as enterprise AI workloads crowd out traditional computing resources.
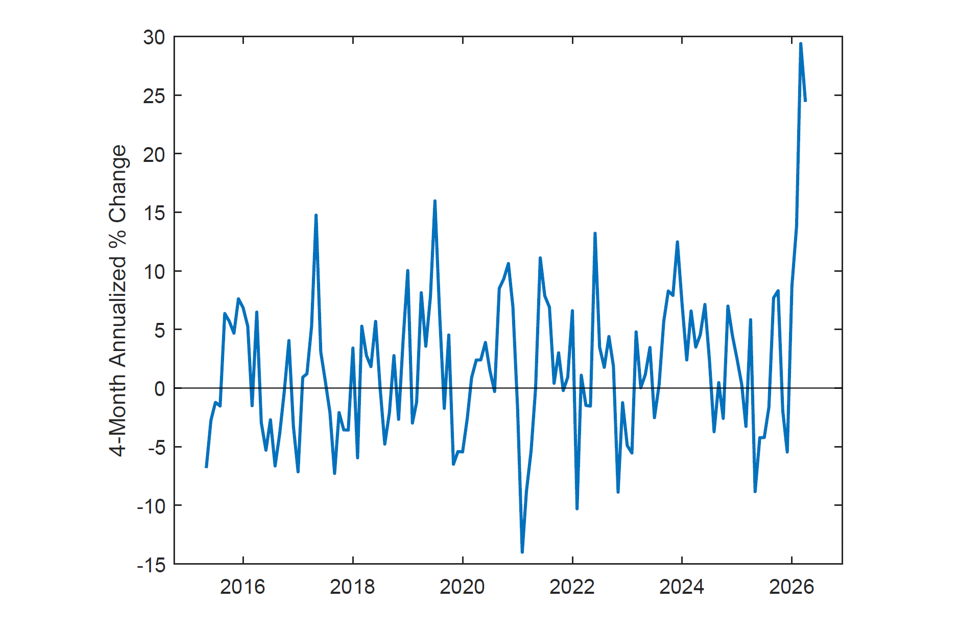
Note: The figure shows the 4-month annualized change for the Software PPI category: Software Publishers: Application Software Publishing (PCU51321051321050502) since 2015.
Standard CPI methods may increasingly struggle to account for quality and pricing changes in the software market. The standard BLS practice relies on a matched-model approach, which tracks monthly price changes for identical items over time and links in a substitute only when the original item is no longer available. Compounding the limitations of this approach is the explicit absence of hedonic quality adjustments for software within the CPI and, by extension, the PCE price index.25
Among factors that would require a careful quality adjustment review are improvements to software as a service (SaaS) models and AI-enhanced software. Regarding the former, SaaS models accelerate the pace of quality improvements through continuous updates, compared to the infrequent discrete upgrades characteristic of traditional perpetual licenses. These quality improvements may be missed by a matched-model approach. To the extent that a service transforms entirely from a perpetual license to SaaS pricing, the old models that the matched-model approach relies on simply disappear.
In addition, the integration of generative AI capabilities introduces significant complexities in how software is priced and measured. Many software providers offer AI-enhanced tools through fixed-cost subscriptions, absorbing the variable, compute-intensive marginal costs of underlying user queries. As consumer utilization of these AI features scales, firms may raise headline subscription prices to maintain profit margins and cover these variable compute costs. Under this dynamic, the observed price increase actually reflects higher total consumption of AI services. This effectively conflates an increase in utilization quantities with a pure price increase, resulting in a potential measurement error.
The combination of genuine price increases, quality improvements and changes in pricing strategies compound the measurement challenge we discuss below, as matched-model pricing will likely not adequately capture these more frequent incremental enhancements.
A Mismatch and Quality Adjustment Illustration
With the goal of offering a range of estimates for possible adjustments to the "Computer Software and Accessories" CPI index, we start by constructing a proxy for AI-related quality improvement. We also consider a category mismatch adjustment.
Performance based quality measurements. We first examine performance changes across a broad set of existing AI benchmarks. These benchmarks primarily measure accuracy and success rates (the percentage of problems solved correctly) rather than just processing speed or throughput. Specifically, we compare successive model generations from three major model families: GPT-5.1 to GPT-5.4, Claude Opus 4.5 to Claude Opus 4.6, and Gemini 3 Pro to Gemini 3.1 Pro.
These comparisons are intended to approximate the improvement in frontier AI capabilities between November 2025 and March 2026, our period of interest. Across the three model families, we obtain 117 benchmark-level estimates of model improvement spanning coding, agentic tasks, reasoning, math, legal, finance, medical, and aggregate performance benchmarks. We find an average improvement of 39.4 percent across these benchmark comparisons.26
Although some benchmarks involve tasks consumers may not directly perform (such as coding or advanced mathematics), these capabilities underpin common applications like spreadsheet formulas and writing assistance. We acknowledge that frontier AI benchmarks imperfectly proxy consumer software quality and likely reflect an upper bound on quality gains. To address this concern, we present below a partial pass-through scenario that assumes only a quarter of benchmark gains translate to consumer software quality.
Implications for the Contribution of the PCE "Computer Software and Accessories" Index to Core Inflation
We then use our two quality adjustments to derive implications for the contribution of "Computer Software and Accessories" price category to core PCE. Recall, the category rose by roughly 73.1 percent between November 2025 and March 2026. Within this category, we assume that software and apps account for roughly 70 percent while accessories account for the remaining 30 percent, based on our model estimates. The accessories component is proxied by blank media, whose price rose by about 70.6 percent (annualized) over the period based on the discussion above. This implies an accessories contribution of approximately 21.1 percentage points.
Partial quality-adjusted price calculation. Software and apps therefore account for the remaining annualized 52 percentage points of the category increase (73.1%−21.1%= 52 p.p.). Assuming a 70 percent software/apps share, this implies an unadjusted software/apps price increase of 74.3 percent (52%/0.70=74.3%). Adjusting this software/apps price increase for the partial pass-through of a quarter of the benchmark-implied quality improvement of 39.4 percent gives a quality-adjusted software/apps price change of approximately 31.45 percent ( (1+0.743)/(1+0.326)−1).
In Table 2 below, we show how much the sub-indices would change based on the category mismatch and the quality adjustment.
Table 2: Contributions to Core and Core Goods PCE Inflation for Mismatch, Quality, and Trend-adjusted Measures
| Measure (annualized 4-month percent change) | Unadjusted | Category mismatch adjusted | Category mismatch and quality-adjusted
25% pass-through |
Category mismatch and quality-adjusted
50% pass-through |
Trend-adjusted |
|---|---|---|---|---|---|
| Core PCE Inflation Rate | 4.38% | 4.22% | 3.96% | 3.73% | 3.65% |
| Core Goods PCE Inflation Rate | 5.47% | 4.81% | 3.68% | 2.73% | 2.39% |
| Computer Software & Accessories | 73.14% | 52.00% | 22.02% | 1.12% | -5.30% |
| Contribution to Core PCE, 1.2% weight | +0.66 pp | +0.50 pp | +0.24 pp | +0.01 pp | -0.07 pp |
| Contribution to Core Goods PCE, 5.1% weight | +2.80 pp | +2.14 pp | +1.01 pp | +0.06 pp | -0.28 pp |
Note: This table shows the effects of adjusting for the category mismatch, a category mismatch and a partial pass-through quality adjustment, and a trend adjusted version. All numbers are annualized four-month changes. Pass-through reflects improvements in AI to broader software quality improvements. The trend-adjusted assumes the software category followed its long-term trend since 2000.
The category mismatch adjustment—which we calculate is about 25 percent of the total contribution—would imply an annualized-change of 52 percent instead of 73.1 percent. The contribution to core Goods PCE based on the 5.1 percent weight would be 2.14 vs 2.80 percentage points. The contribution to core PCE would be 50 vs 66 basis points.
The partial passthrough quality adjustment would further reduce the contribution of the "Computer Software and Accessories" category to Core Goods and Core PCE inflation. Reaggregating software/apps and accessories back into the full category and subtracting off the contribution of the category mismatch gives 0.7×(31.45%) + 0.3×70.6% - 0.3 x 70.6% = 22.0%. Thus, the full Computer Software and Accessories category would move from a measured increase of 73.1 percent to a category mismatch- and quality-adjusted annualized increase of about 22.02 percent over the four-month period. A more aggressive assumption on passthrough (50 percent) is associated with a smaller increase of 1.12 percent. Table 2 shows the potential implications for the quality and category mismatch adjustment. The last column in the table reports the implied price path under the counterfactual of a decline at historical trend rates, described next.
Trend-based counterfactual. An upper bound to mismeasurement can be derived assuming that the "Computer Software and Accessories" CPI index would have continued to follow its historical trend. We fit a linear time trend to the log price series using data until the series appears to flatten out at the beginning of 2024. The trend fit is very precise, with an R-squared of 99 percent, and implies a decline over the sample at an annualized rate of -5.3 percent.
We have argued that part of the reason why the CPI index has increased lately is due to flash media—source of a mismatch measurement error—and another part may be due to quantity mismeasurement—due to pricing changes—or to quality adjustment. The counterfactual of the CPI index falling at trend eliminates all those sources of mismeasurement with the strong assumption that any or a combination of the mentioned sources of mismeasurement are entirely responsible for the recent increase. In other words, the strong assumption is that the index should have fallen at a rate of 5.3 percent at an annual rate instead of increasing 73.1 percent in the last four months in the absence of mismatch or pricing and quality adjustment.
Intriguingly, using trend adjustment implies core PCE would have increased at about the same rate as core PCE ex-"Computer Software and Accessories" in recent months, as can be seen in Table 2 and Figure 5.
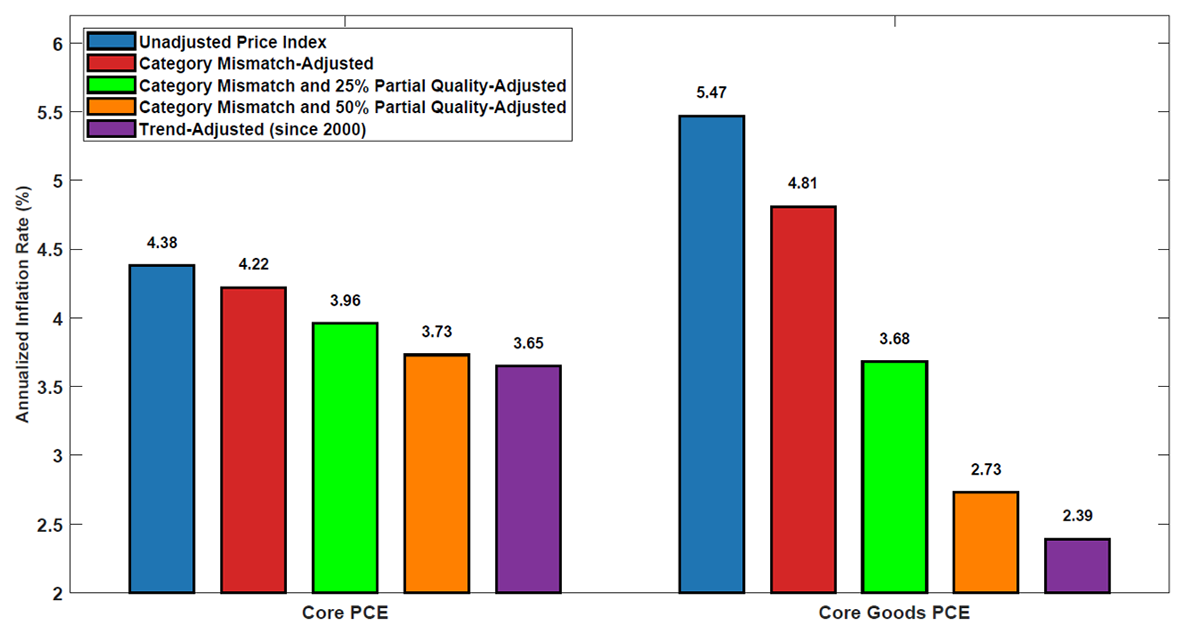
Note: The bars represent the March 2026 annualized 4-month inflation rate for Core and Core Goods PCE inflation (blue bars). The Red bars show what these measures would be with the category mismatch adjustment discussed in the text. A partial quality adjustment (25 percent) combined with the mismatch adjustment is also shown (green bars). A trend-adjusted version is also shown (purple bars). Pass-through reflects improvements in AI to broader software quality improvements. The trend-adjusted assumes the software category followed its long-term trend since 2000.
Summarizing mismatch and quality adjustments. Table 2 and Figure 5 summarize the incremental effects of the various adjustment exercises that we have conducted and illustrates the potential magnitude of the measurement issue. Mismatch adjustment implies that core PCE would have increased 4.22 percent in the last four months instead of 4.38 percent. While the current difference is not large, further increases in flash media prices driven by the AI-boom could exacerbate this source of bias.
With both category mismatch and partial quality adjustment, Core Goods PCE inflation would be 3.68 percent (annualized) compared to 5.47 percent without adjustment, a difference of over 1.75 percentage points. Core PCE inflation would similarly be nearly a half of a percentage point lower with both adjustments. More aggressive passthrough of AI improvements into broader software, or if the historical trend prevailed but were masked by pricing, quality and mismatch issues, would each indicate even greater adjustments to published PCE inflation.
Conclusion
In summary, the recent unprecedented surge in the "Computer Software and Accessories" category of the PCE price index seems to present a complex intersection of structural market shifts and statistical measurement challenges. While there are undoubtedly some genuine price increases occurring, there seems to be a mismatch between CPI and PCE baskets for the category.
Our calculations show that the mismatch explains a quarter of the abnormal contribution of the category to overall PCE over the last four months. At the same time, we suspect that the lack of explicit adjustment for quality and pricing changes for software presents a potentially notable source of measurement error. If that is the case and as AI capabilities induce improvements in software at a more rapid pace, the mismeasurement problem will become more acute.
In summary, our exercises suggest that a quarter to well over a half of the contribution of the "Computer Software and Accessories" category to core PCE inflation may be imputed to measurement error.
Going forward, if the rapid growth of the "Computer Software and Accessories" CPI index proves to be persistent, the potential sources of bias explored in this note may become even more relevant to policymakers and statistical agencies.
References
Abecasis, Manuel. (2026) "US Economics Analyst: AI and (Measured) Inflation: Up Then Down." Goldman Sachs Research.
Abel, Jaison R., Ernst R. Berndt, and Alan G. White. "Price Indexes for Microsoft." In Hard-to-Measure Goods and Services: Essays in Honor of Zvi Griliches, pp. 269-289. University of Chicago Press, 2007.
Asoni, Andrea, Chiara Farronato, Matteo Foschi, and Oliver Latham. "Contested Ground: Early Competition and Market Dynamics in Generative AI." Management and Business Review 5, no. 4 (2026): 54-63.
Bontadini, Filippo, Carol Corrado, Jonathan Haskel, and Cecilia Jona-Lasinio. "Is Software Eating the World? Measuring the Progress and Diffusion of AI (PDF)."
Boskin, M. J., Dulberger, E. R., Gordon, R. J., Griliches, Z., & Jorgenson, D. W. (1996). Toward a More Accurate Measure of the Cost of Living. Final Report to the Senate Finance Committee.
Byrne, D., Corrado, C., & Sichel, D. (2018). The Rise of Cloud Computing: Minding Your P's, Q's and K's (PDF).
Byrne, D. M., Oliner, S. D., & Sichel, D. E. (2017). How Fast are Semiconductor Prices Falling?. Review of Income and Wealth, 64, 679–702. https://doi.org/10.1111/roiw.12308
Clark, Todd E. "Do producer prices lead consumer prices?." Economic Review-Federal Reserve Bank of Kansas City 80 (1995): 25-25.
Cole, Rosanne, Y. C. Chen, Joan A. Barquin-Stolleman, Ellen Dulberger, Nurhan Helvacian, and James H. Hodge. "Quality-adjusted price indexes for computer processors and selected peripheral equipment." Survey of Current Business 66, no. 1 (1986): 41-50
Crane, Leland D., and Paul E. Soto. AI and Coder Employment: Compiling the Evidence. No. 2026-018. Board of Governors of the Federal Reserve System (US), 2026.
Copeland, Adam. "Seasonality, consumer heterogeneity and price indexes: the case of prepackaged software." Journal of Productivity Analysis 39, no. 1 (2013): 47-59.
Gerner, Thesia, George Janini, William Passero, Laura Paszkiewicz, and Mark Vendemia. "The CE and PCE: A Comparison," Monthly Labor Review September 2006
Gordon, R. (2006). The Boskin Commission Report: A Retrospective One Decade Later. NBER Working Paper Series, No. 12311.
Hausman, J. (2003). Sources of Bias and Solutions to Bias in the Consumer Price Index. Journal of Economic Perspectives, 17(1), 23–44.
O'Trakoun, John. "I Spy with My PPI … More High CPI?" Macro Minute. Federal Reserve Bank of Richmond, January 4, 2022.
Triplett, J. E. (2001). Should the Cost-of-living Index Provide the Conceptual Framework for a Consumer Price Index?. The Economic Journal, 111(472), 311–334. https://doi.org/10.1111/1468-0297.00633
White, Alan G., Jaison R. Abel, Ernst R. Berndt, and Cory Monroe. "Hedonic price indexes for personal computer operating systems and productivity suites." (2004).
Wimble, Matt. "Is Software Eating Economic Growth?." Available at SSRN 3026262 (2017).
1. The "Computer Software and Accessories" index can be found under the "Goods → Durable Goods → Recreational Goods and Vehicles → Video, Audio, Photographic, and Information Processing Equipment and Media → Information Processing Equipment" on line 50 of Table 2.4.4U Price Indexes for Personal Consumption Expenditures by Type of Product at the Bureau of Economic Analysis (BEA) website. Return to text
2. We refer frequently in this note to four-month annualized changes because that corresponds to the point in time at which software prices began notably accelerating; as time passes, updates to this analysis will appropriately use longer periods. Return to text
3. The BEA adopts the CPI index for "Computer Software and Accessories" as the price deflator for the PCE "Computer Software and Accessories" expenditure category. In the April CPI report, this index has continued its climb at a rate similar to its post-November trend. As a result, we expect that the contributions of this index to core PCE inflation will be largely unrevised in April. Return to text
4. The PCE index is a chain-weighted Fisher index, so contributions cannot be computed by simply multiplying weights and percent price changes. Instead, contributions require the Tornqvist approximation: $$[(w_t + w_{t-1})/2] × ln(P_t/P_{t-1})$$, which uses averaged expenditure shares from both periods applied to log price changes. This produces a contribution of 2.8 percentage points (the same as taking the difference of the index with and without software), compared to 3.7 percentage points from simple multiplication of $$w_t$$ × percent change. Return to text
5. The contribution of "Computer Software and Accessories" over 12 months is 0.5 percentage point for core goods PCE and 0.1 percentage point for core PCE, both roughly four standard deviations from their historical means. These more modest magnitudes reflect averaging over a period that includes months when software prices were continuing their historical downward trend. In contrast, the four-month window isolates the recent surge. Return to text
6. Notably, the fit of a linear trend to the log-series in the sample 1998 through 2023 has an R-squared of 0.99 percent. As a consequence, the series in levels displays a decline very close to a negative exponential through 2023 before it flattens out and subsequently starts its climb. The fit deteriorates if the sample is extended to 2026. Return to text
7. The BEA sometimes quality adjusts BLS price indexes but this is not the case for this category. See page 5-12 at https://www.bea.gov/resources/methodologies/nipa-handbook/pdf/chapter-05.pdf. Also, as indicated below, the original CPI index for "Computer Software and Accessories" is not explicitly quality adjusted. Return to text
8. The value 0.035 percent is calculated based on the reported weight of 0.028% and the weight of 79.907% for Core Goods and Services, i.e., 0.035% = 0.028% * 100 / 79.907. Return to text
9. Abecasis (2026) has noted that the PCE weight on software may be overstated because the Economic Census asks businesses how much software they sell to individuals, which could inadvertently include software that households primarily use for work, whereas the CPI weights based on the Consumer Expenditure survey explicitly ask households to exclude business-related purchases (see Gerner et. al (2006)). However, it is unclear how large of an issue this is in practice. Moreover, the Consumer Expenditure survey relies on respondent recall of spending, which introduces its own measurement challenges and may lead to underreporting of certain categories. Return to text
10. Because BLS does not provide a seasonally adjusted version of this CPI, we focus on the non-seasonally-adjusted version in this note. We find that applying a standard seasonal adjustment to the underlying data has a limited impact, indicating this may not be important at this time. That said, residual seasonality may still affect the index. Return to text
11. The PCE bridge tables are available on the BEA Interactive Data website. We verified that the commodities that are contained in the "Computer Software and Accessories" category do not contain any mention of blank media or other computing accessories. Moreover, for the year 2017—the last available Census year—the purchasers' value of the commodities included in the "Computer Software and Accessories" category matches the PCE expenditure in the overall "Computer Software and Accessories" category for that year. Return to text
12. Software publishers design, distribute, document, install, and service software. Businesses in the data processing, hosting, and related services industry provide such services as web page and application hosting, streaming services, and cloud computing. Streaming services are a distinct PCE category receiving the other portion of the consumption weight from this industry. Return to text
13. Appendix 2: Content of CPI entry level items https://www.bls.gov/cpi/additional-resources/entry-level-item-descriptions.htm. Subscription and rental of video games, which are found in another CPI category, are not included in "computer software and accessories." Return to text
14. The CPI structure contains a separate category for "subscription and rental of video games." Whether such services are in the PCE software category is not public information, but there is no distinct category for games, suggesting that part of the additional weight "computer software and accessories" may be due to the inclusion of such gaming services. Return to text
15. CPI item weights were adjusted to match the 2024 Consumer Expenditure Survey in January, 2026. Previously, the weights were based on the 2023 survey. In the 2023 survey, software expenditure was a somewhat higher share of software and accessories (84.0% vs. 79.2%) and applications and portable memory had slightly lower shares (9.2% vs. 10.0% and 6.8% vs. 10.8%, respectively). Return to text
16. See Appendix 5 at https://www.bls.gov/cpi/additional-resources/ce-cpi-concordance.htm. Return to text
17. See https://www.bls.gov/cex/tables/calendar-year/mean/cu-all-detail-2024.xlsx. Return to text
18. In 2017, Software Publishers accounted for $79.659 billion and Data Processing, Hosting, and Related Services accounted for $15.033 billion, totaling $94.692 billion and equaling the total personal consumption expenditures for this category on line 50 of Table 2.4.5U. Return to text
19. The model is estimated on non-overlapping 4 month periods. In order not to dilute the weak signal from the PPIs only the one lag for each PPI with larger weights from the cross-correlogram is included. Return to text
20. Among atoms that represent "Software" there are many options at different levels of detail. Given the apparently broad definition of "Software" in the CPI index, we adopted the "Primary Software Publishers" PPI index for the estimates reported in the text. However, we have no strong prior on which PPI is the most appropriate. In theory, PPI indices should lead the "corresponding" CPI. However, the niche literature that has investigated the relationship between PPIs and corresponding CPIs has found less than clearcut if not ambiguous results. Given the weak signal from PPIs to CPIs, we focus on a very parsimonious parametrization selecting only the lag with most explanatory power for each PPI. We constrain the model to have non-negative weights that sum to unity since we are looking for a reduced form split between the two categories. Data are available starting from the late 1990s through 2026m4. As noted earlier, the CPI index for "Computer Software and Accessories" has flattened in early 2024 possibly signaling a new regime. Therefore, that date is used for the reported sub-sample analysis. Return to text
21. Results using other PPIs produce a range of the software coefficient as low as 70%. The model has a poor fit with R-squared of just 1 percent in the whole sample. Likely, part of the reason for a poor fit in the whole sample is the mentioned weak relationship between PPIs and CPIs, a feature well documented in the classic study by Clark (1995) and more recently by O'Trakoun (2022). Moreover, forcing the model to have weights that sum to unity also contributes to a deterioration of the fit. Of note, the R-squared of the regression improves quite substantially to 35 percent when limited to the "new regime" period. We are not wed to any given specification of our model and do not take it too literally. Rather, we summarize the evidence by noting that a broad range of specifications suggests that most of weight is on software but that nevertheless media has a relevant role in the CPI aggregate and increasingly so given the recent rise in the aggregate CPI index. This is consistent with the visual evidence in Figure 3 regarding the widespread rise in electronics components prices. Return to text
22. Although the software PPIs have also risen in recent months, the ensemble of software PPIs suggests some deceleration going into April. As a consequence, a possible inference is that the rise may be due to seasonal variation in pricing. This inference is consistent with pricing patterns in 2023 and 2024. In contrast, the rise in blank media prices has a pronounced concave accelerating pattern and to the extent that it is related to the recent AI boom it may be projected to last longer, possibly as long as the AI generated demand for components (given that supply is relatively inelastic). Return to text
23. Residual seasonality may also affect the within year patterns of prices. Return to text
24. The producer price index for data processing, hosting, and related services has risen at an annual rate of 1.9 percent, on average, in the post-COVID-19 period, 1 percentage point higher than its pre-pandemic pace. Return to text
25. For a list of quality adjustment methodologies for each component of CPI, see https://www.bls.gov/cpi/quality-adjustment/. According to the site, the ELI EE021 for "Computer software and blank media" shows no quality adjustment. Return to text
26. GPT models show the largest average improvement, with GPT-5.4 improving 56.5% relative to GPT-5.1 across the relevant benchmarks. Claude Opus 4.6 improves by 38.3% on average over Opus 4.5, while Gemini 3.1 Pro improves by 25.3% over Gemini 3 Pro. Taken together, the benchmark evidence suggests that frontier AI capabilities improved substantially between November 2025 and March 2026. Return to text
Barbarino, Alessandro, Anthony M. Diercks, and Stephen Miran (2026). "Measurement of “Computer Software and Accessories” Inflation," FEDS Notes. Washington: Board of Governors of the Federal Reserve System, May 22, 2026, https://doi.org/10.17016/2380-7172.4089.
Disclaimer: FEDS Notes are articles in which Board staff offer their own views and present analysis on a range of topics in economics and finance. These articles are shorter and less technically oriented than FEDS Working Papers and IFDP papers.