FEDS Notes
August 29, 2025
Measuring Geopolitical Risk Exposure Across Industries: A Firm-Centered Approach1
Isabel Culver, Friederike Niepmann, and Leslie Sheng Shen
Business sentiment shapes real outcomes. Firms respond not only to hard data but also act on how they perceive risks and uncertainty. A growing literature shows that shifts in business sentiment can meaningfully affect investment, employment, and firm performance, even when fundamentals are unchanged (Bloom 2009; Gennaioli, Shleifer, and Vishny 2015; Hassan et al. 2019; Altig et al. 2020).
One area where firm perceptions can add valuable insight is in assessing corporate exposure to geopolitical risk (GPR). Geopolitical events are episodic, difficult to quantify, and affect industries in heterogeneous ways. Their economic consequences have become increasingly salient in recent years, as wars, trade tensions, and sanctions disrupt supply chains, shift market expectations, and alter corporate strategy. These forces are contributing to broader patterns of economic and financial fragmentation, forcing firms to adapt to a more divided global economy.
Existing work often relies on market-based measures to infer exposure derived from asset-price responses around geopolitical events. This approach captures the perceptions of market participants rather than those of firms themselves. Yet it is firm decision-makers who ultimately drive operational and strategic responses to risk.
In this note, we provide a new measure of geopolitical risk exposure that is directly grounded in firm perspectives. Using natural language processing on more than 240,000 earnings call transcripts from 2002 to 2024, we construct a sentiment-based index of geopolitical risk at the industry level. This index captures both the frequency and tone of discussion, allowing us to distinguish between perceived threats and opportunities across industries. We show that industries exhibiting more negative geopolitical sentiment experience larger stock price declines during GPR shocks, indicating that our firm-driven index captures economically meaningful variation in exposure. At the same time, its correlation with market-based measures is imperfect, underscoring the distinct information embedded in firm perceptions. We encourage researchers to employ both sentiment measures in their future research; each provides insight into different facets of geopolitical risk.
The GPR Sentiment Index
Construction
To measure how industries perceive geopolitical risk, we construct an industry-specific geopolitical risk sentiment index grounded in firm communications through earnings calls. Building on Niepmann and Shen (2025) and Shen (2025), we use the NL Analytics platform—a commercial implementation of the natural language processing methodology developed by Hassan et al. (2019)—to process over 240,000 earnings call transcripts from approximately 7,000 U.S.-domiciled firms, spanning the period 2002:Q1 to 2024:Q3. This platform enables us to apply our own natural language process-based criteria within its framework. We use the geopolitical risk dictionary from Caldara and Iacoviello (2022) and identify GPR-relevant sentences, classifying them as negative or positive based on their proximity to sentiment words from the Loughran and McDonald (2011) dictionary. By quantifying both positive and negative sentiment, we can distinguish between instances in which geopolitical developments are viewed as risks versus opportunities—a nuance that pure mention-count methods cannot capture.
For each firm, we compute a sentiment score as the difference between the number of positive and negative GPR-related sentences $$(Pos_{fit}-Neg_{fit})$$, normalized by the transcript length $$(\text{#Sentences}_{fit})$$. Aggregating these firm $$(f)$$-level scores to the industry level, we generate a quarterly $$(t)$$ sentiment index across 43 industry groups $$(i)$$ as:2
$$$$Sentiment_{it}=\frac{1}{F_{it}}\Sigma_{f}{\frac{Pos_{fit}-Neg_{fit}}{\text{#Sentences}_{fit}},}\ (1)$$$$
where $$F_{it}$$ is the number of firms in industry $$i$$ at time $$t$$. To isolate industry-specific sentiment, we subtract the average sentiment across all industries ($$\overline{Sentiment_t}$$) in each quarter. This yields a time-varying, industry-specific measure:
$$$$ IndustrySentiment_{it}=Sentiment_{it}-\overline{Sentiment_t.}\ (2)$$$$
We also compute a time-invariant measure by averaging over the sample period to capture each industry's overall exposure to GPR:3
$$$$ IndustrySentiment_i=100\ast\frac{1}{T}\Sigma_{t}{IndustrySentiment_{it}.}\ (3)$$$$
Heterogeneity in Sentiment Across Industries
Figure 1 illustrates our time-varying GPR sentiment index. The left panel shows the aggregate index $$(\overline{Sentiment_t})$$ capturing average sentiment across all industries, with higher values representing more positive sentiment. Aggregate net sentiment declines around major geopolitical events such as the start of the Iraq War (2003:Q1), Russia's invasion of Ukraine (2022:Q1), and the Hamas attack on Israel in 2023:Q4. While negative sentiment (red line) dominates, positive sentiment (blue line) is negatively correlated with negative sentiment, highlighting that some firms may view opportunities amid geopolitical upheaval.
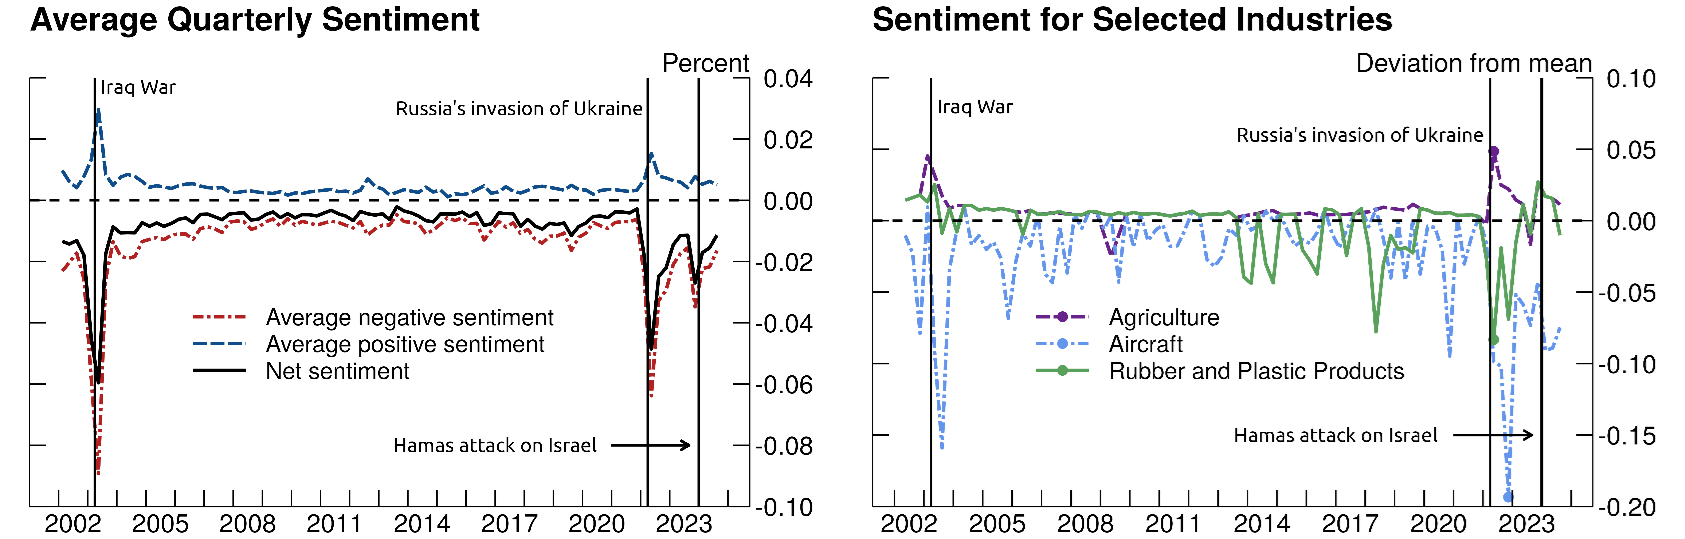
Notes: For the right panel, data extend through 2024:Q2. Values are expressed as a percent of total word count for all earnings transcripts. For the left panel, data extend through 2024:Q2. Values for each industry are expressed as the deviation from average sentiment across all industries in each quarter, multiplied by 100 for readability.
Sources: Authors' calculations.
Underlying the aggregate index, there is significant variation in sentiment across industries. The right panel of Figure 1 plots the industry-level index ($$IndustrySentiment_{it}$$ from Equation 2) for three selected industries: Agriculture, Aircraft, and Rubber and Plastic Products. The Aircraft and Rubber and Plastic Products industries exhibit strongly negative sentiment following the outbreak of the Russia-Ukraine war in February 2022, likely reflecting disrupted supply chains and weakened European demand. In contrast, the Agriculture industry exhibits positive sentiment around the same period, probably because of reduced foreign competition, as the war curtailed Ukrainian agricultural production and distribution and thanks to the more localized nature of U.S. agricultural supply chains for perishable goods, which are less exposed to international disruptions.4
Figure 2 shows the time-invariant GPR sentiment measure ($$IndustrySentiment_i$$ from Equation 3), capturing each industry's average perceived exposure to geopolitical risk over the full sample period. The measure reveals substantial variations across industries. Those more reliant on global supply chains or foreign demand—such as Fabricated Products and Electronic Equipment—tend to exhibit persistently negative sentiment. In contrast, industries such as Agriculture and Pharmaceutical Products often express more positive sentiment. These sectors may either be relatively insulated from geopolitical turmoil or even stand to benefit from it, for example, through increased demand for food exports or medical supplies during times of conflict.
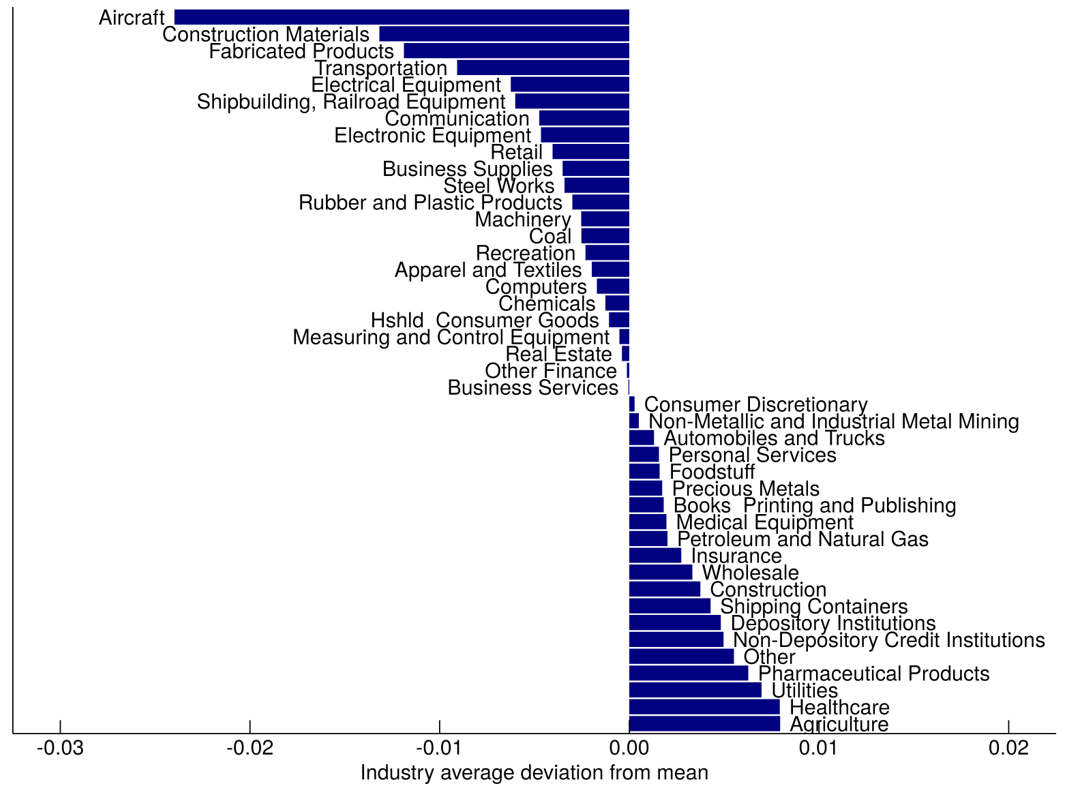
Notes: The chart shows the deviations from average sentiment for 43 industries, multiplied by 100 for readability.
Sources: Authors' calculations.
Sentiment and Stock Price Responses to GPR Shocks
Using sentiment to explain market reactions to GPR shocks
Having constructed a firm-based measure of industry-level GPR sentiment from earnings calls, we examine whether this sentiment helps explain how stock prices respond to geopolitical shocks. Since firms use earnings calls to communicate risks to investors, the tone and frequency of GPR-related discussions should reflect management's perceived exposure to such events.
To test this, we combine our time-invariant industry-level sentiment index with stock return data from CRSP and the Caldara and Iacoviello (2022) daily GPR index. The Caldara-Iacoviello index measures geopolitical risk based on the share of articles from ten widely circulated U.S. and U.K newspapers that pertain to geopolitical threats or actions. It is available at daily frequency, whereas our sentiment index is quarterly, based on the timing of earnings calls. Because of this difference in frequency, we do not attempt to match daily returns to quarterly sentiment changes. Instead, we ask whether industries that tend to express more concern about geopolitical risk—those with more negative average sentiment—exhibit stronger negative reactions of their stock prices to GPR shocks identified from the Caldara-Iacoviello index.
To do so, we collect daily stock returns for the same set of U.S.-domiciled firms used to build the sentiment index, ensuring consistency in coverage. Additionally, we use the same SIC classifications to group firms into 43 industries and compute the weighted average of firms' stock returns for each industry each day.
Instead of working with daily stock prices directly, we compute daily excess returns by subtracting the expected return—based off of the typical relationship between the industry and the broad market (S&P500)—from the observed return:
$$$$ ExcessReturn_{it}=Return_{it}-\widehat{Return_{it}}\ (4)$$$$
where $$ \ \widehat{Return_{it}}=\widehat{\alpha_{it}}\ +\widehat{\beta_{it}\ }SP500Return_t.$$
For our analysis, we focus on days when the Caldara-Iacoviello index spikes. This is because the relationship between stock prices and the GPR index is typically weak during normal times but becomes pronounced during major shocks. We define a GPR spike as any day in which the daily log-change in the Caldara-Iacoviello GPR index is at or above the 99th percentile of its distribution. Figure 3 plots the daily log change in the index. We identify 63 spike days, which are indicated with a dot and coincide with significant geopolitical risk events.
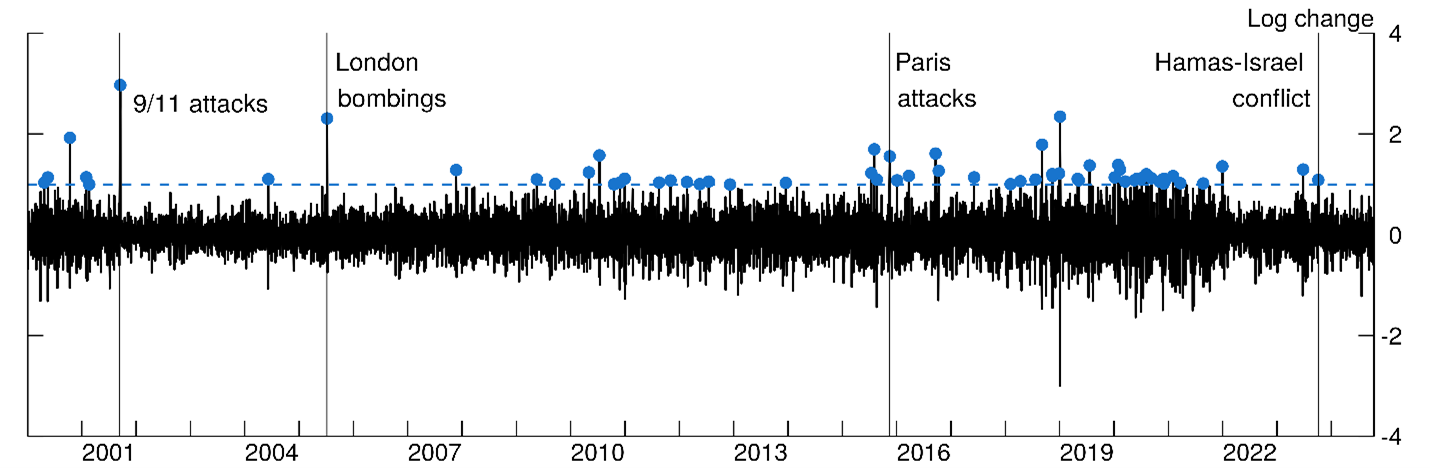
Notes: Data extend through October 15, 2024.
Sources: Caldara and Iacoviello (2022); Authors' calculations.
To investigate whether GPR sentiment helps explain stock price responses to GPR shocks, we estimate the following equation:
$$$$ ExcessReturn_{it}=\beta_0+\beta_1\Delta LogGPR_t+\beta_2IndustrySentiment_i+\beta_3\Delta LogGPR_t\times\ IndustrySentiment_i+\epsilon_{it}\ (5) $$$$
where excess returns on spike days are regressed on the corresponding daily log GPR changes, the average time-invariant industry sentiment level, and the interaction between the two. The coefficient on the interaction term $$\beta_3$$ is of main interest: It captures the extent to which the stock market reaction of industries to overall GPR sentiment varies with industry specific sentiment.
Table 1 presents the regression results. The coefficient on the interaction term $$\beta_3$$ is positive and statistically significant at the 5 percent level, indicating that industries with more negative sentiment tend to experience lower excess returns in response to GPR shocks. More concretely, our results imply that on the average spike day—when the GPR index increases by approximately 1.24 percentage points—the median-sentiment industry sees returns that are 0.15 percentage points lower than the S&P 500, which itself declines by an average of 0.3 percentage points. Firms in industries at the 10th percentile of sentiment experience excess returns 0.7 percentage points lower than those in the median industry, while firms in the 90th percentile experience returns 0.5 percentage points higher.
Table 1: Explaining Excess Stock Returns in Response to GPR Shocks with Industry-Level GPR Sentiment
| Dependent variable: excess return | (1) |
|---|---|
| $$\Delta$$log(GPR) | -0.0009 |
| (0.0013) | |
| Industry Sentiment | -86.76** |
| (39.57) | |
| $$\Delta$$log(GPR) x Industry Sentiment | 65.78** |
| (32.23) | |
| Observations | 2378 |
| $$R^2$$ | 0.010 |
Note: This table shows results of a regression of industry-level excess stock returns on GPR spike days on the log change in GPR interacted with the time-invariant industry-level GPR sentiment index. The constant is not displayed.
These findings validate the economic relevance of our firm-driven index: It reflects underlying vulnerabilities that manifest during periods of heightened geopolitical risk.
Comparing firms' and market's risk perceptions
While our sentiment index captures how firms perceive and discuss geopolitical risk, the common existing approach infers industry exposures to GPR from stock price responses to geopolitical events, which summarize market participants' reactions and sentiment. To explore how these two perspectives relate, we estimate market-based exposure for each industry as an industry's stock price sensitivity to GRP shocks and compare it to our firm-driven measure.
Specifically, we regress excess returns industry-by-industry on GPR shocks defined, as before, as log changes in the Caldara-Iacoviello GPR index on spike days:
$$$$ExcessReturns_t^i=\beta_0+\beta_1^i\Delta LogGPR_t+\epsilon_{it.}\ (6)$$$$
Figure 4 presents the estimated values of $$\beta_1$$ across industries. Consistent with prior literature (Caldara and Iacoviello 2022), industries such as Aircraft, Transportation, Real Estate, and Fabricated Products show strong negative responses to GPR shocks.
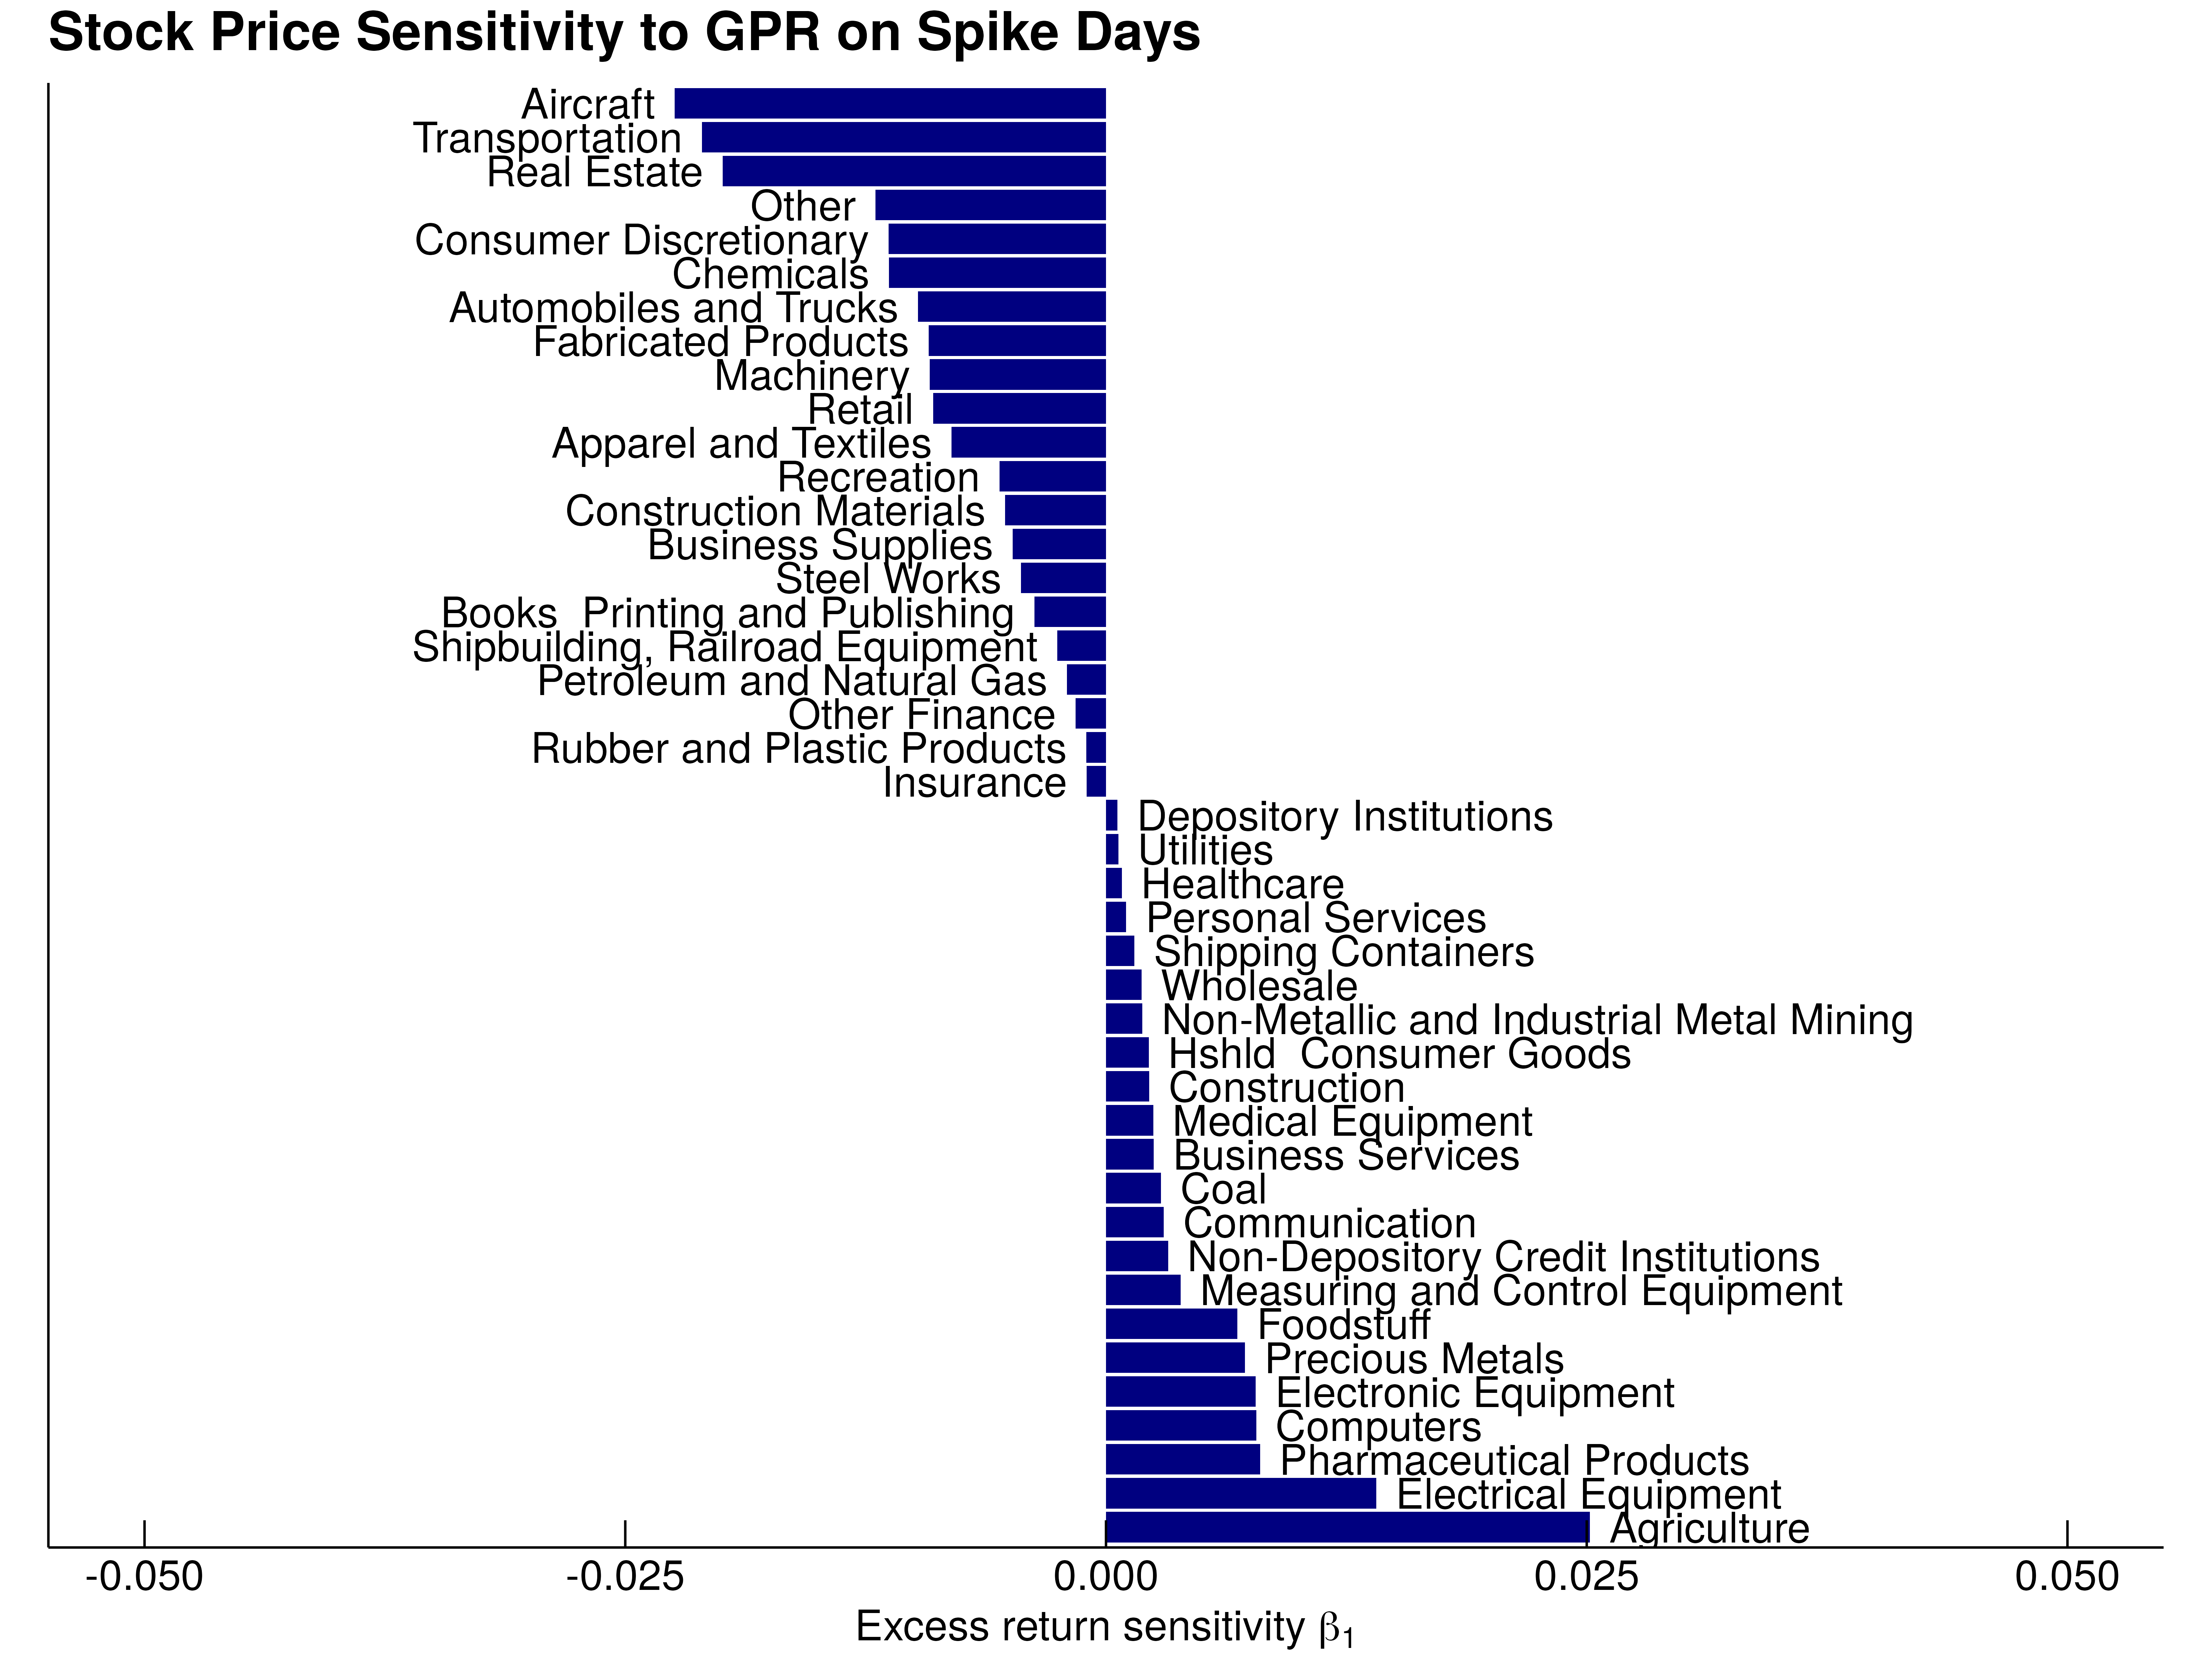
Sources: Caldara and Iacoviello (2022); Center for Research in Security Prices; Authors' calculations.
Figure 5 plots $$\beta_1$$ against our time-invariant industry-level GPR sentiment index. While there is a clear positive relationship—industries with more negative firm sentiment tend to exhibit more negative market responses—the relationship is not a particularly strong one. The correlation coefficient between the two measures is 48 percent. The $$R^2$$ of a simple regression of GPR sentiment on the market-based exposure measure is a moderate 0.23. Industries such as Consumer Discretionary, Real Estate, Automobiles and Trucks, and Other exhibit the largest gap between the two measures.5
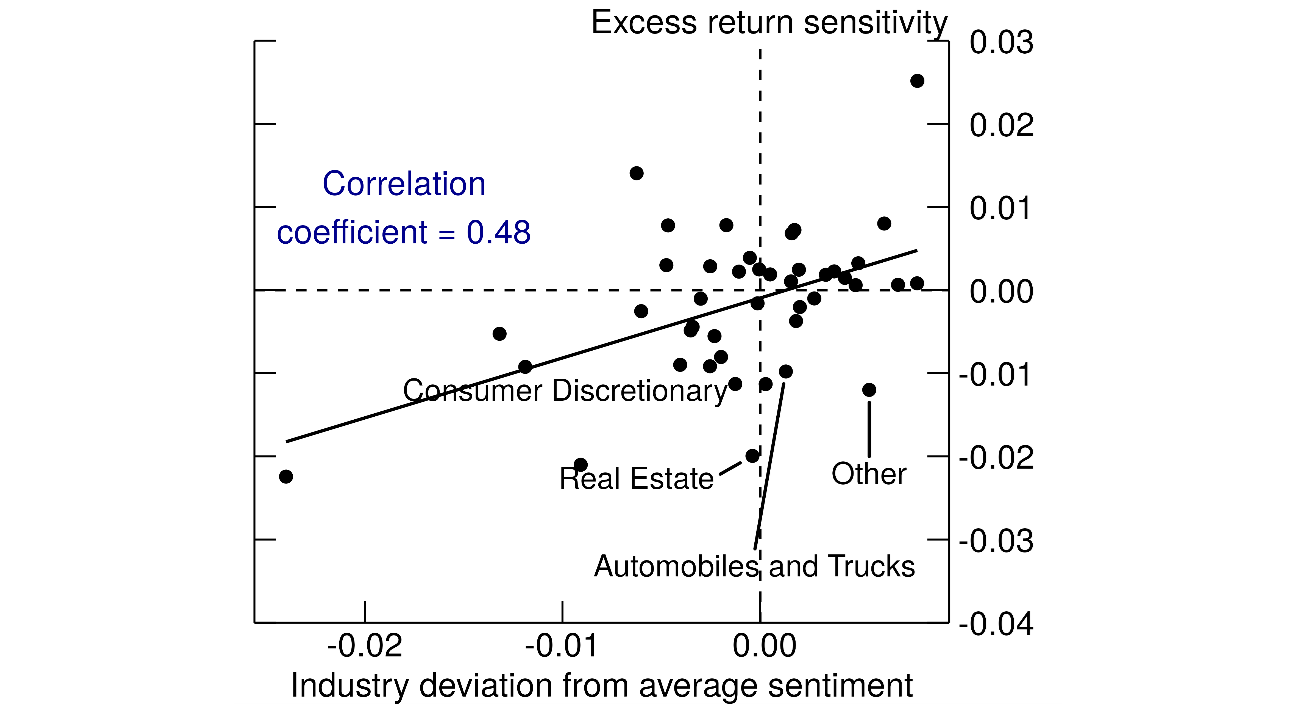
Notes: The four labelled industries are those that are most dissimilar when the two exposure measures are normalized and compared.
Sources: Authors' calculations.
These differences reinforce the point that firm and investor perceptions of geopolitical risk, while related, are not the same. Our index captures how managers publicly assess and communicate risks during earnings calls. These discussions may reflect a combination of operational exposure, strategic concern, and realized impact—and often occur with a lag, constrained by disclosure norms and the timing of earnings releases. By contrast, investor responses—reflected in stock prices—occur in real time and may be more sensitive to sentiment swings, news coverage, or herd behavior. For example, investors may rapidly price in heightened risk even when firms have not yet revised their earnings outlooks. Also, stocks prices sometimes overreact and at least partially revert soon after. Conversely, firms may discuss GPR in earnings calls because of operational disruptions or planning concerns, even when the market reaction is muted. This helps explain why some industries appear more sensitive in one measure than others.
Together, these measures offer complementary insights. Investor-based metrics capture the market's immediate reaction; firm-based sentiment reflects more durable, operationally grounded assessments. The latter may reveal longer-lasting imprints of geopolitical risk on industries as firms discuss their strategic responses to geopolitical risks in their earnings calls over time, for example, nearshoring, friendshoring or diversification of supply chains. By combining both perspectives, researchers and policymakers can gain a more nuanced view of how geopolitical events propagate across industries and through the economy.
References
Altig et al., "Economic Uncertainty Before and During the COVID-19 Pandemic," Journal of Public Economics 191 (November 2020): 104274.
Bloom, Nicholas. "The Impact of Uncertainty Shocks," Econometrica 77, no. 3 (May 2009): 623-685.
Caldara, Dario and Matteo Iacoviello, "Measuring Geopolitical Risk," American Economic Review 112 no. 4 (April 2022): 1194-1225.
Chen et al., "The Russia-Ukraine War Reduced Food Production and Exports with a Disparate Geographical Impact Worldwide, Nature: Communications Earth & Environment 5 (2024).
Ciais et al., "The Impact of Russia-Ukraine Conflict on Global Food Security," Global Food Security 36 (March 2023), https://www.sciencedirect.com/science/article/abs/pii/S2211912422000517.
Fama, Eugene and Kenneth French, "Detail for 48 Industry Portfolios," Accessed June 9, 2025.
Gennaioli, Nicola, Andrei Shleifer, and Robert Vishny, "Neglected Risks: The Psychology of Financial Crises." American Economic Review 105 no. 5 (2015): 310–14.
Hassan, Tarek A, Stephan Hollander, Laurence van Lent, Ahmed Tahoun, "Firm-Level Political Risk: Measurement and Effects," The Quarterly Journal of Economics 134, no.4 (November 2019): 2135–2202.
Loughran Tim, McDonald Bill, "When Is a Liability Not a Liability? Textual Analysis, Dictionaries, and 10-Ks," Journal of Finance, 66 (2011), 35–65.
Niepmann, Friederike and Shen, Leslie Sheng, "Geopolitical Risk and Global Banking," Working Paper (2025). Available at SSRN: http://dx.doi.org/10.2139/ssrn.5200724.
Shen, Leslie Sheng. 2025. "How Firms' Perceptions of Geopolitical Risk Affect Investment." Federal Reserve Bank of Boston Current Policy Perspectives 25-3.
1. The analysis and conclusions set forth are those of the authors and do not indicate concurrence by other members of the research staff or the Board of Governors. Return to text
2. Our industry classification is based on modified Fama-French SIC codes. We consolidate related industries that are likely to respond similarly to risk. For example, Food Products, Candy & Soda, Beer & Liquor, and Smoke/Tobacco Products are grouped under the category "Foodstuff.", Entertainment and Restaurants, Hotels, and Motels are consolidated into "Consumer Discretionary." Apparel and Textiles are combined into a single category "Apparel and Textiles." Additionally, we disaggregate the finance industry to better capture variation within the sector. The Defense industry is one of the sectors but is dropped. Since the core business model of firms in the Defense industry revolves around war, conflict, and deterrence, terms pertaining to geopolitical risk appear frequently in their earnings call transcripts regardless of the actual state of the world. Return to text
3. We multiply by 100 in Equation (3) for readability. Return to text
4. While Russia and Ukraine accounted for more than a quarter of global wheat exports (Ciais et al. 2023) prior to the Russia-Ukraine war, the conflict severely constrained the agricultural output of both countries by damaging infrastructure, limiting labor, and disrupting harvests. As a result, U.S. wheat producers expanded production to fill the resulting market gaps (Chen et al. 2024). Return to text
5. To compare the indexes, we scale both such that they range from 0 to 1. Then, we take the absolute value of the difference between sentiment and $$\beta$$. Return to text
Culver, Isabel, Friederike Niepmann, and Leslie Shen Sheng (2025). "Measuring Geopolitical Risk Exposure Across Industries: A Firm-Centered Approach," FEDS Notes. Washington: Board of Governors of the Federal Reserve System, August 29, 2025, https://doi.org/10.17016/2380-7172.3882.
Disclaimer: FEDS Notes are articles in which Board staff offer their own views and present analysis on a range of topics in economics and finance. These articles are shorter and less technically oriented than FEDS Working Papers and IFDP papers.