FEDS Notes
May 08, 2026
Measuring Mutual Fund Liquidity with N-PORT
Erik Larsson, Ty Kawamura, and Chaehee Shin1
1. Introduction
Open-end mutual funds play a critical role in financial markets and remain major holders of key securities including corporate, Treasury, and municipal bonds. Past stress episodes have exposed the fragility of liquidity provision by corporate bond mutual funds, which can experience large investor outflows that must be met on demand despite holding relatively illiquid assets. Funds actively manage cash and other short-term instruments to meet redemptions, making these liquidity buffers serve as the first line of defense against potential shocks. Because the buffers also help prevent fire sales that could depress prices of key securities, monitoring the size and composition of these buffers is central to understanding potential vulnerabilities to financial stability.2
Despite the important role of liquidity buffers, there is no readily available, comprehensive metric of liquidity buffers that can be used to systematically capture the full range of cash and other short-term liquid assets used by corporate bond mutual funds. In this note, we use the Securities and Exchange Commission's (SEC) relatively new Form N-PORT—introduced following the discontinuation of prior forms and providing more granular classifications of holdings—to define Short-Term Liquid Assets Ratio (SLAR) of (long-term) corporate bond mutual funds. While Form N-PORT offers rich information, key elements including the fund type and liquidity classification of individual holdings are not publicly disclosed and make it challenging to measure mutual fund liquidity. We develop a new data-informed methodology that flexibly resolves these limitations. We find that N-PORT is a valuable tool for measuring liquidity positions and profiles of corporate bond mutual funds. Corporate bond mutual funds rely heavily on nonbank money market instruments for liquidity, and liquidity buffers follow a recurring pattern of post-stress drawdowns and subsequent rebuilding.
2. Data and Methodology
Our analysis is based on SEC Form N-PORT, a monthly regulatory report filed by registered investment management companies. It is the successor of forms N-CSR, N-CSRS, and N-Q that resulted from reporting modernization efforts that began in 2016. A phased regulatory compliance period for N-PORT began in 2019 Q3 and finished in 2020 Q2, the first reporting quarter containing the full universe of filers. For our purposes, we use the data beginning in 2019 Q4, the first quarter with reasonably broad coverage, which also allows us to capture the before-and-after dynamics of the COVID-19 pandemic shock. The data are available in researcher-friendly format on the SEC website.3
While N-PORT filings contain detailed information related to fund size, performance, holdings, and other activities relevant to financial stability, quantifying fund liquidity is left to the creativity of researchers due to the confidentiality of some form items. Namely, Item C.7 asks filers to categorize their individual holdings into one of four liquidity classifications, but this information is not disclosed to the public. Similarly, funds are asked to classify their holdings using the Fair Value Level Hierarchy (Item C.8), but this concept is too coarse of a proxy for liquidity relative to what other features of the data offer.
We instead draw on the rich set of individual holdings data to infer the missing information on mutual fund liquidity and identify fund types by their asset holdings. Specifically, the holdings data contain details about the asset type (Item C.4.a), issuer type (C.4.b) and domicile (C.5.a), maturity date for debt securities (C.9.a), and dollar value (C.2.c). We use this information to define Short-Term Liquid Assets (SLA) as the total dollar amount of:
- Cash and cash-equivalents (Item B.2.f).
- Treasury bills maturing in 90 days or less.4
- US-domiciled repurchase agreements maturing in 90 days or less.
- US-domiciled short-term investment vehicles (STIVs).5
For comparison purposes, we divide the SLA for each fund by its net assets to arrive at the Short-Term Liquid Assets Ratio (SLAR).
Finally, we augment the N-PORT data by joining it with N-CEN, an annual report that contains census-like information about registered investment management companies, to construct our sample of long-term, domestic corporate bond mutual funds using the criteria in Table 1.
Table 1: Criteria for Long-Term, Domestic Corporate Bond Mutual Funds
| Sample Feature | Criteria | Rationale | Data Source |
|---|---|---|---|
| Long-term | The weighted average maturity (WAM) of their portfolio is at least 3 years. | Excludes short-term funds that are required by mandate to invest in liquid assets. | N-PORT |
| Domestic Corporate Bond | Their total corporate debt holdings from U.S.-based issuers account for at least 55% of their net assets.6 | Excludes other types of funds such as equity funds, government funds, municipal funds, and international funds. | N-PORT |
| Mutual Funds | They are an open-end mutual fund (SEC filer type N-1A). | Excludes other fund types (e.g., an exchange-traded fund). | N-CEN |
Table 2 shows selected characteristics of the final sample, which covers the time period of 2019 Q4-2025 Q3 and contains 369 unique funds. As of 2025 Q3, these funds account for about $451 billion in total net assets altogether.
Table 2: Sample Characteristics
| Metric | Value | |
|---|---|---|
| Full Sample | Time Period | 2019 Q4–2025 Q3 |
| Unique Funds | 369 | |
| Total Observations | 5,458 | |
| Fund Size Statistics as of 2025 Q3 (Net Assets, $M) | 25th Percentile | $163 |
| Median | $485 | |
| Average | $2,156 | |
| 75th Percentile | $1,394 | |
| Total Net Assets of all Funds | $450,635 |
Our data, curated with the industry-leading data engineering software dbt (data build tool), contributes to the mutual fund research apparatus in at least three ways:
- The sample identification technique is data-informed. Our quantitative criteria identify domestic corporate bond funds by what they actually hold, not by what their investment strategy says they should hold.
- Our technique is scalable to other samples of interest. Treating our data as a product using dbt allows our criteria to be easily modified to study the liquidity profiles of different types of funds.
- It introduces a methodology for on-demand liquidity monitoring.
3. Short-Term Liquid Assets Ratio of Corporate Bond Mutual Funds
This section presents and discusses the findings using the methodology described above.
Figure 1 shows the time series of the distribution of liquid assets for all corporate bond mutual funds in our sample. On average across time, an average (median) corporate bond mutual fund has a SLAR of 4.7% (3.4%). This is consistent with the incentives of funds undertaking significant liquidity transformation to hold liquidity buffers to reduce the costs of meeting investor redemptions. The magnitude is also in line with previous findings from the literature based on datasets that are now discontinued.7 The key distinction of our metric is that it allows for the granular decomposition of short-term liquid assets into cash and cash equivalents, Treasury Bills, repos, and STIVs as described earlier. These instruments serve as liquidity buffers, though their liquidity may vary with conditions in underlying markets, linking fund liquidity not only to investor redemptions but also potentially to those market conditions.
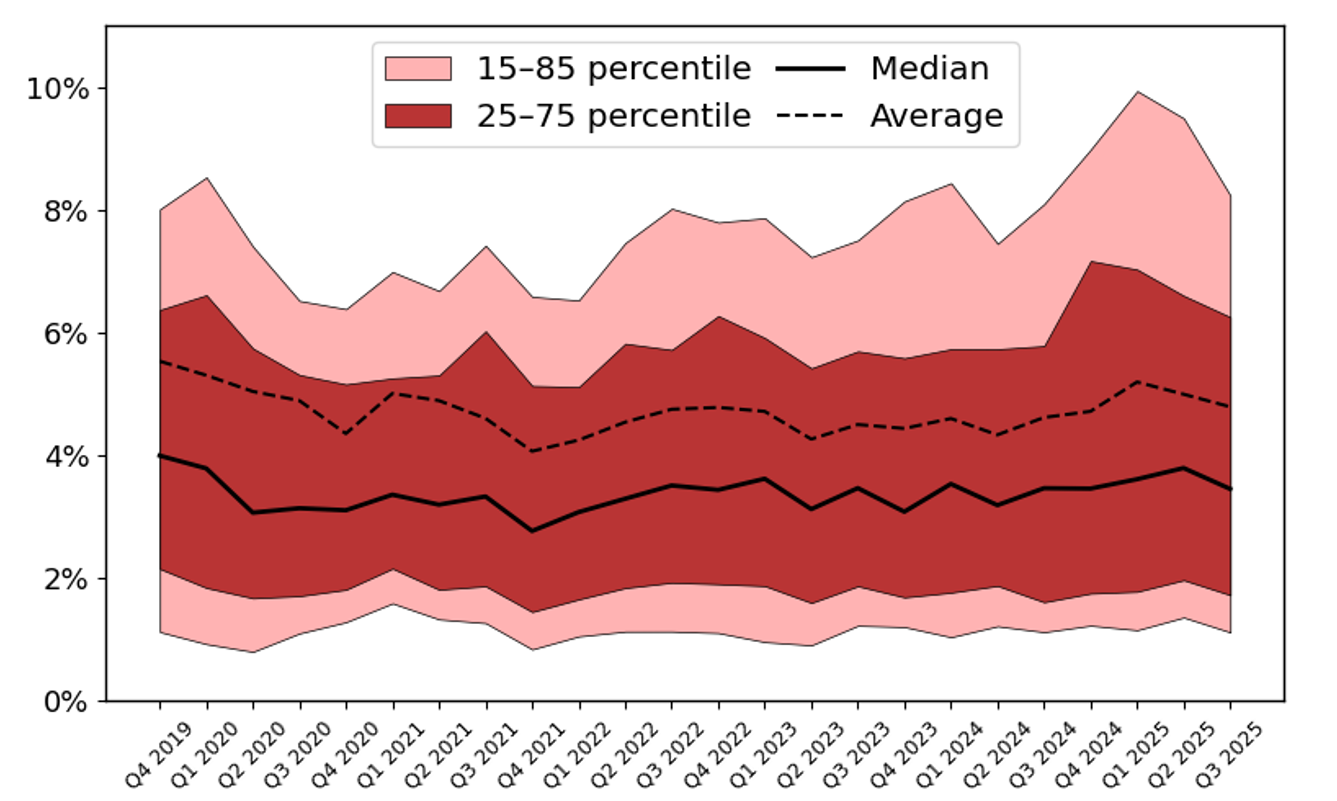
Note: SLAR is defined as short-term liquid assets as a percentage of total net assets. We begin the sample in 2019 Q4, when total assets in our sample reach roughly 90% of the level observed in 2020 Q2, the first quarter with full coverage.
Source: SEC form N-PORT and staff calculations.
Funds have significant cross-sectional heterogeneity in SLAR, as can be seen from the interquartile range (25-75th percentile) of about 1.5-7.2% (dark red region). Some funds, likely the ones with illiquid holdings, have SLAR as high as 10% in some periods (15-85th percentile, light red region). Furthermore, the distribution is right-skewed; the average (dashed black line) hovers around 5%, above the median (solid black line).
Figure 2 now turns to the asset-weighted aggregated SLAR and its composition, which may be more informative about the aggregate industry. Several observations are noteworthy. First, liquidity transformation of bond funds significantly relies on nonbank money market instruments such as STIVs and repos, rather than cash holdings alone. These assets offer funds additional yields while remaining liquid under normal conditions. STIVs amount to more than half of liquidity holdings, or 3.2% of total net assets, in most periods in our sample. STIVs appear to be the instrument through which mutual funds most often adjust their liquidity at the margin. Repo constitutes the second-largest category of SLAR, at 1.5% of total assets. Cash ranks next, with an average share of around 0.4% of total net assets over time. Funds also hold short-term Treasury bills but these account for only a minor component of SLAR.
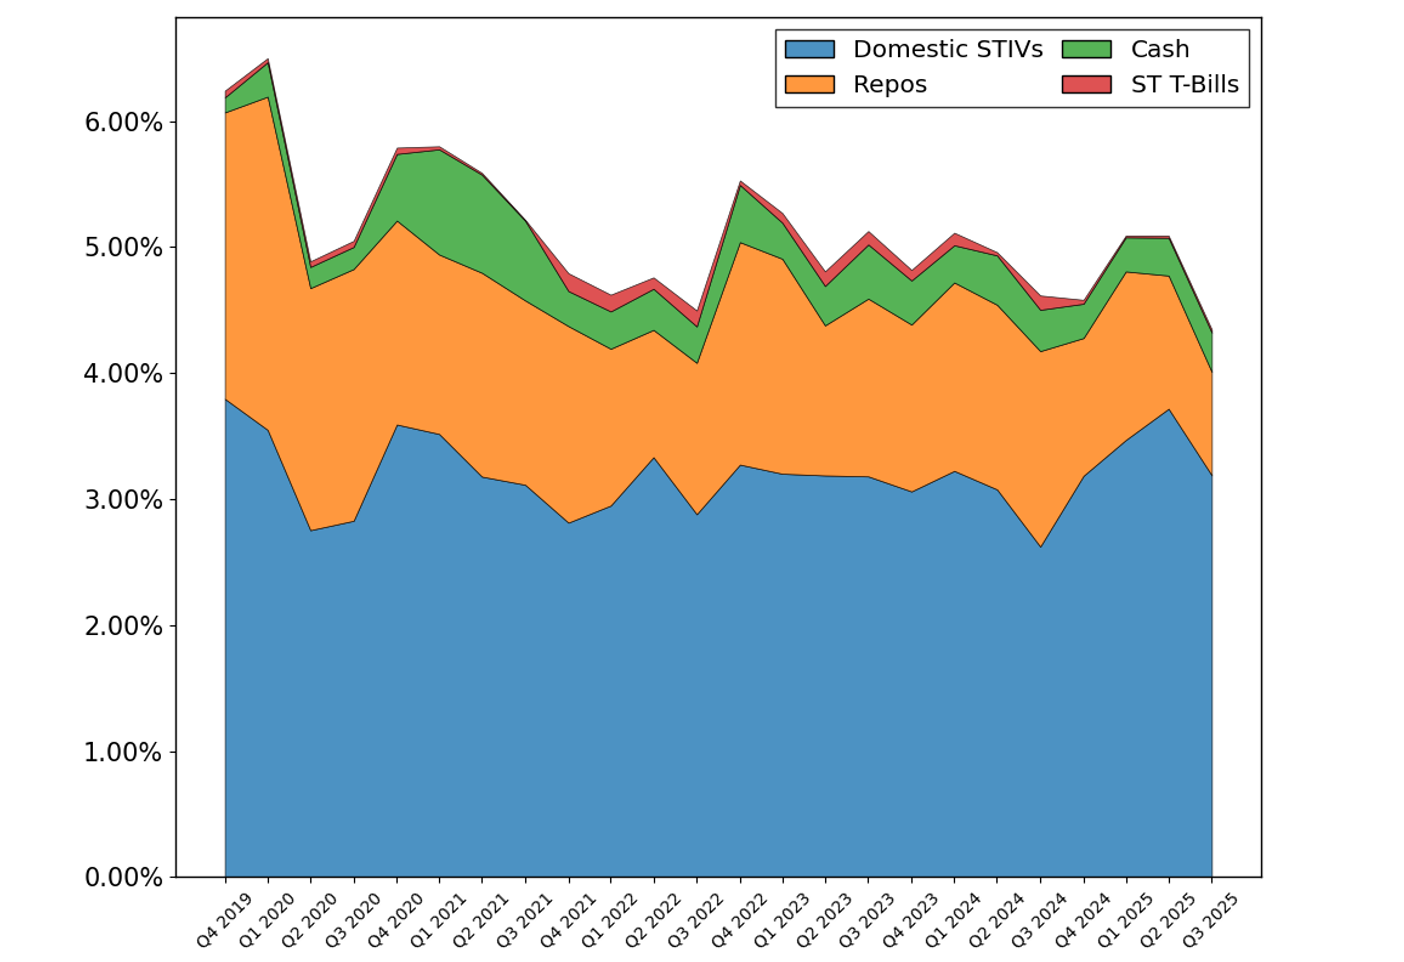
Note: Legend ordered from bottom to top. SLAR is defined as short-term liquid assets (SLA) as a percentage of total net assets. In this figure, we compute SLAR using aggregate values for both the numerator (SLA) and the denominator (total net assets) across all corporate bond mutual funds in our sample. We begin the sample in 2019 Q4, when total assets in our sample reach roughly 90% of the level observed in 2020 Q2, the first quarter with full coverage.
Source: SEC form N-PORT and staff calculations.
Second, the post-stress decline in SLAR followed by subsequent rebuilding appears to be a recurring pattern in liquidity management by bond funds. For instance, after the Covid-19 outbreak in 2020 Q1, the weighted-average SLAR fell from 6.5% to 4.9%, likely an outcome of meeting heavy investor redemptions. Over the subsequent quarters, however, bond mutual funds rebuilt their liquidity positions, supported by strong investor inflows in the remainder of 2020, and SLAR peaked at 5.8% of total assets in early 2021. After the SLAR declined again, reaching its lowest in mid-2022—likely following heavy investor outflows associated with monetary policy tightening—it subsequently rebounded, rising to a similarly high level of 5.5% once again by the end of 2022. Most recently, after April 2025 when some bond mutual funds experienced large redemptions after market volatility episodes, the average ratio declined by 0.8 percentage points, from 5.1% in 2025 Q2 to 4.3% in 2025 Q3. These observations highlight that SLAR fluctuates substantially over time, reflecting the dynamic management of liquid assets in response to stress episodes and evolving market conditions.
To formalize this relationship, we conduct an exploratory ordinary least squares (OLS) regression analysis. Table 3 shows the summary statistics of variables used for the regression. We incorporate two additional fund-level characteristics potentially correlated with SLAR. "Level 3 assets (%)" indicate the fund's portfolio share of assets whose fair values are measured using significant unobservable inputs under the fair value hierarchy, reflecting limited market activity and the absence of quoted prices or observable market-based valuation benchmarks. "Weighted Average Maturity (WAM)" takes the average maturity of the assets held by the fund, using holding amounts as weights, and is shown in years. Both variables might serve as proxies for portfolio illiquidity and interest rate risk, which may necessitate a larger liquidity buffer for precautionary purposes.
Table 3: Summary Statistics of Short-Term Liquid Assets Ratio (SLAR) and Fund Characteristics
| Independent Variable | Observations | Mean | Std | 25th Percentile | 50th Percentile | 75th Percentile |
|---|---|---|---|---|---|---|
| Net Flow (%) | 5,089 | 1.14 | 9.29 | -2.9 | 0 | 3.33 |
| Level 3 Assets (%) | 5,089 | 0.3 | 0.67 | 0 | 0 | 0.24 |
| WAM (Years) | 5,089 | 7.22 | 4.27 | 4.55 | 5.55 | 8.96 |
| SLAR (%) | 5,089 | 4.39 | 3.79 | 1.8 | 3.34 | 5.74 |
Note: "Net flow" is fund's net flow this quarter, in percent. "Level 3 Assets" is in percent. "WAM" refers to weighted average maturity, in years. SLAR is defined as short-term liquid assets (SLA) as a percentage of total net assets. All variables are winsorized at the top and bottom 2.5% of fund-quarter distribution.
Source: SEC form N-PORT and staff calculations.
Table 4 shows the results that broadly align with findings in existing literature. Contemporaneous net flows are positively associated with SLAR, although the economic magnitude of this average effect is modest (a one-percentage-point increase in quarterly net flows is associated with around 5 basis point increase in SLAR). More importantly, SLAR seems to be highly correlated with extreme flows in the last quarter. "Recent High Outflow" and "Recent High Inflow" each indicate whether the fund's lagged net flow fell in the bottom or top 10% of its own flow distribution. While Column (1) provides a baseline specification, the preferred specifications in Columns (2)-(4) introduce time and/or fund fixed effects, which absorb a substantial share of the variation in SLAR. Although the point estimates vary somewhat across these fixed effects specifications, the qualitative pattern remains consistent: funds that experienced unusually large outflows in the previous quarter hold lower liquidity buffers subsequently, whereas those that experienced large inflows hold higher buffers. For instance, in Column (2) with time fixed effects, extreme outflows in the last quarter are associated with SLAR lower by 0.26 percentage points, consistent with active drawdowns of liquidity buffers following stress outflows. In Column (4), which includes both fund and time fixed effects, extreme inflows in the previous quarter are associated with 0.26 percentage points higher SLAR.
Table 4: Short-Term Liquid Assets Ratio (SLAR) and Fund Flows
| Independent Variable | Model | |||
|---|---|---|---|---|
| (1) | (2) | (3) | (4) | |
| Net Flow (%) |
0.06*** (0.01) |
0.04*** (0.01) |
0.04*** (0.01) |
0.05*** (0.01) |
| Recent High Outflow |
0.71*** (0.11) |
-0.26** (0.11) |
-0.12 (0.08) |
-0.15 (0.09) |
| Recent High Inflow |
1.02*** (0.12) |
0.18 (0.12) |
0.14 (0.12) |
0.26** (0.12) |
| 1[Level 3 Assets > 0] |
2.37*** (0.29) |
0.59* (0.34) |
0.02 (0.21) |
0.03 (0.18) |
| 1[Level 3 Assets > 0] × Level 3 Assets (%) |
0.56** (0.23) |
0.36 (0.23) |
0.15 (0.23) |
0.12 (0.24) |
| WAM (Years) |
0.30*** (0.03) |
-0.04 (0.06) |
-0.16*** (0.06) |
-0.13*** (0.05) |
| Time Fixed Effects | X | X | ||
| Fund-Level Fixed Effects | X | X | ||
| R2 | 0.49 | 0.03 | 0.03 | 0.03 |
| Observations | 5,089 | 5,089 | 5,089 | 5,089 |
Note: SLAR is defined as short-term liquid assets (SLA) as a percentage of total net assets; here it is shown in percent. "Net flow" is fund's net flow this quarter, in percent. "Recent High Outflow" and "Recent High Inflow" are each indicator variables that are 1 if the fund's net flow in the last quarter belong to either bottom or top 10% of the fund's net flow distribution. "Level 3 Assets" is in percent and "1{Level 3 Assets>0}" is an indicator variable that is 1 if the fund has a strictly positive Level 3 assets. "Weighted Average Maturity (WAM)" is shown in years. Standard errors are clustered at the fund-time-level in Columns (1) and (3), and at the fund-level in Columns (2) and (4), reported in parentheses. Significance levels are denoted by: *** p<0.01, ** p<0.05, * p<0.1.
Source: SEC form N-PORT and staff calculations.
Fund characteristics also matter. Funds with a higher share of Level 3 assets hold larger liquidity buffers. In Column (2), funds that have positive shares of Level 3 assets are associated with a 0.59 percentage point increase in SLAR, highlighting the role of precautionary liquidity management for illiquid funds. The coefficient becomes statistically insignificant in Columns (3)-(4) once fund fixed effects are introduced, which likely reflects the fact that portfolio allocations tend to be highly stable within funds over time. The relationship with maturity is more nuanced. Longer WAM is associated with lower SLAR in most specifications, suggesting that funds holding longer-dated assets may face lower short-term liquidity needs and lower credit risk, despite greater exposure to interest rate risk.
4. Conclusion
In this note, we show that using a data-informed, flexible approach on N-PORT can be a powerful tool for measuring mutual fund liquidity, in settings where key information is unavailable or incompletely observed in the data. Our analysis reveals that corporate bond mutual funds heavily use a range of short-term liquid assets as liquidity buffers, in particular, STIVs and repos. It might imply that fund liquidity is shaped not only by investor redemptions but also by conditions in markets for these nonbank money market instruments. These liquidity positions fluctuate significantly over time, exhibiting a systematic pattern of post-stress decline followed by subsequent rebuilding. Finally, our curated data and SLA(R) metrics are easily scalable to liquidity monitoring exercises for different samples of funds.
References
Anadu, Kenechukwu, and Fang Cai (2019). "Liquidity Transformation Risks in U.S. Bank Loan and High-Yield Mutual Funds," FEDS Notes. Washington: Board of Governors of the Federal Reserve System, August 9, 2019.
Chernenko, Sergey, and Aditya Sunderam (2016). "Liquidity Transformation in Asset Management: Evidence from the Cash Holdings of Mutual Funds (PDF)." National Bureau of Economic Research Working Paper 22391.
Chernenko, Sergey, and Viet-Dung Doan (2024). "Flow-induced trading: Evidence from the daily trading of municipal bond mutual funds." Available at SSRN 4684397.
Jiang, Hao, Dan Li, and Ashley Wang (2021). "Dynamic Liquidity Management by Corporate Bond Mutual Funds." Journal of Financial and Quantitative Analysis 56 (5): 1622-1652.
1. The views expressed here are strictly those of the authors and do not necessarily represent the views of the Federal Reserve Board or the Federal Reserve System. Return to text
2. Under the current SEC Rule 22e-4, open-end funds must classify their holdings into four liquidity categories and set a "highly liquid investment minimum" (HLIM). However, this requirement only applies to funds that do not primarily hold highly liquid assets, and the funds can also flexibly set their own HLIM, without any uniform minimum. In 2022, the SEC proposed amendments that would have extended the requirement to all funds and set a hard floor of at least 10% of net assets for HLIM; however, this floor was not adopted in the 2024 final rule. Return to text
3. https://www.sec.gov/data-research/sec-markets-data/form-n-port-data-sets. Return to text
4. For all security types, we rely on remaining maturity instead of original maturity since the data only reports remaining maturity. In this way, the sample includes securities that may have had longer original maturities but now have short remaining maturities, which are typically highly liquid. Return to text
5. We relax the 90-day maturity restriction for STIVs since they are short-term liquid assets by nature and most STIV observations in the data do not contain a maturity date. Return to text
6. The 55% cutoff is informed by our exploratory data analysis of the distribution of debt holdings relative to net assets, which is multimodal due to differing fund strategies. We assess that funds at or above the 55% threshold are representative of the true population of domestic corporate bond funds. Return to text
7. Jiang, Li, and Wang (2021) find the average cash held by corporate bond funds to be around 5% of total assets using semi-annual N-SAR filings (discontinued) for 2002-2014. Chernenko and Sunderam (2016) also use the same (discontinued) data and find a median cash and cash equivalent holding of 5.3% for corporate bond funds for 2004-2012. Anadu and Cai (2019) find higher ratios of average cash and cash equivalent holdings for selected bank loan and high-yield mutual funds for 2007-2019. Return to text
Larsson, Erik, Ty Kawamura, and Chaehee Shin (2026). "Measuring Mutual Fund Liquidity with N-PORT," FEDS Notes. Washington: Board of Governors of the Federal Reserve System, May 08, 2026, https://doi.org/10.17016/2380-7172.4037.
Disclaimer: FEDS Notes are articles in which Board staff offer their own views and present analysis on a range of topics in economics and finance. These articles are shorter and less technically oriented than FEDS Working Papers and IFDP papers.