FEDS Notes
May 01, 2026
Monitoring High Credit Growth: The Link Between Local Deposits and CRE Lending
Dulce Lopez Cruz, Teodora Paligorova, and Toshihide Yorozu
Outstanding mortgage debt in the commercial real estate (CRE) sector totaled $6 trillion at the end of 2024 including owner-occupied and nonowner-occupied real estate, multifamily mortgages, and loans backed by acquisition, development, and construction projects. Banks hold half of all CRE debt, with regional and small institutions (under $100 billion in assets) collectively accounting for a larger share of this lending than their larger counterparts with assets over $100 billion.1 The post-2020 CRE market has faced a convergence of structural and cyclical strains including a downward shift in office demand due to hybrid work, high refinancing costs of maturing loans originated in low-rate environments, valuation pressures, and high operating expenses ( FSR, 2023; Gupta et al., 2026). Banks have responded by tightening lending standards for new originations and proactively restructuring existing debt to mitigate systemic defaults (S&R, 2023; GAO, 2024; FSOC, 2024). Developments as of 2025 show signs of stabilization. While delinquency rates for office loans remained at historic highs, they have largely plateaued.
While these aggregate trends provide a broad overview, they mask significant heterogeneity in how different types of banks manage CRE exposure. In this note, we utilize loan-level CRE origination data from 2015 to 2024 to focus on a group of relatively high-growth regional and small banks.2 Despite maintaining balance sheet characteristics similar to those of their peer institutions (i.e., banks with relatively lower CRE growth), high-growth banks rely significantly more on local deposits to fund their CRE loan expansion. This reliance on geographically concentrated funding may create a potential vulnerability, as a localized negative deposit shock could sharply contract credit availability due to the lack of internal capital transfers from other regions.
Regional and Small Banks with High-Growth in CRE Originations
We start by highlighting that CRE originations of small and regional banks (less than $100 billion in assets) grow a lot more than those of large banks (more than $100 billion in assets), which exhibit a decline in CRE originations. Figure 1 illustrates a seven-fold rise for the former from $38 billion at the start of the sample to a peak of $262 billion in 2022 (shown in the solid blue line), followed by a relatively modest decline through 2024. For the same period, large banks experienced a 40 percent decline in CRE originations from $237 billion to $133 billion (shown in the red solid line).3
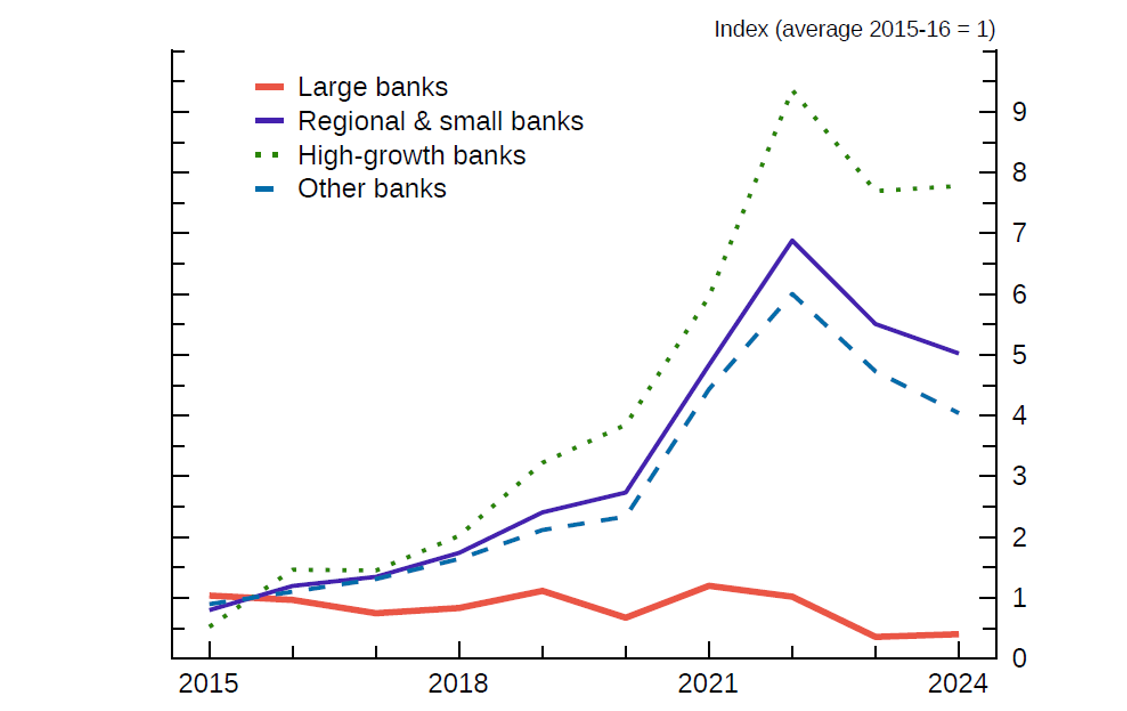
Note: This figure plots a CRE origination index, defined as the annual sum of originations normalized to the 2015–2016 average. Large banks are defined as those with total assets exceeding $100 billion. Regional and small banks (assets less than $100 billion) are classified as "high-growth" if their index value exceeds the 70th percentile for at least three years during the sample period; these banks retain the high-growth designation for the entire sample period.
Source: CRE Public Records and FR Y-14Q.
Focusing exclusively on regional and small banks, we identify a group of institutions with high CRE origination growth (Figure 1, green line). We construct the annual CRE loan growth index for each bank by scaling annual originations to those in the bank's sample entry year. We then define high-growth regional and small banks as those with an annual growth index exceeding the 70th percentile in a given year, finally classifying them as high-growth for the entire sample period if they met this threshold for at least three years.4 Figure 1 demonstrates that these high-growth banks increased their CRE originations 10-fold by 2022 relative to 2015 (dotted green line). For the remainder of our analysis, we label this group as "high-growth banks" and their peers as "other banks." The latter group recorded a more modest five-fold increase in CRE originations over the same period.5
Importantly, the contribution of high-growth regional and small banks to total CRE origination volume is sizable and increasing. In 2016, these top-tier growers accounted for 30 percent of the total CRE origination volume (Figure 2); by 2024, their contribution almost reached 40 percent. In terms of assets' contribution, the high-growth banks account for around 35 percent of total bank assets in our sample.
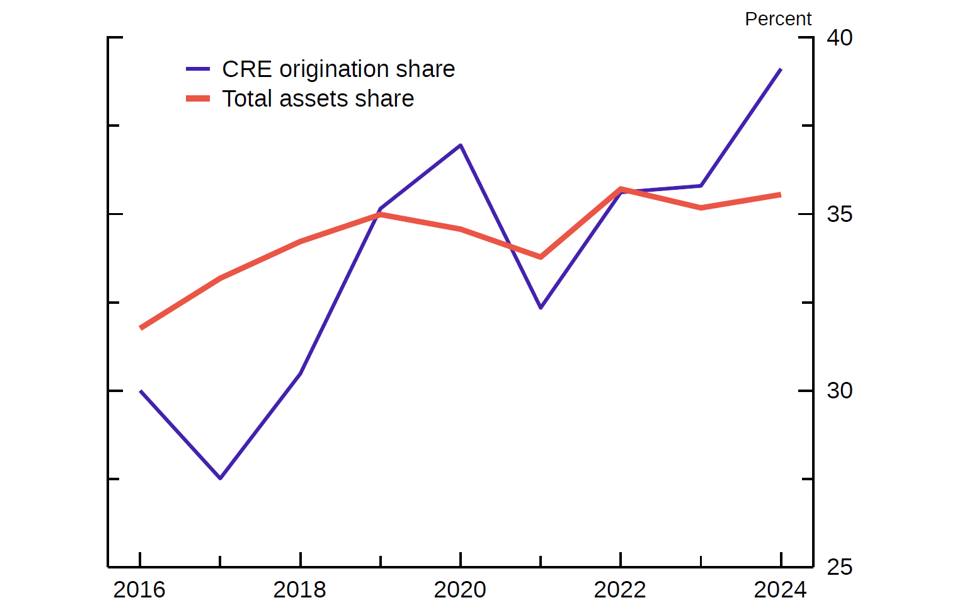
Note: This figure illustrates the annual share of total CRE originations and total assets attributable to "high-growth" banks. The origination share is the annual sum of originations by high-growth banks divided by total sample originations. The asset share is calculated similarly using the annual average of quarterly total assets. Regional and small banks are classified as "high-growth" banks if their origination index exceeds the 70th percentile for at least three years of the sample period; such banks retain this designation for the entire period.
Source: CRE Public Records, FR Y-9C, and Call Reports.
Hinzen et al. (2025) also focus on banks with high CRE growth during the 2012–2019 expansion period and explore the growth strategies they utilized. High-growth banks were significantly more likely to enter new markets. While small high-growth banks tended to expand near their headquarters, regional high-growth banks expanded into new markets regardless of their proximity to headquarters, mimicking the behavior of large national banks.
It is important to understand the drivers of high credit growth banks because they can play a key role in a financial crisis. Schularick and Taylor (2012) find that past credit growth is the single best predictor of a financial crisis. This measure outperformed other macroeconomic variables, including broad money, inflation, and GDP growth. Credit booms do not always result in banking crises; however, when they do, the effects are typically more expansive and long-lasting (Bakker et al., 2012). Further, analyzing U.S. banks from 1973 to 2014, Fahlenbrach et al. (2018) find that bank-level credit booms, like country-level booms, are reliable predictors of future underperformance. Analyzing 637 banking crises across 46 economies, Baron et al. (2026) find that crisis-period losses represent more than temporary price dislocations caused by panics; rather, they are associated with persistent declines in future earnings and dividends, alongside weakened capitalization levels.
Credit extended to real estate and construction could be particularly risky. For example, large CRE losses were the driving force for the savings and loan crisis in the 1980s (Browne and Case, 1992). Real-estate credit booms often create a specific set of vulnerabilities that crystallize during a downturn. To achieve "very high" growth in a competitive CRE market, banks often have to loosen their underwriting standards (e.g., LTV ratios, debt-service coverage) to gain deals from more conservative competitors. Similarly, a rapidly expanding loan book can outpace a bank's internal risk management capacity. When the bust occurs, these banks often lack the granular data or experienced workout officers needed to manage a large volume of simultaneous loan modifications (FDIC, 1997).
CRE Portfolio Composition
Given the historical evidence linking rapid lending expansions to future instability, the recent rise of high-growth CRE banks warrants closer examination. We explore whether this growth is concentrated within specific CRE segments—construction, multifamily, nonfarm nonresidential, office, and retail—or distributed evenly across the asset classes. Using loan-level origination data, Figure 3 illustrates a significant shift in portfolio composition. For high-growth regional and small banks (right panel), the share of construction loans surged from 10 percent in 2015 to 40 percent by 2024. While the relative shares of other loan types remained largely stable, the proportions of office and retail loans declined steadily over the same period. In contrast, while other banks (left panel) also experienced an increase in construction lending, their exposure remained significantly lower than that of their high-growth counterparts.
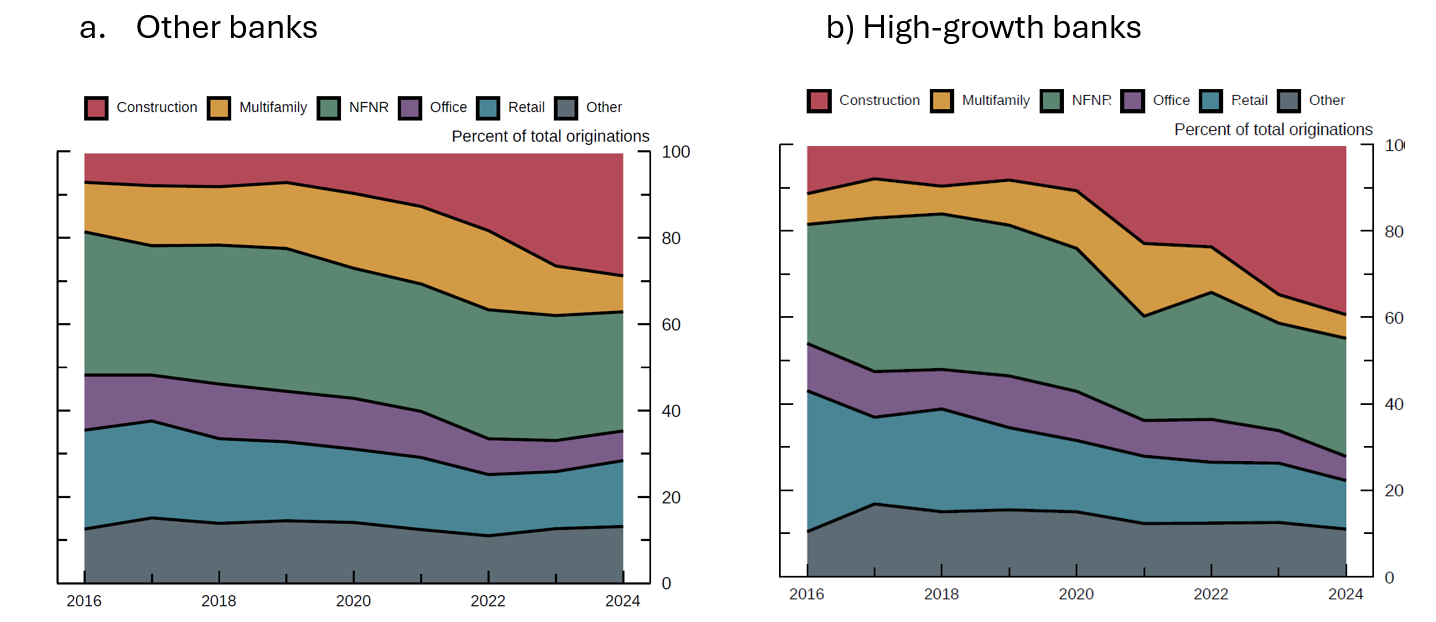
Note: Regional and small banks are classified as "high-growth" banks if their origination index exceeds the 70th percentile for at least three years of the sample period; such banks retain this designation for the entire period. NFNR stands for nonfarm nonresidential loans for industrial, hospitality, and mixed-use properties. Construction includes construction and land development.
Source: CRE Public Records.
By definition, construction loans finance the acquisition, development, or construction of real property. These assets pose heightened credit risks because repayment depends on speculative future income or property sales rather than established cash flows from a completed building. Construction loan portfolios have experienced high loss rates during economic downturns and are a key factor in many bank failures (Ross et al., 2021). Due to their historically higher loss rates, U.S. regulators categorize these as High Volatility Commercial Real Estate (HVCRE) loans, subjecting them to higher risk weights. Notably, Glancy and Kurtzman (2018) find that these capital requirements carry tangible pricing implications, estimating that the HVCRE rule increased loan rates by approximately 40 basis points relative to unaffected CRE loans.
Although small and regional banks have higher share of construction loans, we find they have smaller exposures to office loans, which is consistent with Glancy and Kurtzman (2024) who find that small banks have limited exposures to troubled office properties in central business districts. Further, banks with higher work-from-home exposure have not only tightened their CRE credit supply but have also curtailed lending for risky non-CRE loans (Anenberg et al., 2025), pointing to a broader contraction in credit availability driven by sectoral distress.
Differences between High-Growth and Other Banks
We next analyze the differences in bank balance sheets, contrasting institutions characterized by rapid CRE expansion with those exhibiting more muted growth. Table 1 presents annual, asset-weighted comparisons to illustrate how these diverging CRE trajectories are associated with broader shifts in portfolio composition, financial performance, and risk profiles.
Table 1: Difference in Bank Balance Sheets
| High-growth banks | Other banks | Difference | |
|---|---|---|---|
| Tier 1 capital (percent) | 12.21 | 12.87 | -0.66*** |
| NIM (percent) | 4.93 | 5.53 | -0.60*** |
| CRE/Assets (percent) | 25.83 | 30.19 | -4.37*** |
| Deposits/Liabilities (percent) | 89.08 | 91.22 | -2.15*** |
| Uninsured Deposits/Total Deposits (percent) | 34.15 | 33.13 | 1.02** |
| Delinquency ratio (percent) | 1.07 | 1.68 | -0.61*** |
| Bank assets ($ billion) | 37.39 | 26.91 | 10.47*** |
| Bank assets ($ billion) > $ 5 billion | 31.24 | 23.67 | 7.57*** |
Note: This table reports annual asset-weighted average balance sheet characteristics for high-growth and other banks. The sample is restricted to regional and small banks with total assets below $100 billion. Banks are classified as "high-growth" banks if their origination index exceeds the 70th percentile for at least three years of the sample period; these banks retain this designation for the sample period. Variable definitions are as follows: Tier 1 capital refers to the regulatory risk-based capital ratio; NIM is the annualized net interest margin; and CRE/Assets is the outstanding quarterly balance scaled by total assets. The delinquency ratio is the share of total delinquent loans relative to total loans. Quarterly observations are averaged to create bank-year values. Bank assets are reported in billions of USD.
Source: FR Y-9C, Call Reports, and CRE Public Records.
On average, high-growth banks maintain slightly lower Tier 1 capital ratios and net interest margins (NIM) than their peers. Notably, the share of CRE as a percentage of total assets is lower for high-growth banks; this suggests these institutions may have further headroom to continue expanding their CRE portfolios. Deposit funding remains the primary funding source for both groups, with approximately one-third of these deposits being uninsured.
The weighted average total delinquency ratio for high-growth banks is lower than that of other banks. In terms of scale, high-growth banks have larger asset-weighted average assets, a trend that persists even within the subset of banks exceeding $5 billion in assets. On an unweighted basis, the average bank size in our sample is approximately $4 billion, with a wide distribution ranging from $10 million to $88 billion. Overall, while high-growth banks share many characteristics with the broader sample, they exhibit specific vulnerabilities—namely thinner capital buffers and lower NIMs—balanced against currently better credit quality as measured by delinquency ratios.
CRE Growth and Local Deposit Funding
Bank funding structures are critical for mitigating credit shocks, particularly for high-growth banks that are likely prone to subsequent busts. The reliance on uninsured deposits is a primary source of fragility, as these depositors are highly sensitive to financial distress and prone to triggering bank runs (Egan et al., 2017). In contrast, the banks in our sample maintain a lower share of uninsured deposits compared to the population average that is 50 percent.
Beyond the composition of liabilities, the geographical footprint of deposits introduces another layer of vulnerability. Funding resilience is generally enhanced when banks can source deposits from diverse locations, allowing for the inter-regional transfer of funds to support local loan growth (Doerr, 2024). When banks rely on deposits from the same core-based statistical areas (CBSA) as their CRE collateral, they risk a liquidity squeeze that triggers precisely when credit risk is at its peak.6 For example, a localized economic downturn simultaneously impairs the value of CRE assets while draining liquidity as local residents and businesses, who provide the deposit funding, withdraw cash to cover their own shortfalls. While geographic concentration is a risk, it can be offset by the information advantage of local banks, resulting in more resilient portfolios with lower default rates.
Our analysis is further motivated by Aguirregabiria et al. (2025), who observe that while most banks exhibit a pronounced home bias by maintaining similar loan and deposit shares across regions, many also engage in substantial inter-regional fund transfers. We explore this dynamic by examining the relationship between CRE origination growth at the CBSA-year-bank level and the share of deposits sourced from the same location as the collateral. To facilitate this, we construct a granular dataset merging CRE loan originations from Public Records with the FDIC's Summary of Deposits (SOD).
Figure 4 shows the average loan origination growth at the CBSA-year-bank level, comparing high-growth banks with other banks across three distinct location categories. "High" and "Low" indicate locations where banks hold a deposit share above or below the median for given bank-year group, while "Zero" identifies areas where a bank has active CRE origination but no local deposits. The figure delivers a very clear message: for high-growth banks (shown on the right), CRE origination growth is the highest in locations where they also hold a high deposit share.7 This growth declines alongside falling deposit shares, reaching its lowest level in locations where these banks do not raise deposits. In contrast, other banks (shown on the left) exhibit no discernible pattern between local deposit shares and CRE growth, suggesting that these institutions likely rely on deposits sourced from other locations to fund their lending.
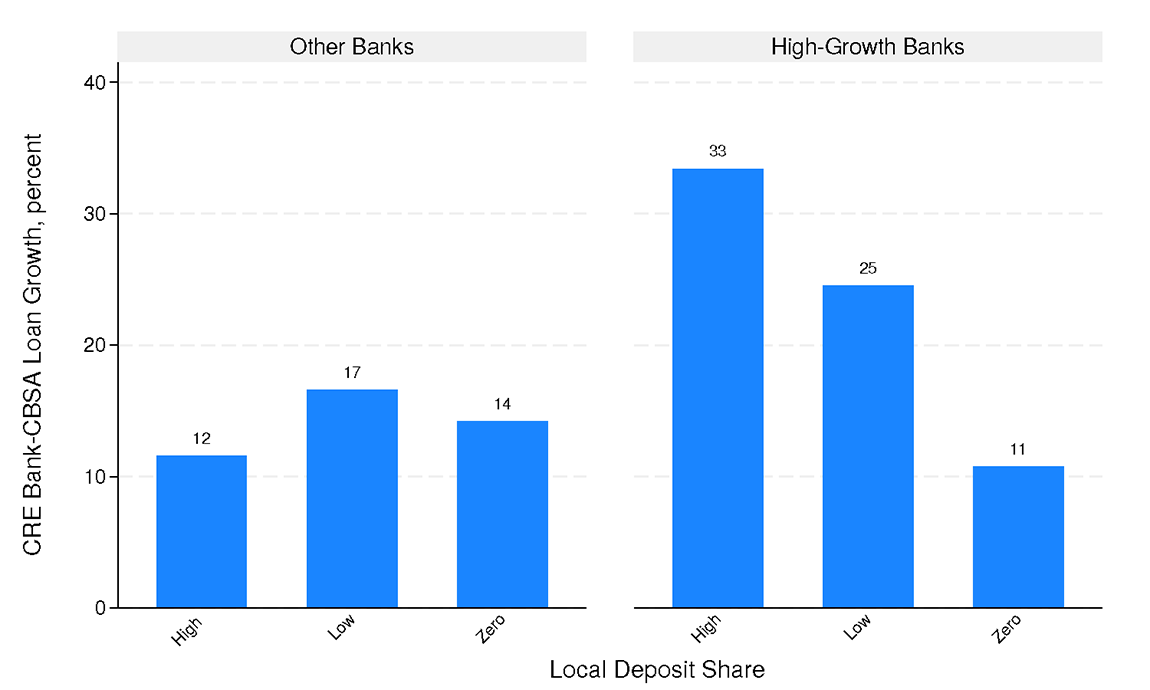
Note: This figure plots average CRE origination growth for high-growth banks versus other regional and small banks. The sample is restricted to institutions with total assets below $100 billion. Within this group, "high-growth" banks are defined as those whose CRE growth index exceeded the 70th percentile for at least three years of the sample period; these banks retain the designation for the entire sample period. The analysis covers the ten largest CBSAs. "High" and "Low" denote locations where a bank's local deposit share is above or below the median for its respective bank-year group, while "Zero" identifies areas where a bank has active CRE originations but no local deposit presence. Local deposit share is the ratio of a bank's deposits in a specific CBSA to its total deposits for that year. CRE loan growth is calculated as the midpoint growth rate.
Source: Summary of Deposits and CRE Public Records.
Table 2 presents the results of our multivariate regressions from 2015 to 2024 for a sample of 565 regional and small banks. As shown in column 1, a high local deposit share—defined as the ratio of a bank's CBSA-specific deposits to its total deposit funding each year—is positively associated with CRE loan growth. The model incorporates bank-level characteristics alongside bank and CBSA-year fixed effects. These fixed effects are critical as they control time-varying macroeconomic factors at the local level, allowing us to rule out the possibility that regional economic conditions are the primary drivers of the observed relationship between local deposits and CRE origination growth.
Table 2: CRE Growth and Deposit Funding
| All (1) |
High-Growth (2) |
Other Banks (3) |
All (4) |
Larger Banks (>$5bn) (5) |
Smaller Banks (<$5bn) (6) |
|
|---|---|---|---|---|---|---|
| Local Deposit Share | 0.087*** | 0.140*** | 0.046* | 0.039 | -0.018 | 0.044 |
| (0.021) | (0.036) | (0.026) | (0.026) | (0.053) | (0.031) | |
| High-growth Bank (1/0) × Local Deposit Share | 0.119*** | 0.231*** | 0.076 | |||
| (0.040) | (0.080) | (0.050) | ||||
| Lag NIM | 0.882*** | 1.766*** | 0.617** | 0.883*** | 1.413 | 0.798*** |
| (0.264) | (0.647) | (0.301) | (0.265) | (1.021) | (0.300) | |
| Lag Delinquency Ratio | -1.540** | 3.508 | -2.010*** | -1.542** | -1.731** | -1.343 |
| (0.665) | (2.423) | (0.691) | (0.665) | (0.765) | (1.521) | |
| Lag Log Bank Assets | -0.095 | -0.078 | -0.244* | -0.098 | -0.004 | -5.473*** |
| (0.091) | (0.137) | (0.141) | (0.091) | (0.103) | (1.996) | |
| Observations | 43,852 | 13,368 | 28,208 | 43,852 | 28,029 | 13,492 |
| R2 | 0.18 | 0.27 | 0.23 | 0.18 | 0.22 | 0.28 |
| # Banks | 565 | 199 | 362 | 565 | 111 | 448 |
| Average Local Deposit Share (percent) | 5.7 | 8.1 | 6.9 | 5.7 | 2.7 | 16.6 |
| Average CRE bank-CBSA Loan Growth (percent) | 13.4 | 15.9 | 12.7 | 13.4 | 13.8 | 13.3 |
Note: This table reports OLS regression coefficients where the dependent variable is CRE loan growth at the bank-CBSA-year level, calculated as the midpoint growth rate. All specifications include bank fixed effects and CBSA-year fixed effects. Local Deposit Share is the ratio of a bank's deposits within a specific CBSA to its total deposit funding for a given year. Control variables include the annualized net interest margin (NIM) and the delinquency ratio (total delinquent loans divided by total loans); both are calculated as annual averages of quarterly observations and lagged by one year. The sample is restricted to regional and small banks with total assets below $100 billion. Within this group, "high-growth" banks are those exceeding the 70th percentile of the CRE growth index for at least three years of the sample period; such banks retain this designation for the entire duration. Standard errors are clustered at the bank level. ***, **, and * denote significance at the 1, 5, and 10 percent levels, respectively.
Source: FR Y-9C, Call Reports, and CRE Public Records.
In columns 2 and 3, we partition the sample into high-growth and other banks.8 The positive relationship between deposit share and CRE origination growth is three times larger for high-growth banks compared to the rest of the sample. In fact, when both groups are combined in a single specification (column 4), the coefficient for local deposit share loses statistical significance, suggesting that local deposit funding is a primary driver of growth only for high-growth institutions.
Regarding the economic magnitude, a one-standard-deviation increase in local deposit share (20 percent) is associated with a 2.8 percent increase in CRE growth within that location. This effect represents approximately 20 percentage points of the mean CRE growth rate. Finally, in columns 5 and 6 of Table 2, we split the sample by bank size to account for the wide bank size variation in the data. Our results are driven by banks with more than $5 billion in assets. This is not surprising as smaller banks typically operate in fewer locations, thus having concentrated local deposit shares.
Our main findings indicate that high-growth banks rely predominantly on geographically concentrated funding, specifically utilizing deposits sourced from the same CBSAs as their underlying CRE collateral. This novel correlation suggests that high-growth banks do not leverage a diversified deposit footprint to support their CRE expansion. Consequently, our results imply that during a localized negative deposit shock, CRE origination growth may contract sharply due to the lack of internal capital transfers from other regions.
While these patterns offer a compelling new perspective on bank behavior, certain areas require further refinement. Currently, the specific transmission mechanism—namely, why high-growth banks prioritize local deposit reliance despite access to a broader geographic depository base—remains an open research question. Furthermore, while our results demonstrate a robust correlation, we are careful to distinguish these patterns from direct causality, as they may be influenced by latent common factors affecting both local deposit flows and lending opportunities.
Conclusion
This note documents several key facts regarding bank CRE portfolios using detailed loan-level data from 2015 to 2024. We find that CRE loan growth is highly heterogeneous among regional and small banks, with a specific cohort of high-growth banks exhibiting rapid expansion. By the end of our sample in 2024, nearly 40 percent of CRE originations were sourced from regional and small banks classified as high-growth banks. Given that excessive credit growth is a primary contributor to financial crises, we examine the potential vulnerabilities that these high-growth institutions may pose to financial stability.
Our analysis reveals that while the balance sheets of high-growth and other banks are broadly similar, high-growth banks maintain slightly lower capital ratios and NIMs yet report lower delinquency rates. Regarding deposit funding, we contribute to the understanding of CRE expansion by uncovering a novel pattern in the nexus between lending and funding—one with significant implications for financial stability. By funding local CRE loans with local deposits, these institutions seem to create a geographic concentration whereby local deposits provide a stable funding base. However, during periods of market stress, the high correlation between local property values and the local deposit base may leave these banks vulnerable to idiosyncratic regional shocks. As CRE markets continue to adjust to post-pandemic shifts, nuanced insights into bank lending behavior—supported by the granular data employed in this note—are essential for identifying and tracking potential vulnerabilities to financial stability.
References
Aguirregabiria, V., Clark, R., and Wang, H. (2025). "The Geographic Flow of Bank Funding and Access to Credit: Branch Networks, Synergies, and Local Competition," American Economic Review, 115(6), 1818-1856.
Anenberg, E., Kim, Y., and Moszkowski, E. (2025). "Work-from-Home, Commercial Real Estate Risk and Credit Supply: Evidence from a Large Sample of Bank Loan Portfolios," available at https://ssrn.com/abstract=5200882.
Bakker, B., Dell'Ariccia, G., Laeven, L., Vandenbussche, J., Igan, D., and Tong, H. (2012). "Policies for Macrofinancial Stability: How to Deal with Credit Booms, " IMF Staff Discussion Notes No. 2012/006.
Baron, M., Laeven, L., Pensasse, J., Usenko, Y. (2026). "Permanent Capital Losses after Banking Crises," Quarterly Journal of Economics, 141(1), 667–732.
Board of Governors of the Federal Reserve System (2023). Financial Stability Report, May 2023.
Browne, L. E., and Case, K. E. (1992). "How the Commercial Real Estate Boom Undid the Banks," in Conference Series [Proceedings], Federal Reserve Bank of Boston, 36, 57-113.
Doerr, S. (2024). "Bank Geographic Diversification and Funding Stability," BIS Working Papers No. 1221.
Egan, M., Hortaçsu, A., and Matvos, G. (2017). "Deposit Competition and Financial Fragility: Evidence from the US Banking Sector," American Economic Review, 107(1), 169–216.
Fahlenbrach, R., Prilmeier, R., & Stulz, R. M. (2018). "Why Does Fast Loan Growth Predict Poor Performance for Banks?," Review of Financial Studies, 31(3), 1014-1063.
Federal Deposit Insurance Corporation (1997). History of the Eighties—Lessons for the Future. Volume 1: An Examination of the Banking Crises of the 1980s and Early 1990s.
Financial Stability Oversight Council (2024). Annual Report (PDF).
Glancy, D., and Kurtzman, R (2018). "How do Capital Requirements Affect Loan Rates? Evidence from High Volatility Commercial Real Estate," Finance and Economics Discussion Series 2018-072, Board of Governors of the Federal Reserve System.
Glancy, D., and Kurtzman, R (2024). "Determinants of Recent CRE Distress: Implications for the Banking Sector," Finance and Economics Discussion Series 2024-072, Board of Governors of the Federal Reserve System.
Gupta, A., Mittal, V., and Nieuwerburgh, S. V. (2026). "Work From Home and the Office Real Estate Apocalypse," American Economic Review, 116 (2), 674–709.
Hinzen, J., Sevrino, F., and Nieuwerburgh, S. V. (2025). "Too-Many-to-Ignore: Regional Banks and CRE Risks," NBER Working Paper.
Ross, E., Nichols, J., and Shibut, L. (2021). "Determinants of Losses on Construction Loans: Bad Loans, Bad Banks, or Bad Markets?," FDIC Working Paper, FDIC CFR WP 2021-07.
Schularick, M., and Taylor, A. M. (2012). "Credit Booms Gone Bust: Monetary Policy, Leverage, and the Last Two Centuries," American Economic Review, 102(2), 1029-1061.
Supervision and Regulation Report (2023) (PDF).
U.S. Government Accountability Office (2024). "Commercial Real Estate: Trends, Risks, and Federal Monitoring Efforts," GAO-24-107282.
Appendix: Data Sources and Sample
Commercial real estate loan-level data (CRE Public Records)
We use data on banks' commercial property loans at the origination level from 2015 to 2024 from FR Y-14Q and CRE Public Records sourced from the Cotality. The latter is sourced from public records filed at county offices. This public records data is at the open-lien level, meaning that each entry in the data represents an outstanding lien that a lender has on a parcel. It provides detailed loan-level information on lender and borrowers identities, loan amount, interest rate, and address that we aggregate to the core-based statistical area (CBSA) level. However, lender naming conventions and geographical information are not standardized across county offices. To standardize and match the CoreLogic lender name strings to RSSD IDs, we rely on Federal Reserve Bank of Cleveland, "S&R Analytics Monitor: CRE Public Records Matched Exposures Data." Our sample matches almost the entire universe of state member banks and some nonmember banks. Because the CRE Public Records sample assigns property types that are consistent with property type definitions in FR Y-14Q (construction; multifamily; retail; nonfarm nonresidential (industrial, hospitality, mixed); office; and other), we rely on CRE loan level data for the large banks with assets above $100 billion from FR Y-14Q. We compile a synchronized sample of 820,000 CRE loan originations for 710 banks (42 large banks and 668 regional and small banks) representing 60 percent of the total CRE outstanding balance for all banks as of 2025: Q1. This sample encompasses $3.3 trillion in CRE originations spanning from 2015 to 2024.
Our sample has low coverage for banks with less than $1 billion in assets. However, for the sample of banks with more than $1 billion in assets, the coverage increases to 70 percent. Further, for banks with more than $10 billion in assets, the coverage increases to 90 percent. In terms of loan number, our sample is roughly comparable to Anenberg et al. (2025), who use the same data source (for large banks the authors also use CoreLogic) and manage to merge 641,290 loans for 2,197 banks from 2016 to 2023. Their study has a larger bank sample because of better coverage of banks with less than $1 billion assets banks.
From 2015 to 2024, the aggregated CRE loan originations for regional and small banks in the CRE Public Records totaled $1.3 trillion, compared to $2 trillion for large banks that report to FR Y-14Q. At the loan level, we use the following variables: loan size, lender identity, CRE type, and CRE location at the ZIP code of the CRE property.
Bank financial data
We use the quarterly Call Reports (FFIEC 031, 041, 051) and FR Y-9C to capture banks' balance sheet characteristics such as asset size, Tier 1 capital ratio, delinquency rate, and deposit funding. The FR Y-9C is mandatory for bank holding companies with consolidated assets above $3 billion, while Call Reports are mandatory for every national bank, state member bank, and insured state nonmember bank (and savings association) in the United States.
We also use the Federal Deposit Insurance Corporation's (FDIC) Summary of Deposits (SOD),9 which reports the deposit amounts for each branch office. The SOD dataset is updated on June 30 of each year and covers all depository institutions insured by the FDIC, including commercial banks and saving associations. The dataset includes information on branch total deposits, location, and bank affiliation. Based on the county identifier of each branch, we can construct total deposits for each bank in each county. We aggregate the counties at the CBSA level using the HUD crosswalks data files that link counties and CBSAs (HUD USPS ZIP Code Crosswalk Files | HUD USER). To align the deposit data to the calendar annual frequency, we lag the deposit bank-CBSA data for one year. For example, 2024 CBSA data is linked to June 30th, 2023, SOD data.
Since the SOD is a branch-based survey, it forces every dollar of deposits to sit at a specific physical address. There is no "Unassigned" bucket, which creates the often called "headquarters bias." All deposits that cannot be regionally assigned such as online and brokered deposits are assigned to the headquarters. We only keep deposits assigned to full-service branches. The rest that are dropped include electronic banking, trust office, military facility branches. To deal with this issue, we keep deposits assigned to full-service branches. The rest that are dropped include electronic banking, trust office, military facility branches.
1. The other half of the CRE debt is split among life insurance companies, commercial mortgage-backed securities (CMBS), real estate investment trusts, finance companies, government, and government sponsored enterprises. Return to text
2. We use CRE Public Records to measure CRE originations. See the Appendix for sample and description. Return to text
3. This pattern remains robust regardless of the sample composition. When using a balanced panel of banks, with new entries into the sample accounting for less than 3% of the total, the patterns are preserved. Return to text
4. We apply varying percentiles and inclusion criteria regarding bank presence throughout the sample period; the patterns illustrated in Figure 1 remain unchanged. Return to text
5. We consider several alternative definitions for high-growth banks, including specifications that allow for time-varying group assignments. Return to text
6. CBSA is defined as metropolitan statistical areas and micropolitan statistical areas. The former are associated with at least one urbanized area that has a population of at least 50,000, while the latter have at least one urban cluster that has a population of at least 10,000 but less than 50,000. Return to text
7. We use the midpoint growth rate that is defined as: $${{(Loan}_t-{Loan}_{t-1})}/{{(Loan}_t+{Loan}_{t-1})/2}$$. By normalizing the change against the mean of the two observations, the midpoint method stabilizes the variance between regional yearly origination amounts. This leads to more robust statistical inferences and prevents outliers from dominating a regression or sensitivity analysis. Return to text
8. While bank classifications remain constant throughout our sample period, our results are robust to the use of time-varying classifications that allow banks to transition between the high-growth and other categories. Return to text
Lopez Cruz, Dulce, Teodora Paligorova, and Toshihide Yorozu (2026). "Monitoring High Credit Growth: The Link Between Local Deposits and CRE Lending," FEDS Notes. Washington: Board of Governors of the Federal Reserve System, May 01, 2026, https://doi.org/10.17016/2380-7172.4039.
Disclaimer: FEDS Notes are articles in which Board staff offer their own views and present analysis on a range of topics in economics and finance. These articles are shorter and less technically oriented than FEDS Working Papers and IFDP papers.