FEDS Notes
April 16, 2024
Tapping the Brakes: The Effect of the 2023 United Auto Workers Strike on Economic Activity
The United Auto Workers (UAW) union tapped the brakes and called for a strike against all Detroit Three automakers—General Motors (GM), Ford, and Stellantis—on September 15, 2023, after having failed to reach an agreement with the automakers on a new four-year contract. The strike lasted for about six weeks and was the first strike in history targeting all Detroit Three automakers. Instead of a nationwide strike, the union opted for a targeted strike, in which it called for walkouts only at selected plants, but the strike had broader implications because of downstream disruptions. In this note, we discuss the effects of the strike on the automotive sector and the aggregate economy.
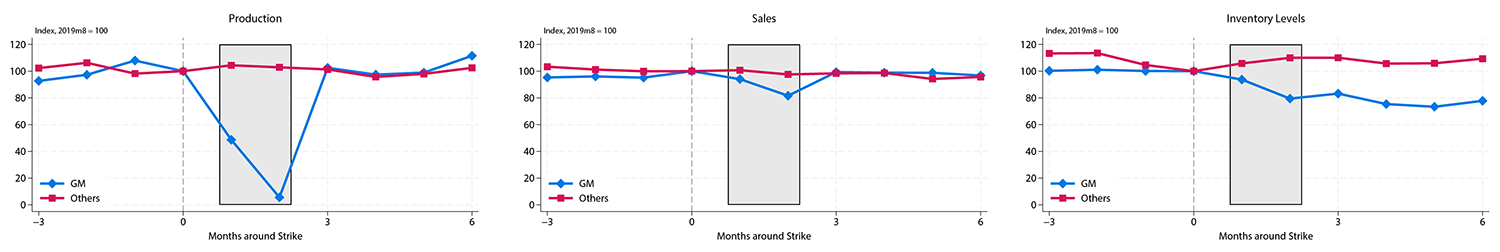
The last time UAW went on strike was in 2019, against GM. This nationwide strike involved about 49,000 UAW members and lasted nearly five weeks, from mid-September through mid-October. Figure 1 shows the evolution of three key metrics—U.S. production, sales, and inventory levels—for GM (the blue line) and all other automakers (the red line) around the time of the 2019 strike. As GM was the only automaker affected by the strike at that time, the evolution of production, sales, and inventory levels at other producers is suggestive of the counterfactual—that is, what would have happened in the absence of the strike.2 As work stoppages affected the entire GM assembly network, GM production dropped close to zero (left panel). The cutbacks in production, in turn, led to smaller but still notable declines in sales (middle panel) and inventory levels (right panel).3 After the strike ended, production levels quickly returned to their baseline and even increased beyond that, suggesting that there was possibly some makeup of strike-related production losses at GM plants.4 GM sales also rebounded after the conclusion of the strike and then reached relatively higher levels compared with other manufacturers. GM's inventory levels dropped significantly during the strike and remained low after the strike ended, as makeup production was not sufficient to both satisfy increasing sales and rebuild inventories—at least by the time the COVID-19 pandemic started.
Left Panel
Note: Evolution of vehicle production around the 2019 strike for affected and unaffected manufacturers, normalized by the levels in the month preceding the strike. Shaded area denotes strike.
Source: Informa Business Media, Inc.
Middle Panel
Note: Evolution of vehicle production around the 2019 strike for affected and unaffected manufacturers, normalized by the levels in the month preceding the strike. Shaded area denotes strike.
Source: Informa Business Media, Inc.
Right Panel
Note: Evolution of vehicle production around the 2019 strike for affected and unaffected manufacturers, normalized by the levels in the month preceding the strike. Shaded area denotes strike.
Source: Informa Business Media, Inc.
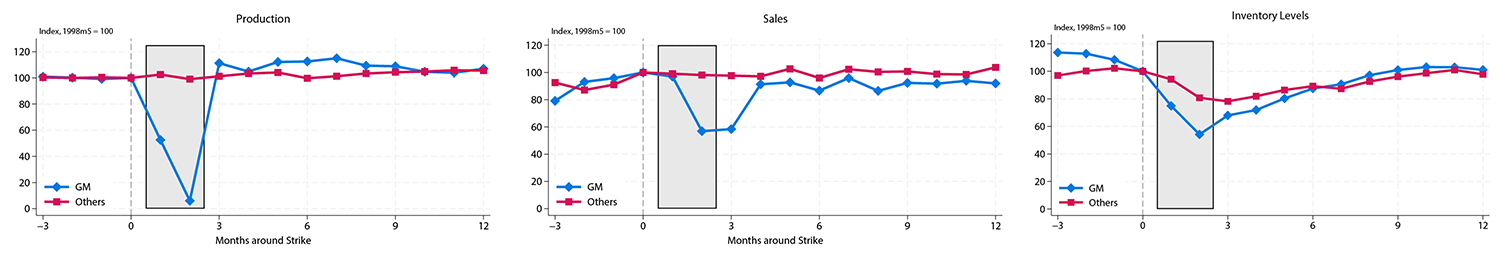
Though there are similarities between the 2019 and the 2023 strikes—for example, the number of members involved and the strikes' length—there are also important differences. The 2023 strike progressed at a slower pace than the 2019 strike, and it was, in this sense, more similar to the 1998 targeted strike against GM, shown in figure 2. The 1998 strike started with a walkout at a GM parts supplier, but it quickly cascaded and ended up forcing production to stop at nearly all GM assembly plants (left panel). The production stoppage caused inventories to drop (right panel) despite significant declines in sales (middle panel). After GM and the UAW reached an agreement, production levels quickly rebounded and, for several months, ran at higher levels compared with other automakers. This increased production allowed GM to rebuild inventories after the strike, even as sales recovered.
Left Panel
Note: Evolution of vehicle production around the 1998 strike for affected and unaffected manufacturers, normalized by the levels in the month preceding the strike. Shaded area denotes strike.
Source: Informa Business Media, Inc.
Middle Panel
Note: Evolution of vehicle sales around the 1998 strike for affected and unaffected manufacturers, normalized by the levels in the month preceding the strike. Shaded area denotes strike.
Source: Informa Business Media, Inc.
Right Panel
Note: Evolution of inventory levels around the 1998 strike for affected and unaffected manufacturers, normalized by the levels in the month preceding the strike. Shaded area denotes strike.
Source: Informa Business Media, Inc.
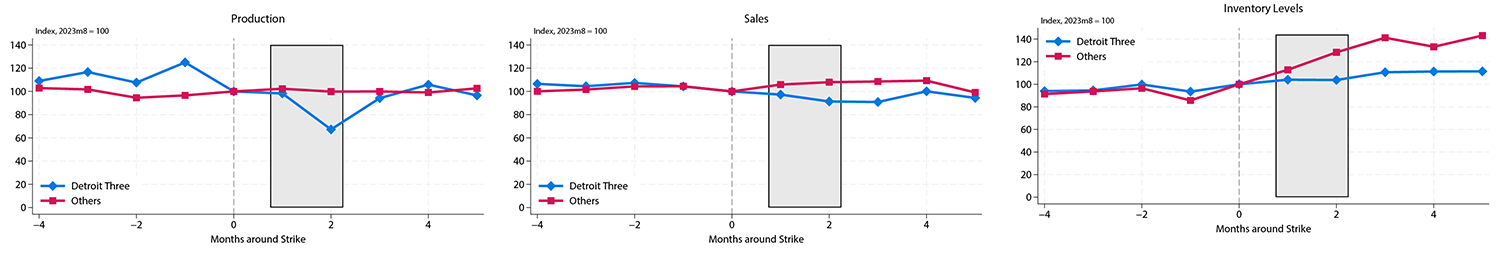
Production and sales experienced broadly similar dynamics during the 2023 UAW strike at the affected manufacturers. The targeted nature of the strike, which, by October, had affected only 36 percent of Detroit Three production, translated into a more limited drop in production and sales compared with previous episodes (figure 3, left panel). Similar to previous strikes, though, the disruption in production was accompanied by a dip in sales (middle panel).
Left Panel
Note: Evolution of vehicle production around the 2023 strike for affected and unaffected manufacturers, normalized by the levels in the month preceding the strike. Shaded area denotes strike.
Source: Informa Business Media, Inc.
Middle Panel
Note: Evolution of vehicle sales around the 2023 strike for affected and unaffected manufacturers, normalized by the levels in the month preceding the strike. Shaded area denotes strike.
Source: Informa Business Media, Inc.
Right Panel
Note: Evolution of inventory levels around the 2023 strike for affected and unaffected manufacturers, normalized by the levels in the month preceding the strike. Shaded area denotes strike.
Source: Informa Business Media, Inc.
The evolution of inventory levels around the 2023 strike is, however, unlike past episodes (right panel). The different dynamics could reflect the greater difficulty in identifying a counterfactual, as the pre-strike patterns in production and sales were not the same for the Detroit Three and other automakers. With this caveat in mind, inventory levels at the Detroit Three did not decline relative to the months preceding the strike, although they increased at significantly slower rates compared with inventory levels at other manufacturers. These surprising inventory dynamics likely reflect the auto sector's push for inventory rebuilding after facing severe semiconductor shortages and other supply disruptions in 2021 and 2022. Furthermore, the more diffused nature of this strike compared with previous episodes could have also played a role.
We now turn to estimating the effects that the most recent strike had on the auto sector and the aggregate economy. We do this estimation in three steps. First, we consider the market share of the three automakers affected by the strike. Figure 4 shows that the Detroit Three currently account for almost 50 percent of total U.S. production (the green line) and about 40 percent of total sales (the teal line). These shares have moved down significantly over time as a result of the rise in foreign-owned auto manufacturers, offshoring, and import competition. Second, we define the counterfactual. Figure 3 shows that using non Detroit Three automakers as the counterfactual might not be the best option, given the different production dynamics depicted by the blue and red lines. Instead, we use plant-level assembly data from Informa Business Media, Inc. for all domestic-producing automakers and assume that, without the strike, each plant's monthly production would have been the same, on average, as in 2023:Q2, the last full quarter of data before the strike started. Third, for each week, beginning on September 15, 2023 (the day the strike started), we calculate how much production was lost in the striking plants and add up these estimates to calculate monthly effects. For simplicity, we assume that production rates are the same for all workdays in a month. Table 1 presents our estimates. We calculate that the strike subtracted 600,000 units from domestic light motor vehicle production in September and 1.8 million units in October (at annual rates). In October, more than one-third of all Detroit Three production—corresponding to one-sixth of domestic production—was lost due to the strike.
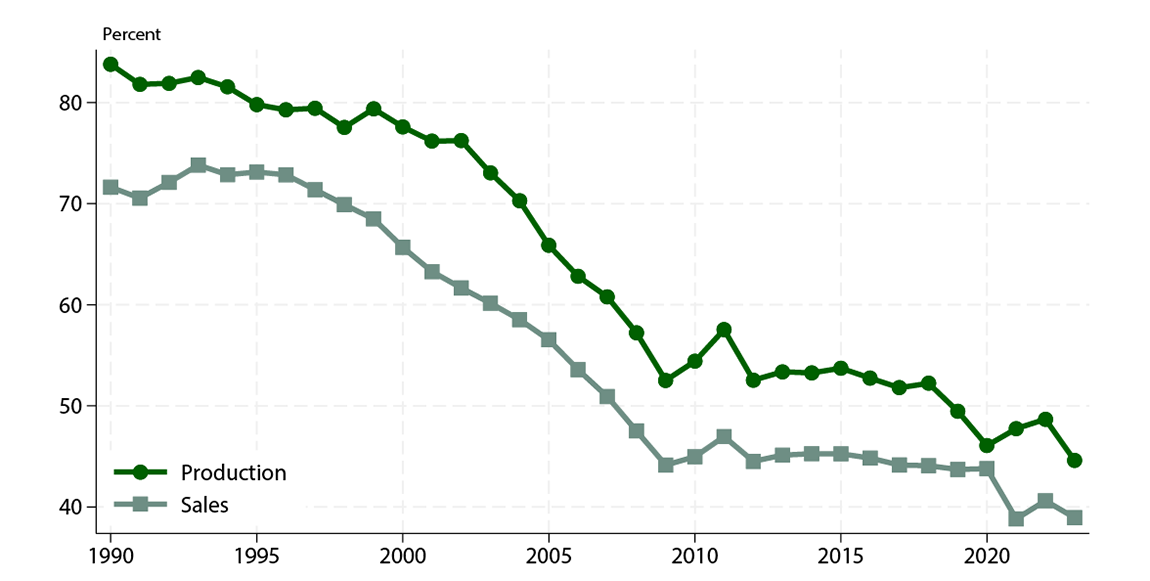
Note: Detroit Three shares of sales and production.
Source: Informa Business Media, Inc.
Although the UAW ordered workers on strike to return to their jobs as soon as it reached tentative agreements with the three automakers (between October 25, 2023, and October 30, 2023), Detroit Three production was still below its pre-strike, 2023:Q2 level in December (figure 3). This lower level was, in part, due to the disruptions that the strike caused along the supply chain, especially to tier 2 and tier 3 suppliers.5 As shown in the table, we estimate that close to 1 million units (at an annual rate) were not produced in November and December as a result of delays in ramping up production.
Table 1. Detroit Three (D3) Production Lost to the Strike
| 2023 | Million units, annual rate | D3 production share | Light vehicle production share |
|---|---|---|---|
| Month | |||
| September | 0.6 | 11.3 | 5.2 |
| October | 1.8 | 35.9 | 16.6 |
| November | 0.8 | 15.9 | 7.4 |
| December | 0.1 | 1.8 | 0.8 |
| Quarter | |||
| Q3 | 0.2 | 3.8 | 1.7 |
| Q4 | 0.9 | 17.9 | 8.2 |
How much did the UAW strike affect GDP growth over the second half of last year? We estimate that the strike subtracted 0.1 percentage point from annualized GDP growth in the third quarter and 0.5 percentage point in the fourth quarter. To calculate these GDP effects, we multiply the motor vehicle output share of GDP (from the Bureau of Economic Analysis (BEA)) by the share of light motor vehicle production lost due to the strike in each quarter (column 3 in table 1).6
The strike also weakened sales, as lower production slowed inventory accumulation for the Detroit Three, affecting vehicle availability at dealerships. The effect on sales was a lot smaller though than the effect on production and relatively smaller than what we saw in previous strikes. We think this difference is likely related to the improved inventory situation for the Detroit Three, as shown in figure 5. Following significant sector-wide struggles with semiconductor shortages and supply chain disruptions in 2021 and 2022, automakers rebuilt a large portion of their inventory over the past two years. The Detroit Three automakers have been especially successful in increasing their days' supply, and, by the second quarter of last year, they had close to 60 days' worth of sales in inventory, compared with 80 days before the COVID-19 pandemic started.
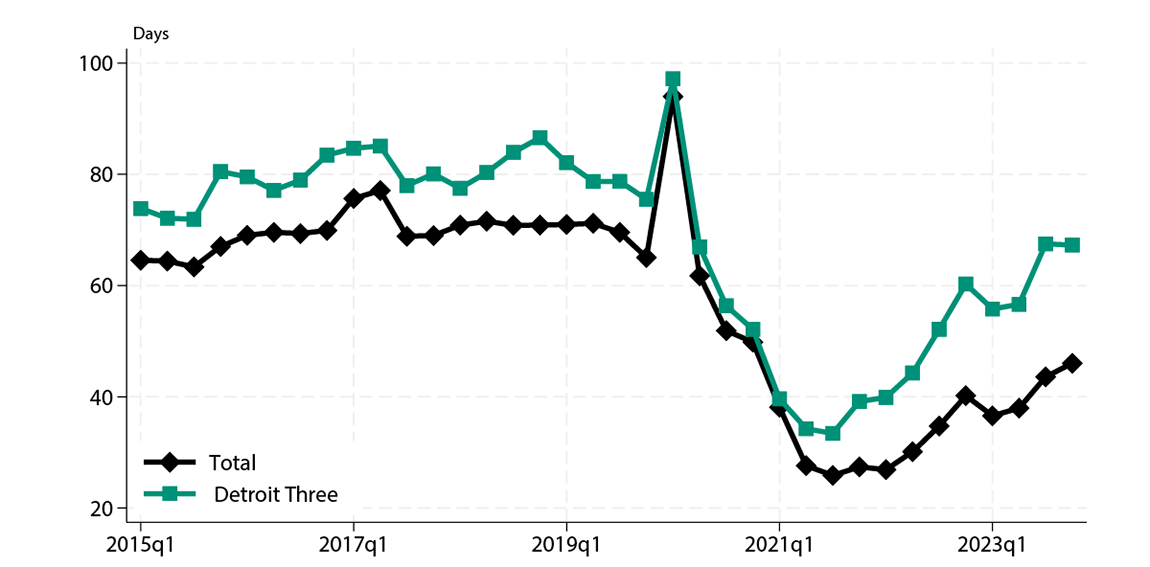
Note: Days’ supply are calculated with end−of−period stock.
Source: Informa Business Media, Inc.
Figures 1 and 2 above show that, in both 1998 and 2019, GM increased its pace of production after reaching normal rates post-strike. This finding suggests that, all things equal, we will likely also see some additional makeup production in 2024, after the Detroit Three reach normal production rates. Past strikes also show that there were makeup purchases post-strike, so we may also see additional sales in the coming months.
What was the effect of the strike on motor vehicle prices? The effect on prices was largely muted, likely because inventory levels did not actually fall during the strike, unlike in 1998 and 2019. As shown in the left panel of figure 6, by the end of the strike, new and used motor vehicle prices were even a little below mid-September levels.
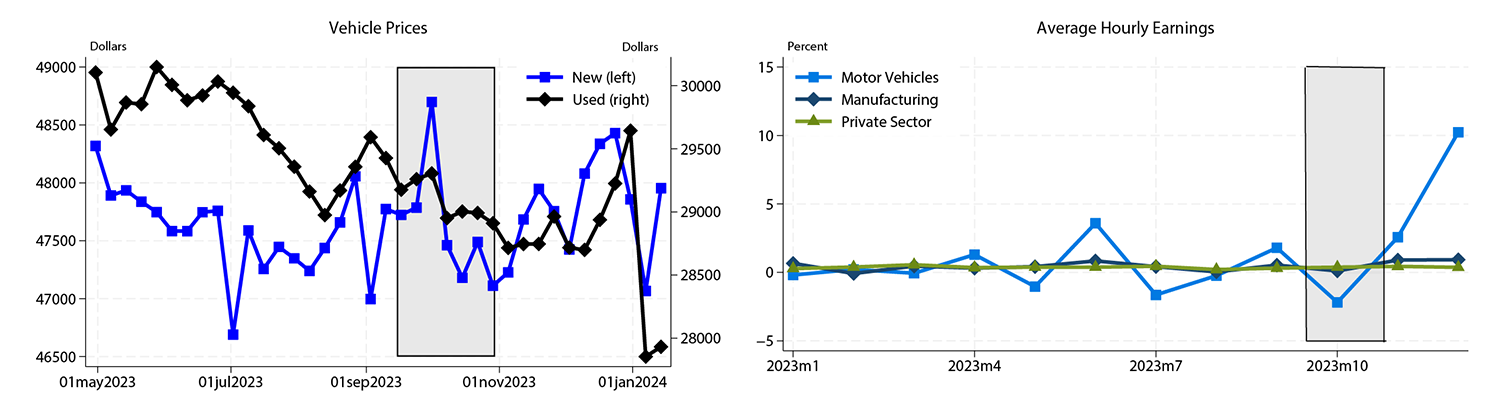
Left Panel
Note: Shaded area denotes UAW strike.
Source: J.D. Power & Associates.
Right Panel
Note: 1−month change in seasonally adjusted average hourly earnings of production workers across different sectors. Shaded area denotes UAW strike
Source: Bureau of Labor Statistics.
Finally, we examine the implications of the strike on wages. The new contracts between the UAW and the Detroit Three automakers included, among other things, 25 percent wage increases over the life of the contracts, with an 11 percent pay boost taking effect upon ratification. These wage increases created some pressure in the rest of the industry, and following the UAW–Detroit Three negotiations, other non-unionized automakers announced wage increases, taking effect this year.7 As a result, sector-level measures of wages seem to have shown a larger response to the strike relative to prices. The right panel of figure 6 compares one-month changes in average hourly earnings around the UAW strike across three sectors: motor vehicles, manufacturing, and the private sector. Between January and October 2023, wage growth in the motor vehicle sector (the light blue line) was broadly in line with wage growth in manufacturing (the dark blue line) or the private sector (the gray line), although it was more volatile. Since October 2023, however, wage growth in the motor vehicle sector has shown a significant acceleration compared to the manufacturing and private sectors; the timing of this acceleration suggests that the strike may have been a contributing factor. At the time of writing, the detailed wage data from the Bureau of Labor Statistics end in January 2024, so going forward, it is possible that the post-strike wage dynamics shown in figure 6 have not fully played out and more wage growth is to come, but it is also possible that the post-strike increases were one-off adjustments.
All told, while economic activity temporarily slowed as a result of the UAW strike, the new agreements brought historic gains for autoworkers. The union tapped the breaks on Detroit Three production and managed to regain many of the benefits it had given up around the time of the Great Recession.
References
Coppola, Gabrielle (2023). "Hyundai Joins Toyota, Honda Hiking U.S. Wages Following UAW Strike," Bloomberg, November 13, https://www.bloomberg.com/news/articles/2023-11-13/hyundai-joins-toyota-honda-hiking-us-wages-following-uaw-strike.
J.D. Power and Associates (2023). "Incentive Spending Report," http://www.jdpower.com/solutions/power-information-network-pin.
Irwin, John (2023). "Smaller Suppliers Still at Risk as Industry Ramps up after UAW Strike," Crain Communications, Inc., Automotive News Data Center, November 17, https://www.autonews.com/manufacturing/supplier-financial-health-still-concern-after-uaw-strike.
Sriram, Akash (2024). "Tesla to Raise Pay for U.S. Factory Workers - Bloomberg News," Reuters, January 11, https://www.reuters.com/business/autos-transportation/tesla-raise-pay-us-production-staff-bloomberg-news-2024-01-11.
U.S. Bureau of Labor Statistics (2024). "Current Employment Statistics - CES (National)," https://www.bls.gov/ces (accessed February 10, 2024).
Informa Business Media, Inc. (2023). "Wards Intelligence Data Query," https://query.wardsintelligence.informa.com (accessed February 23, 2024).
1. We would like to thank Michael Green and Adrian Hamins-Puertolas for excellent research assistance and Jaedo Choi, Chris Kurz, and Daniel Vine for insightful comments. The views expressed in the article are those of the authors and do not necessarily reflect those of the Federal Reserve Board or the Federal Reserve System. Return to text
2. A counterfactual could be based on other assumptions. For example, an alternative counterfactual could rely on the pre-strike levels for the affected plants. In the 1998 and 2019 strike, the counterfactual from this type of exercise would have implied very similar effects to the comparison with other automakers, as the GM pre-strike levels for production, sales, and inventories were in line with the levels at other manufacturers. Return to text
3. The data for sales and inventories are for North America (including Canada and Mexico). Return to text
4. Figure 1 shows the evolution of production, sales, and inventory levels only through February 2020, since the COVID-19 pandemic shock emerged immediately after that and affected the dynamics of those metrics. Return to text
5. See, for example, Irwin (2023). Return to text
6. We calculate the motor vehicle output share of GDP using the BEA's tables 1.1.6. and 7.2.6B. We assume that normal light motor vehicle production is 11 million units per year. Return to text
7. In particular, Hyundai announced an increase in hourly wages of 25 percent over the next four years for workers at Hyundai Motor Manufacturing Alabama and Hyundai Motor Group Metaplant America in Georgia; Toyota announced a 9 percent increase in hourly wages, effective January 1, 2024; Honda announced an 11 percent increase in wages, effective January 8, 2024; and, in January 2024, Tesla announced that production workers will receive a pay hike. See, for example, Coppola (2023) and Sriram (2024). Return to text
Rua, Gisela, and Maria D. Tito (2024). "Tapping the Brakes: The Effect of the 2023 United Auto Workers Strike on Economic Activity," FEDS Notes. Washington: Board of Governors of the Federal Reserve System, April 16, 2024, https://doi.org/10.17016/2380-7172.3477.
Disclaimer: FEDS Notes are articles in which Board staff offer their own views and present analysis on a range of topics in economics and finance. These articles are shorter and less technically oriented than FEDS Working Papers and IFDP papers.