FEDS Notes
May 21, 2026
The CSLT: Unifying U.S. Cross-Border Securities Holdings and Transactions Data1
Andrew McCallum, Laura DeMane, Angela Garcia, Josie Gillette, Tanya Grover, Henry Haw, Hudson Hinshaw, Nyssa Kim, and Andrew Loucky
Introduction
The Treasury International Capital (TIC) system offers comprehensive data on U.S. cross-border securities holdings and transactions, facilitating a detailed understanding of U.S. capital flows. For users new to TIC data, a key fact shapes how to use these statistics: holdings data have been collected for a longer historical period and are measured with greater precision than transactions data. This quality gap motivated researchers using TIC data to construct and validate their own estimates of monthly holdings and transactions. While TIC researchers have published these estimates, current best practice requires users to combine three distinct estimates across different time periods—a process that is error-prone and cumbersome.
This note introduces the Continuous Securities Long-Term (CSLT) dataset, which combines the best available TIC data and estimates to deliver continuous and comparable estimates of monthly U.S. cross-border holdings, transactions, and valuation changes from 1985 to present. The CSLT's ready-to-use estimates are publicly available in a single source through the U.S. Department of the Treasury (UST) website and via Federal Reserve Economic Data (FRED), which offers monthly updates, visualizations, and searchability.2
How transactions, holdings changes, and valuation changes are related
The CSLT does not introduce new estimation methods; it consolidates previously published estimates to provide a continuous, comparable dataset. Understanding the methodologies underlying the CSLT first requires an understanding of the relationships between net transactions (sales and purchases), holdings changes, and valuation changes. These relationships for liability country $$i$$, holder country $$h$$, security type $$j$$, and month $$t$$ are given by the following equation:
$$$$\Delta N_{ihjt}=\Delta H_{ihjt}-\Delta V_{ihjt}-\Delta O_{ihjt}\ (1),$$$$
in which net transactions, $$\Delta N_{ihjt}$$, equals the change in holdings, $$\Delta H_{ihjt}$$, minus valuation change due to price changes, $$\Delta V_{ihjt}$$, minus any other changes, $$\Delta O_{ihjt}$$. U.S. investments in foreign securities are when the United States is the holder, $$h=u$$, and any other, $$i\neq u$$, is the liability country. Foreign investments in U.S. securities are when the holder is a country other than the United States, $$h\neq u$$, and the liability country is the United States, $$i=u$$.
Estimating uncollected transactions, holdings, and valuation changes
Estimating transactions, holdings, and valuation changes components of Equation (1) requires combining data from multiple TIC forms. These forms include 1) the annual survey of U.S. ownership of foreign securities (SHC), 2) the annual survey of foreign holdings of U.S. securities (SHL), 3) monthly transactions of long-term securities by foreign residents (S), and 4) monthly holdings of long-term securities by U.S. and foreign residents (SLT11).3 The CSLT uses different underlying data and methodology in each of three distinct periods. From January 1985 to December 2011, only annual holdings surveys and monthly transactions were available, requiring estimation of monthly holdings, valuation changes, and survey-consistent transactions. From January 2012 to January 2023, monthly holdings became available through SLT11, but transactions and valuation changes still required estimation. Since February 2023, the redesigned SLT form directly collects all Equation (1) components except the residual "other changes." Table 1 summarizes the methodologies and data sources in the CSLT for each period.
Table 1: Method and data source for each measure over different time periods
| Date range | Net transactions | Holdings change | Valuation change | Other changes |
|---|---|---|---|---|
| Jan. 1985 to Dec. 2011 | BT using S | BT using SHC and SHL | BT using price indexes | Zero |
| Jan. 2012 to Jan. 2023 | BJ using SLT11 | SLT11 | BJ using price indexes | Collected |
| Feb. 2023 to present | SLT | SLT | SLT | Residual |
January 1985 to December 2011
The CSLT includes estimates from Bertaut and Tryon (2007) (BT) for monthly holdings and valuation changes, that are used to produce net transactions that are consistent with the annual surveys under the assumption that "other changes" are zero. During this period, monthly transactions data were available from the S form, but holdings were only collected through the SHC/SHL surveys. BT builds on two predecessor methodologies. Warnock and Cleaver (2003) (WC) pioneered the approach of estimating monthly holdings by: 1) adjusting the prior month's estimated holdings for price and exchange rate changes using country- and region-specific indexes (for example, J.P. Morgan EMBI+ or MSCI USA), and 2) adding monthly S form transactions. Thomas, Warnock, and Wongswan (2004) (TWW) refined this approach by distributing discrepancies between estimated monthly holdings and annual survey holdings proportionally across months based on transaction volumes. BT further improved the methodology by distributing discrepancies uniformly across all months, which implicitly adjusts reported transactions to align with observed annual holdings.
January 2012 to January 2023
The CSLT includes estimates from Bertaut and Judson (2022) (BJ). With monthly holdings now available from the SLT11 form (introduced in 2011), estimation shifted from constructing monthly holdings to deriving consistent transactions. BJ does not use S form transaction data because, as Bertaut and Judson (2014) document, these transactions are recorded against the first cross-border counterparty rather than the beneficial owner, creating systematic bias for major financial centers. Instead, BJ derives net transactions from Equation (1) as the change in SLT11 holdings minus valuation changes minus "other changes." During this period, "other changes" are adjustments by staff managing these data for non-transaction position shifts in the data, such as reporting coverage changes and cross-country custodian transfers. Valuation changes are estimated using country- and region-specific price indexes, consistent with prior methodologies.
February 2023 to the present
The CSLT uses data from the redesigned SLT form, which directly measures net transactions, holdings change, and valuation change. Unlike earlier periods, "other changes" are now calculated as the residual from Equation (1) rather than being separately identified or assumed to be zero.
CSLT details, additions, and limitations
Importantly, the TIC SLT form collects all net transactions from the U.S. perspective but holdings from both foreign and U.S. perspectives. Specifically, the SLT collects U.S. purchases, $$P_{iujt}$$, and sales, $$S_{iujt}$$, of foreign securities but also U.S. purchases, $$P_{uhjt}$$, and sales, $$S_{uhjt}$$ of U.S. securities. The CSLT converts the U.S. perspective for transactions to the same perspective as the relevant holdings. As such, U.S. holdings of foreign securities, $$\Delta H_{iujt}$$, use net U.S. purchases, $$\Delta N_{iujt}=P_{iujt}-S_{iujt}$$, and foreign holdings, $$\Delta H_{uhjt}$$, use net U.S. sales, $$\Delta N_{uhjt}=S_{uhjt}-P_{uhjt}$$. Details about the U.S. perspective, "other changes," and examples from the current SLT form are given in McCallum, DeMane, Kim, Liu, and Loucky (2024).
The CSLT also incorporates aggregate and country-level data on foreign holdings of short-term U.S. Treasuries from the BL2 form since 1985 and country-level holdings from 2003.4 While Equation (1) applies to all security types, short-term U.S. Treasuries holdings are measured at face value, eliminating valuation changes. Consequently, net transactions equal the month-to-month change in holdings.
The CSLT compiles the most comprehensive monthly estimates on cross-border securities holdings, valuation changes, and net transactions that are available. However, complete coverage across all countries, dates, and security types is not available continuously back to January 1985. The lack of data occurs for a few reasons including confidentiality restrictions when too few reporters exist for a country-security combination. Also, U.S. liabilities estimates begin in January 1985 (benchmarked to the December 1984 SHL), while U.S. claims estimates begin in April 1994 (benchmarked to the March 1994 SHC).
Using the CSLT to analyze foreign holdings of U.S. Securities
U.S. Treasury securities holdings are among the most studied TIC series. Figure 1 uses the CSLT to confirm the notable trends that have been previously documented in the literature (for example, Tabova and Warnock, 2026).5 Figure 1 shows the foreign share of U.S. Treasury holdings as a fraction of marketable government debt since 1985. CSLT holdings are measured at market value, as is total marketable U.S. Treasuries outstanding published by the Federal Reserve Bank of Dallas.6 Foreign holdings accounted for 32 percent of total Treasury debt in December 2025, a share that has remained relatively stable since 2020 but is 20 percentage points higher than in January 1985. The foreign-owned share peaked in 2008 at 55 percent and tumbled nearly 10 percentage points at the onset of the pandemic, when foreign purchases did not keep pace with the surge in U.S. Treasuries issuance.
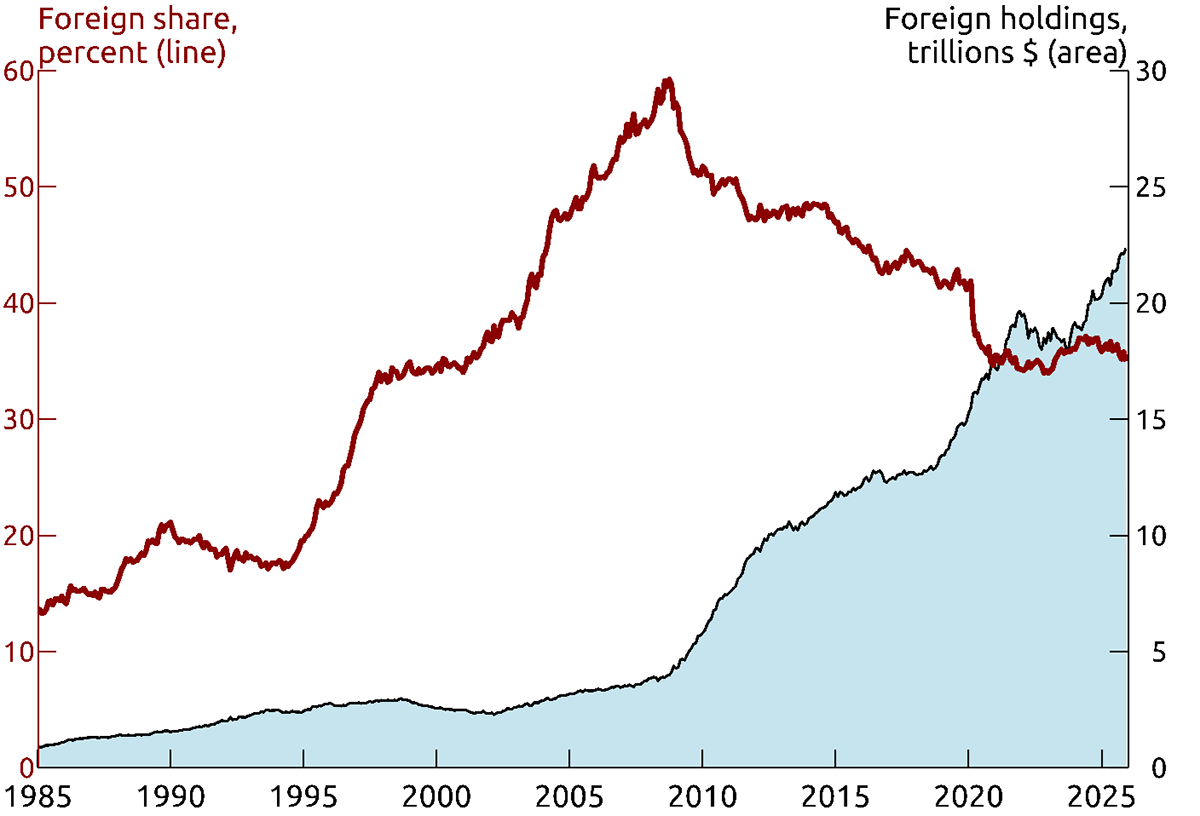
Source: TIC CSLT; Dallas Federal Reserve retrieved from FRED.
The CSLT enables users to easily decompose holdings changes into contributions from their underlying components given by
$$$$\frac{\Delta^k H_t}{H_{t-k}} = \frac{\Delta^k N_t}{H_{t-k}} + \frac{\Delta^k V_t}{H_{t-k}} + \frac{\Delta^k O_t}{H_{t-k}}\ (2). $$$$
The numerators of Equation (2) sum each component of Equation (1) over the prior $$k$$ months and over all $$h$$ holder countries, for example, $$\Delta^k N_t=\Delta^k N_{ijt}=\sum_h \sum^{k-1}_{l=0} \Delta^k N_{ihjt-l}$$. The denominator divides that sum by holdings of all $$h$$ holders, $$H_{t-k}=\sum_h H_{ihjt-k}$$ to express changes and contributions in percent terms. A decomposition like Equation (2) could use any combination of subindexes but in the following analysis we focus on only total foreign holdings of a given U.S. security type. This is why Equation (2) sums over all $$h$$ holder countries and does not vary by security type $$j$$ or liability country $$i$$, which are therefore omitted.
Figure 2 uses Equation (2) with rolling 12-month periods ($$k=12$$) to decompose percentage changes of total foreign holdings of U.S. Treasuries (black line) into the contribution from net transactions (U.S. sales to foreign investors, gold area), valuation changes (green area), and other changes (diagonal striped area). Figure 2 shows that movements in foreign holdings of U.S. Treasuries have been primarily driven by net transactions since 1985. Net transactions of U.S. Treasuries are generally positive with notable exceptions in the early 2000s and, to a lesser extent, between 2010 and 2021. In recent years, net transactions have increased foreign holdings by 10 percent per year.
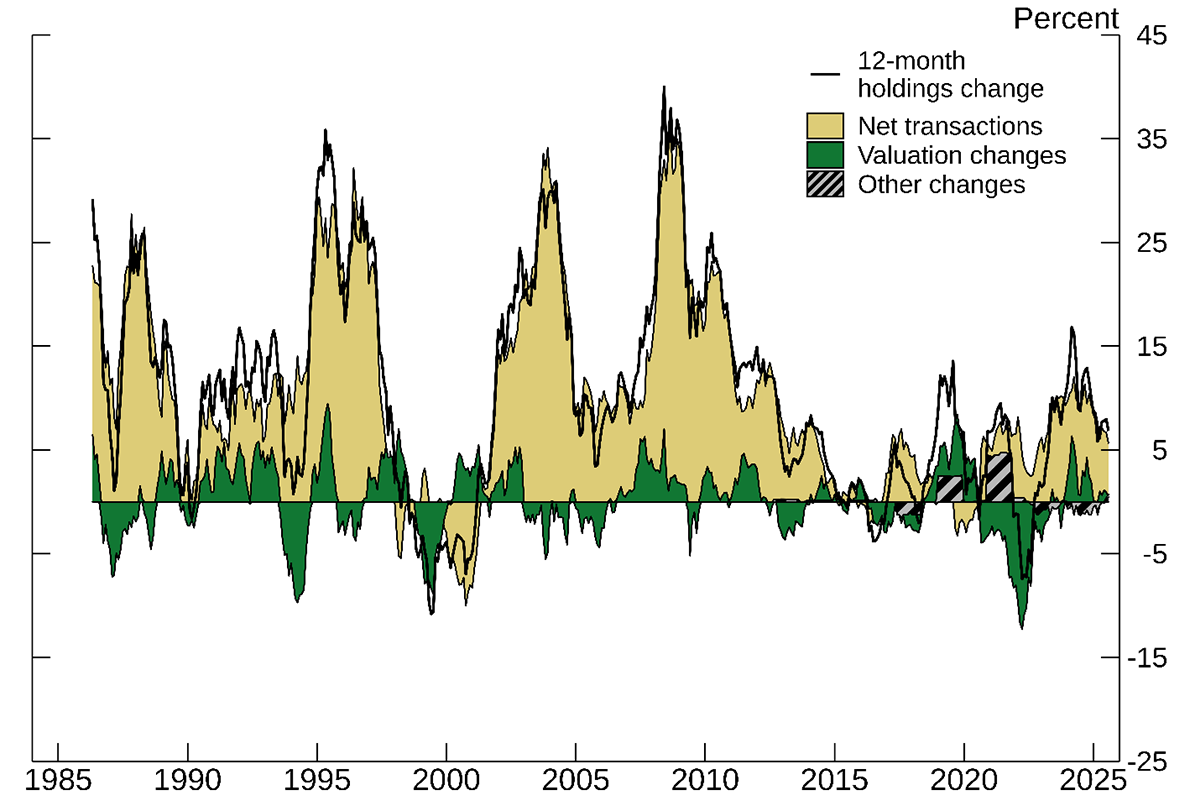
Source: TIC CSLT.
Figure 3 applies the same decomposition as Figure 2 but to total foreign holdings of U.S. equities. While net transactions dominate U.S. Treasuries holdings changes (Figure 2), valuation changes are the primary driver for equities (Figure 3). Unsurprisingly, the range of 12-month holdings changes for equities is roughly twice as large as for U.S. Treasuries, reflecting greater price volatility. Interestingly, the decomposition also reveals that foreign investors tend to increase purchases of U.S. equities following major price declines in 2000, 2007, and to a lesser extent 2015. Comparing Figures 2 and 3 underscores why distinguishing between transactions and valuation changes is essential for interpreting holdings changes. The CSLT makes these measures readily accessible.
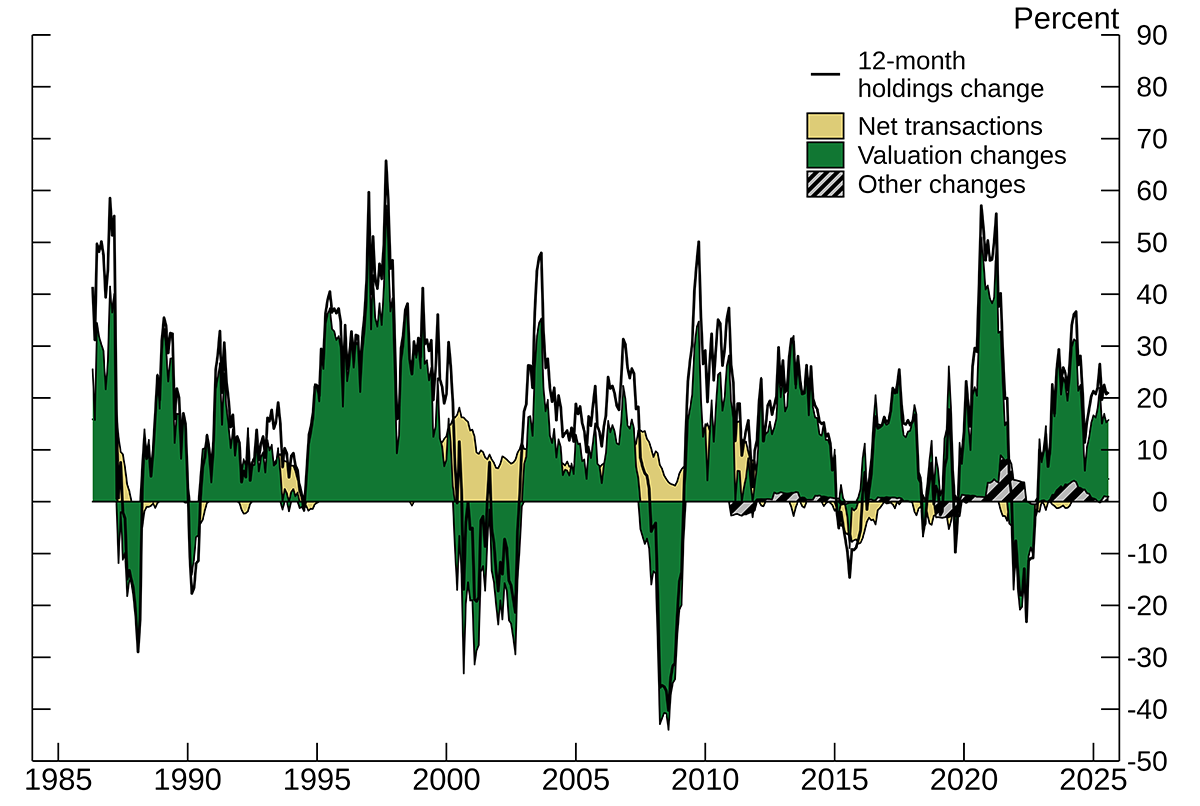
Source: TIC CSLT.
The CSLT also enables tracking of Major Foreign Holders (MFH) of U.S. Treasuries back to 2003. Country-specific U.S. Treasuries holdings became available in 2003, whereas aggregate holdings extend back to 1985. The MFH table, published by the UST and listing the top holders of U.S. Treasuries, is among the most cited TIC publications and is now readily accessible through FRED.7 Figure 4 uses CSLT estimates to track the evolution of holdings shares for the top nine MFH countries as of December 2025. These nine countries collectively hold about 45 percent of foreign-held U.S. Treasuries, a share that has remained relatively stable since the early 2000s. However, the distribution among these holders has shifted substantially and become far less concentrated. Japan remains the largest foreign holder but has declined from over 30 percent in the early 2000s to about 12 percent in December 2025. China rose from second place in 2003 to the largest holder (holding roughly 30 percent of total foreign holdings) in 2009 before declining to about 8 percent today. Meanwhile, the United Kingdom, Belgium, Ireland, Luxembourg, the Cayman Islands, and France have risen from minor holders to the top nine.8 The increase in holdings for these countries partly reflects the growing importance of major financial and custodial centers and the globalization of financial intermediation, which are now easily traceable through the CSLT's continuous country-level holdings data.
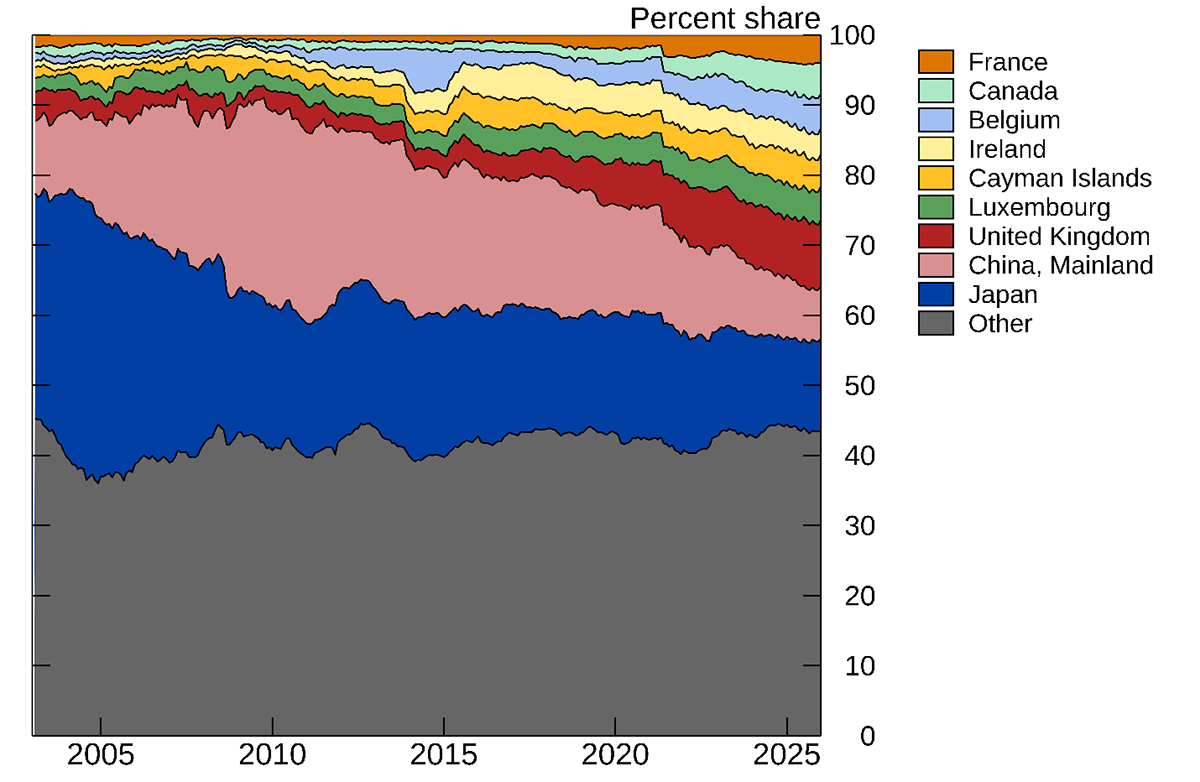
Source: TIC CSLT.
Conclusion
Careful measurement of cross-border securities holdings and returns is critical to understanding the causes and consequences of capital flows, as highlighted in recent research on the foreign ownership of U.S. Treasuries and returns on non-Treasury securities (Tabova and Warnock, 2025, 2026). The CSLT enables this careful measurement by providing the best available estimates of monthly U.S. cross-border securities holdings, transactions, and valuation changes in a single, comprehensive, up-to-date, publicly available dataset spanning 1985 to present.
References
Barth, Daniel, Daniel Beltran, Matthew Hoops, Jay Kahn, Emily Liu, and Maria Perozek (2025). "The Cross Border Trail of the Treasury Basis Trade," Finance and Economics Discussion Series. Washington: Board of Governors of the Federal Reserve System, October 15.
Bertaut, Carol and Ralph Tryon (2007). "Monthly Estimates of U.S. Cross-Border Securities Positions," International Finance Discussion Papers 910. Washington: Board of Governors of the Federal Reserve System, November.
Bertaut, Carol and Ruth Judson (2014). "Estimating U.S. Cross-Border Securities Positions: New Data and New Methods," International Finance Discussion Papers 1113. Washington: Board of Governors of the Federal Reserve System, August.
Bertaut, Carol and Ruth Judson (2022). "Estimating U.S. Cross-Border Securities Flows: Ten Years of the TIC SLT," Finance and Economics Discussion Series. Washington: Board of Governors of the Federal Reserve System, February 18 (updated September 2025).
Bertaut, Carol and Ruth Judson (2023). "Measuring U.S. Cross-Border Securities Flows: New Data and A Guide for Researchers," Finance and Economics Discussion Series. Washington: Board of Governors of the Federal Reserve System, October 2.
Bertaut, Carol and Ruth Judson (2025). "Measuring U.S. Cross-Border Securities Flows: Out With the Old, In with the New," Finance and Economics Discussion Series. Washington: Board of Governors of the Federal Reserve System, October 15.
Federal Reserve Bank of Dallas, Market Value of Marketable Treasury Debt [MVMTD027MNFRBDAL], retrieved from FRED, Federal Reserve Bank of St. Louis; https://fred.stlouisfed.org/series/MVMTD027MNFRBDAL, April 2, 2026.
McCallum, Andrew H., Laura DeMane, Nyssa Kim, Emily Liu, and Andrew Loucky (2024). "Introducing New Valuation Change Data for U.S. Cross-Border Portfolio Holdings," Finance and Economics Discussion Series. Washington: Board of Governors of the Federal Reserve System, April 18.
Tabova, Alexandra and Francis E. Warnock (2025). "Exorbitant changes in three parts," NBER Working Papers 34372, December.
Tabova, Alexandra and Francis E. Warnock (2026). "Preferred habitats and timing in the world's safe asset," Journal of International Economics, vol. 161, 104233, May.
Thomas, Charles P., Francis E. Warnock, and Jon Wongswan (2004). "The Performance of International Portfolios (PDF)," International Finance Discussion Papers 817. Washington: Board of Governors of the Federal Reserve System, October.
Warnock, Francis E. and Chad Cleaver (2003). "Financial Centres and the Geography of Capital Flows," International Finance, vol. 6 (1), pp. 27–59, June 17, https://doi.org/10.1111/1468-2362.00111.
1. The Department of the U.S. Treasury, the Federal Reserve Bank of New York, and the Board of Governors of the Federal Reserve System express their appreciation to all respondents whose efforts and information have made the construction of this dataset possible. We also thank the FRED Data Desk team at the Federal Reserve Bank of St. Louis. Return to text
2. Treasury: https://ticdata.treasury.gov/resource-center/data-chart-center/tic/Documents/cslt.zip
FRED: https://fred.stlouisfed.org/release?rid=3 Return to text
3. TIC SHC/SHCA: "Report of U.S. Ownership of Foreign Securities, Including Selected Money Market Instruments". See https://home.treasury.gov/data/treasury-international-capital-tic-system-home-page/tic-forms-instructions/forms-shc.
TIC SHL/SHLA: "Report of Foreign-residents' Holdings of U.S. Securities, Including Selected Money Market Instruments". See https://home.treasury.gov/data/treasury-international-capital-tic-system-home-page/tic-forms-instructions/forms-shl.
TIC S: "Purchases and Sales of Long-term Securities by Foreign-Residents." See https://home.treasury.gov/data/treasury-international-capital-tic-system-home-page/tic-forms-instructions/tic-s-form-and-instructions.
TIC SLT (2011): "Aggregate Holdings of Long-term Securities by U.S. and Foreign Residents (PDF)." See https://ticdata.treasury.gov/resource-center/data-chart-center/tic/Documents/fslt.pdf. Return to text
4. TIC BL-2: "Report of Customers' U.S. Dollar Liabilities to Foreign Residents." Return to text
5. Tabova and Warnock (2026) study all types of investors, their behavior, and provide a detailed evaluation of cross-border flows and holdings of U.S. Treasuries. Return to text
6. The market value of U.S. Government Debt is estimated by applying current market prices to outstanding par amounts and aggregating across securities and is available in FRED: https://fred.stlouisfed.org/series/MVMTD027MNFRBDAL and published by the Federal Reserve Bank of Dallas: https://www.dallasfed.org/research/econdata/govdebt. Return to text
7. Table 5: Major Foreign Holders of Treasury Securities. See ticdata.treasury.gov/resource-center/data-chart-center/tic/Documents/slt_table5.txt. Return to text
8. Cayman Islands' holdings of U.S. Treasuries are likely mismeasured in the CSLT and SLT as discussed in Barth, Beltran, Hoops, Kahn, Liu, and Perozek (2025). Return to text
McCallum, Andrew, Laura DeMane, Angela Garcia, Josie Gillette, Tanya Grover, Henry Haw, Hudson Hinshaw, Nyssa Kim, and Andrew Loucky (2026). "The CSLT: Unifying U.S. Cross-Border Securities Holdings and Transactions Data," FEDS Notes. Washington: Board of Governors of the Federal Reserve System, May 21, 2026, https://doi.org/10.17016/2380-7172.4084.
Disclaimer: FEDS Notes are articles in which Board staff offer their own views and present analysis on a range of topics in economics and finance. These articles are shorter and less technically oriented than FEDS Working Papers and IFDP papers.