


FEDS Notes
August 07, 2026
The Price of Bank Funding Behind Private Credit: Evidence from Business Development Companies
Sharjil Haque and Jessie Jiaxu Wang
1.Introduction
Private credit is often described as credit provided outside the banking system. In many cases, this description is accurate: private credit lenders originate loans directly to firms, hold those loans on their balance sheets, and do not rely on deposits in the way banks do. But private credit is not fully separate from banks. Many private credit vehicles, especially Business Development Companies (BDCs), rely on banks for funding through revolving credit lines.
This note focuses on the upstream funding market that connects banks to BDCs. Specifically, we ask: how do banks fund BDCs, and what does the price of that funding reveal about the bank–private credit connection?
Using supervisory data on commercial loans reported by large banks subject to the Federal Reserve's stress tests, matched to BDC financial and investment data, we document three facts. First, BDCs rely heavily on bank credit lines, and this reliance increased during the 2022 monetary tightening cycle. Second, banks charge BDCs a premium during tightening relative to non-BDC borrowers with the same bank-assessed internal credit rating and similar observed characteristics, even though BDC loans are typically senior, collateralized, and associated with lower loss-given-default estimates. Third, bank funding to BDCs is concentrated and relationship-based, suggesting that the premium may partly reflect banks' bargaining power in the upstream market for private credit funding.
These findings are drawn from Haque, Jang, and Wang (2026), which studies the full bank–BDC–firm credit chain and its implications for monetary policy transmission. This note focuses on one subset of those results: the price and structure of bank funding behind private credit.
2. Why Focus on the Price of Bank Funding?
While recent work has documented the rapid growth, key characteristics, and potential risks of private credit (Cai and Haque, 2024; Degerli and Monin, 2024; Berrospide et al., 2025), related academic work studies direct lending, private-credit funding, and bank–nonbank linkages (Chernenko, Erel, and Prilmeier, 2022; Davydiuk, Marchuk, and Rosen, 2024a,b; Chernenko, Ialenti, and Scharfstein, 2025; Li et al., 2026; Xu, 2025). Less attention has been paid to the price of the bank funding that supports private credit. This price is important because bank credit lines are a key source of flexible funding for BDCs. When the cost of those credit lines rises, BDCs may pass some of that cost to the firms they finance. As a result, monetary policy can still transmit through private credit markets, even if private credit volumes remain resilient.
The price is also informative about the structure of the market. If banks charged BDCs higher rates simply because BDC loans were riskier, the premium would be a standard credit-risk premium. But if banks charge higher rates while holding senior, secured, and well-protected claims, the premium may instead reflect the value of bank liquidity, the opportunity cost of bank balance sheet capacity, or market power in a concentrated upstream funding market.
3. The Bank Funding Behind BDCs
BDCs are closed-end investment vehicles that primarily lend to middle-market firms. Like banks, they originate credit to firms. Unlike banks, they do not take deposits. Instead, they fund themselves with a mix of equity, bonds, and bank credit. Among these funding sources, bank credit is especially useful because it often takes the form of a revolving credit line. This reliance on bank credit lines is consistent with broader evidence on bank–NBFI linkages and the value of contingent liquidity from banks to nonbank lenders (Acharya, Cetorelli, and Tuckman, 2024; Gabriel and Sterling, 2025; Xu, 2025). A credit line gives a BDC committed funding that can be drawn when investment opportunities arise, making it valuable in private credit markets where loan origination can require quick access to capital.
Figure 1 illustrates both the growth and the composition of bank lending to BDCs. The two commitment series—total committed bank loans and committed bank credit lines—move closely together throughout the sample, showing that bank lending to BDCs is overwhelmingly credit-line based. The blue line shows committed bank loans to BDC-affiliated special purpose vehicles (SPVs), which are often used to finance BDC loan portfolios through bankruptcy-remote structures. These commitments accounted for roughly half of aggregate BDC bank-loan commitments by the end of the sample. The bars show utilized bank loans, which also rise over time but remain below total commitments, reflecting the undrawn capacity embedded in these facilities. Bank lending to BDCs rose steadily through much of the sample and increased sharply beginning in 2021. By the end of the sample, total bank commitments to BDCs reported in the Y-14 data exceeded $60 billion. In dollar-weighted terms, nearly 90 percent of bank lending to BDCs takes the form of credit lines.
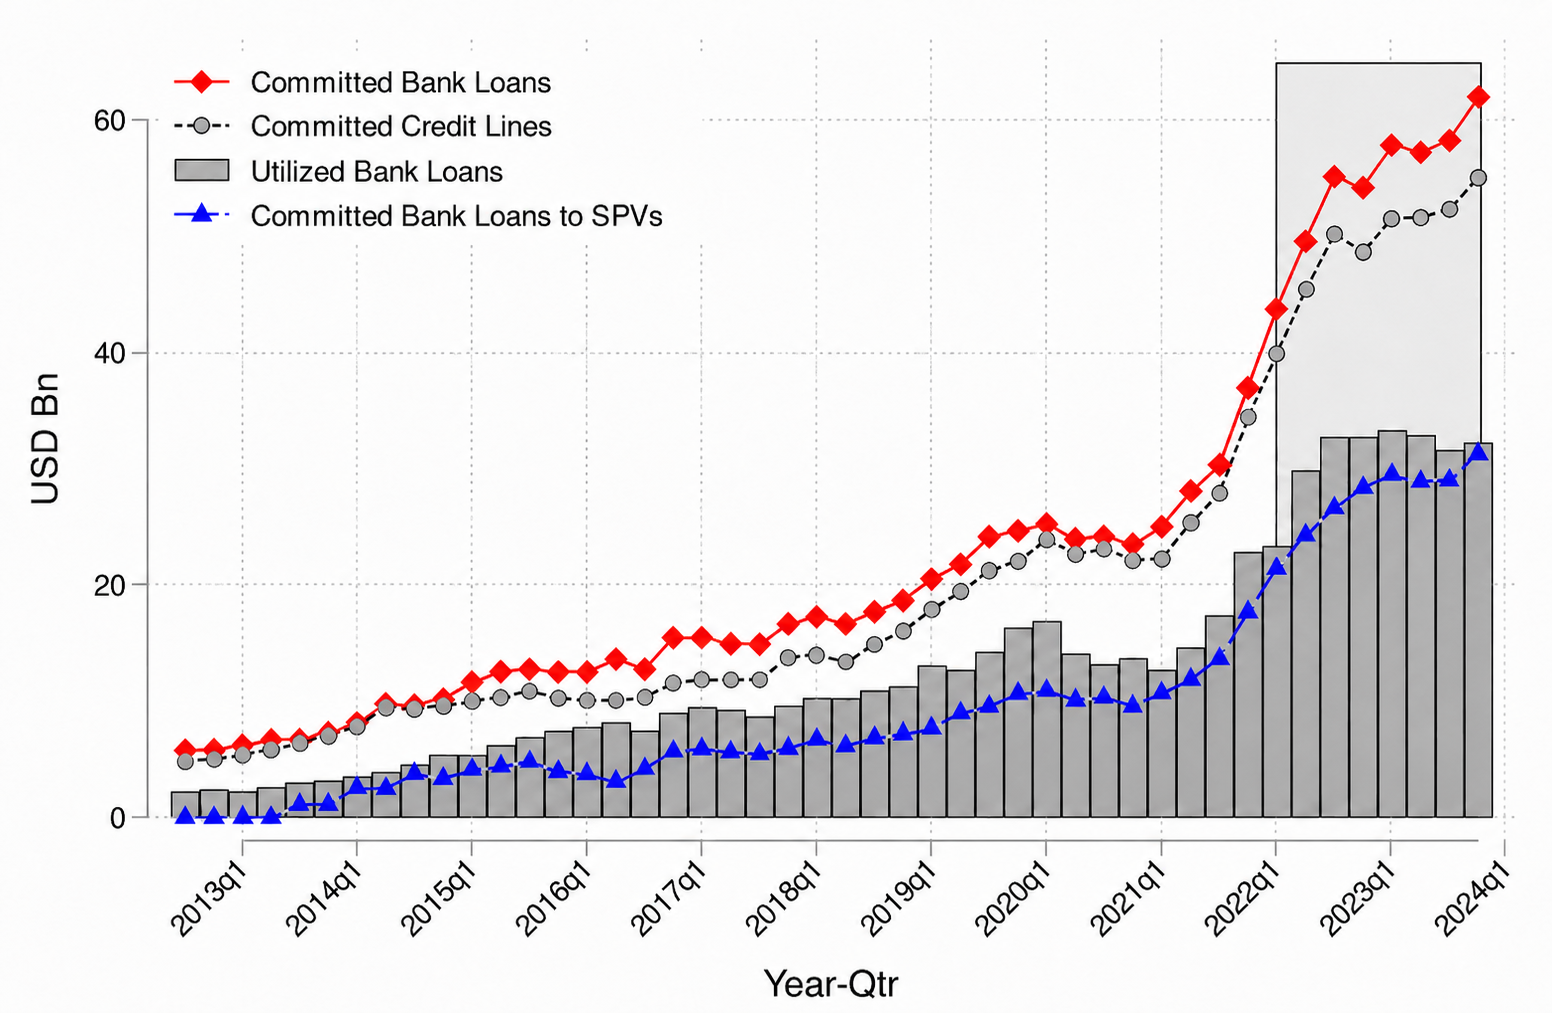
Source: FR Y-14Q Schedule H.1; LSEG Data & Analytics, BDC Collateral; authors' calculations.
The importance of bank funding also appears on BDC balance sheets. Bank loans now make up about 40 percent of BDC debt on average, up from about 20 percent a decade ago and close to 50 percent at the 2022 peak.
During the 2022 tightening cycle, BDCs also shifted their financing mix toward bank debt. Rather than expanding all external financing sources equally, BDCs relied increasingly on bank borrowing relative to equity and nonbank debt, especially bonds. This shift is consistent with bank credit lines becoming a more important source of flexible funding as external financing conditions became less favorable. Consistent with this shift, BDC bond issuance declined markedly after mid-2022 and remained subdued through 2023, according to Mergent FISD, while average net bank debt issuance was more than twice net equity issuance and nearly six times net bond issuance.
This pattern highlights a key point: banks are not simply being displaced by private credit. Instead, they increasingly provide liquidity to private credit vehicles, shifting from direct lending to firms toward upstream funding of nonbank lenders. The 2022 monetary tightening cycle provides a useful setting to study this relationship because external financing conditions tightened while BDCs continued to rely on bank credit lines. The next section examines this relationship more formally at the loan level and asks whether bank funding to BDCs came at a higher price during tightening.
4. The Price of Bank Funding During Tightening
The next fact concerns pricing. Bank loans to BDCs and non-BDC borrowers had broadly similar average rates before the tightening cycle. During the 2022 tightening, however, rates on BDC loans rose more sharply.
Figure 2 shows the time-series pattern in bank loan rates. Before 2022, average rates on loans to BDC and non-BDC borrowers moved closely together. During the 2022 tightening cycle, both series rose sharply, but the rate on BDC loans increased more and remained above the rate on loans to non-BDC borrowers. This widening gap motivates the regression analysis using granular data in Table 1.
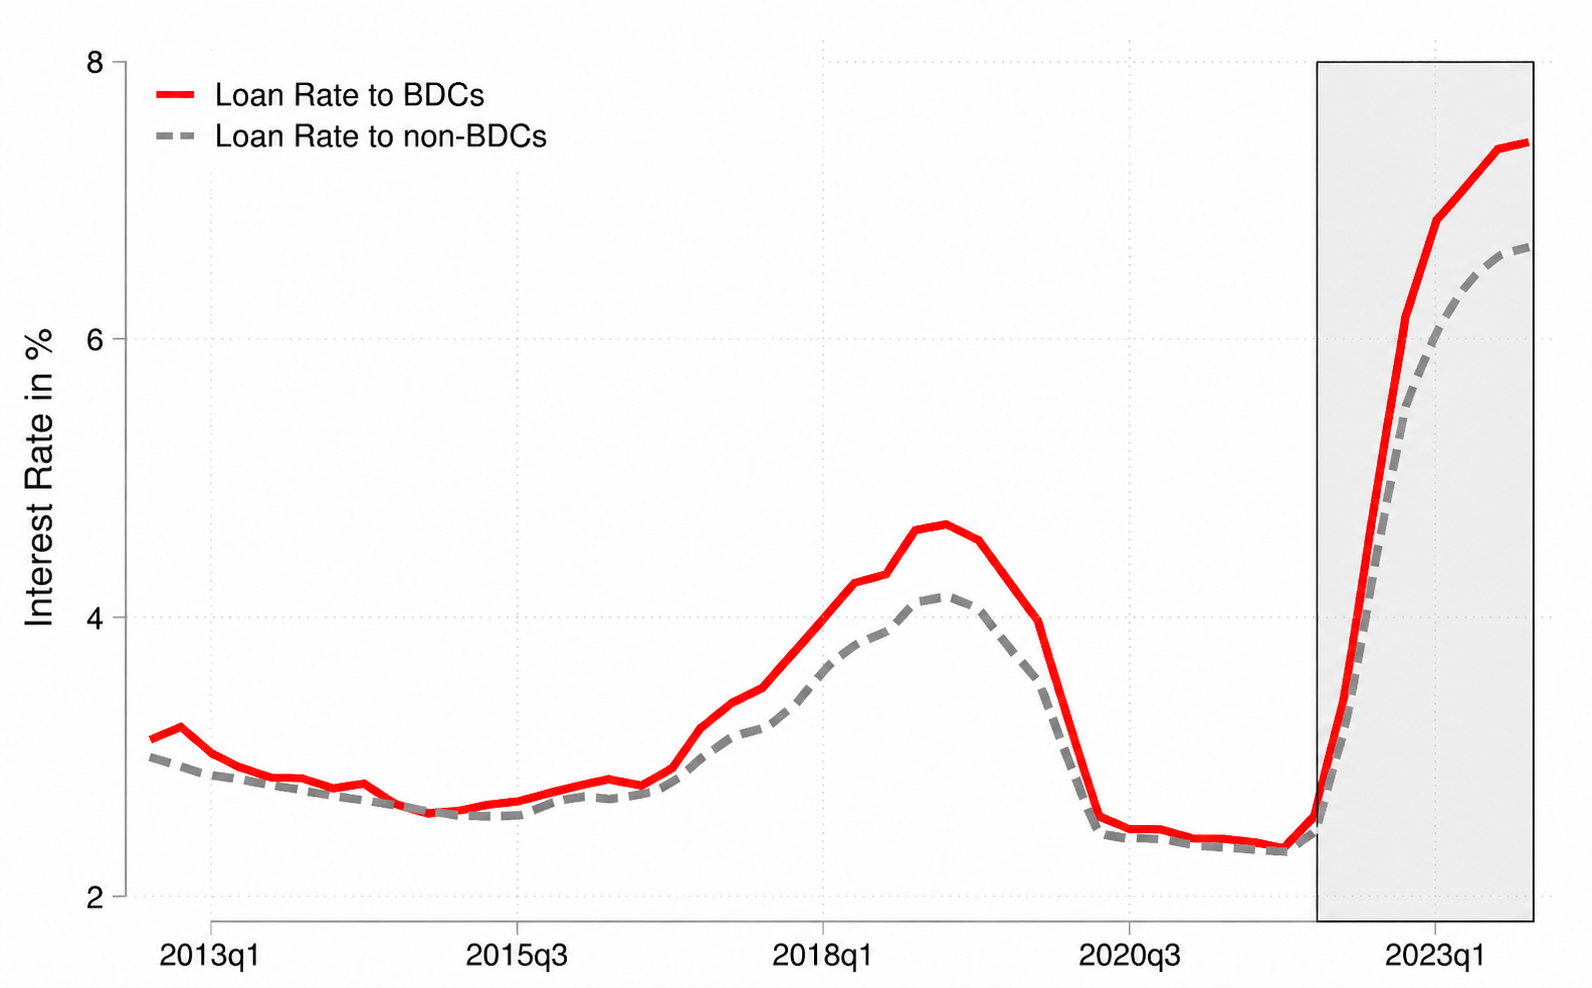
Source: FR Y-14Q Schedule H.1; LSEG Data & Analytics, BDC Collateral; authors' calculations.
Table 1. Regression Results: Bank Lending to BDCs During Monetary Tightening
| Dependent variable | Loan commitment growth | Credit-line utilization | Interest rate |
|---|---|---|---|
| BDC × Tightening | 0.011** | 0.142*** | 0.009*** |
| (0.004) | (0.027) | (0.002) | |
| BDC | 0.001 | 0.044** | 0.002** |
| (0.003) | (0.019) | (0.001) | |
| Lagged borrower controls | Yes | Yes | Yes |
| Bank × credit rating × quarter fixed effects | Yes | Yes | Yes |
| Number of observations | 3,653,826 | 1,712,362 | 3,468,670 |
Notes: The sample period is 2012Q3–2023Q4, and the data are at the bank–borrower–quarter level. Tightening is an indicator equal to 1 during the 2022 monetary tightening cycle (2022Q1–2023Q4) and 0 otherwise. BDC is an indicator equal to 1 if the borrower is a BDC and 0 otherwise. Loan commitment growth is the log change in loan commitments between bank and borrower from t−1 to t, expressed as a decimal. Credit-line utilization is the ratio of utilized to committed credit-line amounts. Interest Rate is the utilized-amount-weighted average interest rate across all loans between bank and borrower in quarter t, expressed as a decimal. Credit Rating denotes the lending bank's internal credit rating, which is bank-specific and time-varying and captures the bank's ex ante assessment of borrower credit risk. Firm-level controls enter the regressions with a one-period lag and include bank-estimated probability of default, expected loss, share of term loans in total bank debt, share of credit lines in total bank debt, and the natural log of total bank debt. Standard errors are double-clustered at the bank × borrower and year-quarter levels. *, **, and *** denote statistical significance at the 10, 5, and 1 percent levels, respectively.
Source: FR Y-14Q Schedule H.1; LSEG Data & Analytics, BDC Collateral; authors' calculations.
Table 1 compares bank lending to BDCs with bank lending to other borrowers during the 2022 tightening cycle. The regressions are estimated at the bank–borrower–quarter level and include lagged borrower controls and bank × internal credit rating × quarter fixed effects. These fixed effects compare lending by the same bank, in the same quarter, to BDC and non-BDC borrowers with the same internal credit rating. This design helps control for bank-specific funding conditions, time-varying lending standards, and borrower risk as assessed by the lending bank. The key coefficient is BDC × Tightening, which captures how lending to BDCs changed during tightening relative to otherwise comparable borrowers.
The results show a quantity-and-price pattern. During tightening, loan commitments to BDCs grew by 1.1 percentage points more than commitments to other borrowers, and BDC credit-line utilization rose by 14.2 percentage points more, bringing the total utilization gap between BDC and non-BDC borrowers to 18.6 percentage points. Most importantly for this note, banks charged BDCs an additional interest-rate premium of about 0.9 percentage point during tightening, on top of the average BDC premium outside tightening periods. Taken together, the BDC interest-rate premium reached roughly 1.1 percentage points during the tightening cycle.
This premium is economically meaningful. It suggests that banks provided more credit to BDCs during tightening, but at a higher price. Because BDCs rely on bank credit lines to finance their own lending, this upstream funding cost can affect the rates that private credit borrowers ultimately pay.
5. The Pricing Puzzle: Higher Rates on Protected Claims
One natural explanation for the BDC premium is credit risk. BDCs lend to riskier middle-market firms, so banks may charge them more because they are indirectly exposed to the risk of BDC loan portfolios. But the evidence suggests that credit risk is not the explanation. Bank loans to BDCs are typically well protected: they are more likely to be collateralized and first-lien senior secured, and banks report lower loss-given-default estimates for BDC loans than for otherwise similar loans.
These protections become even more pronounced during tightening. We find that BDC loans were significantly more likely to be first-lien senior secured and collateralized during the tightening cycle, relative to otherwise similar bank loans. Banks also reported lower loss-given-default estimates for BDC loans, with no statistically meaningful increase in expected default probability. This combination—higher rates, senior claims, collateral protection, and lower loss-given-default estimates—suggests that the BDC premium is unlikely to reflect only compensation for credit risk.
Part of the premium may compensate banks for providing committed liquidity and balance sheet capacity. Credit lines are not ordinary loans: banks must stand ready to fund drawdowns, sometimes when market conditions deteriorate (Acharya, Gopal, Jager, and Steffen, 2024). However, in Haque, Jang, and Wang (2026), the BDC premium is not stronger for BDCs or bank–BDC pairs with greater observable liquidity-risk exposure. The evidence therefore suggests that another mechanism may also be at work: bargaining power in the upstream funding market.
6. A Concentrated Upstream Funding Market
The market for bank funding to BDCs is concentrated and relationship-based. Table 2 reports several aggregate measures of concentration in bank lending to BDCs and compares them with bank lending to nonfinancial firms. For utilized lending to BDCs, the top three banks account for almost half of the market, the top five account for about two-thirds, and the top ten account for more than 80 percent. Concentration is also high when measured using committed amounts: the top three banks account for more than 40 percent of committed lending to BDCs, the top five account for nearly 60 percent, and the top ten account for more than 80 percent. These top-share measures are higher for BDC lending than for lending to nonfinancial firms, and the Gini coefficients show the same pattern. The Gini coefficient is 0.78 for utilized BDC lending, compared with 0.66 for utilized lending to firms. These statistics indicate that the upstream market for BDC funding is concentrated among a relatively small set of banks, regardless of whether one measures credit by commitments or actual drawdowns.
Table 2. Market Concentration in Bank Lending to BDCs
| Metric | Bank to BDC | Bank to nonfinancial firms | ||
|---|---|---|---|---|
| Committed amount | Utilized amount | Committed amount | Utilized amount | |
| Top 3 share (%) | 42.76 | 47.07 | 38.97 | 38.03 |
| Top 5 share (%) | 59.4 | 64.75 | 54.64 | 54.12 |
| Top 10 share (%) | 82.47 | 84.65 | 71.8 | 71.01 |
| Gini coefficient | 0.76 | 0.78 | 0.67 | 0.66 |
Source: FR Y-14Q Schedule H.1; LSEG Data & Analytics, BDC Collateral; authors' calculations. The statistics are calculated among Y-14 reporting banks after aggregating lending by bank over 2012Q3–2023Q4.
Figure 3 benchmarks this concentration against the broader market for bank lending to nonfinancial firms. The figure plots Lorenz curves, with the cumulative share of banks on the horizontal axis and the cumulative share of lending based on utilized lending amounts on the vertical axis. If lending were evenly distributed across banks, the curve would lie on the 45-degree line. Instead, both curves lie below that line, indicating concentration. The key comparison is that the curve for bank lending to BDCs lies farther below the equality line than the curve for lending to nonfinancial firms. This means that BDC funding is more concentrated not only in absolute terms, but also relative to the broader corporate lending market.
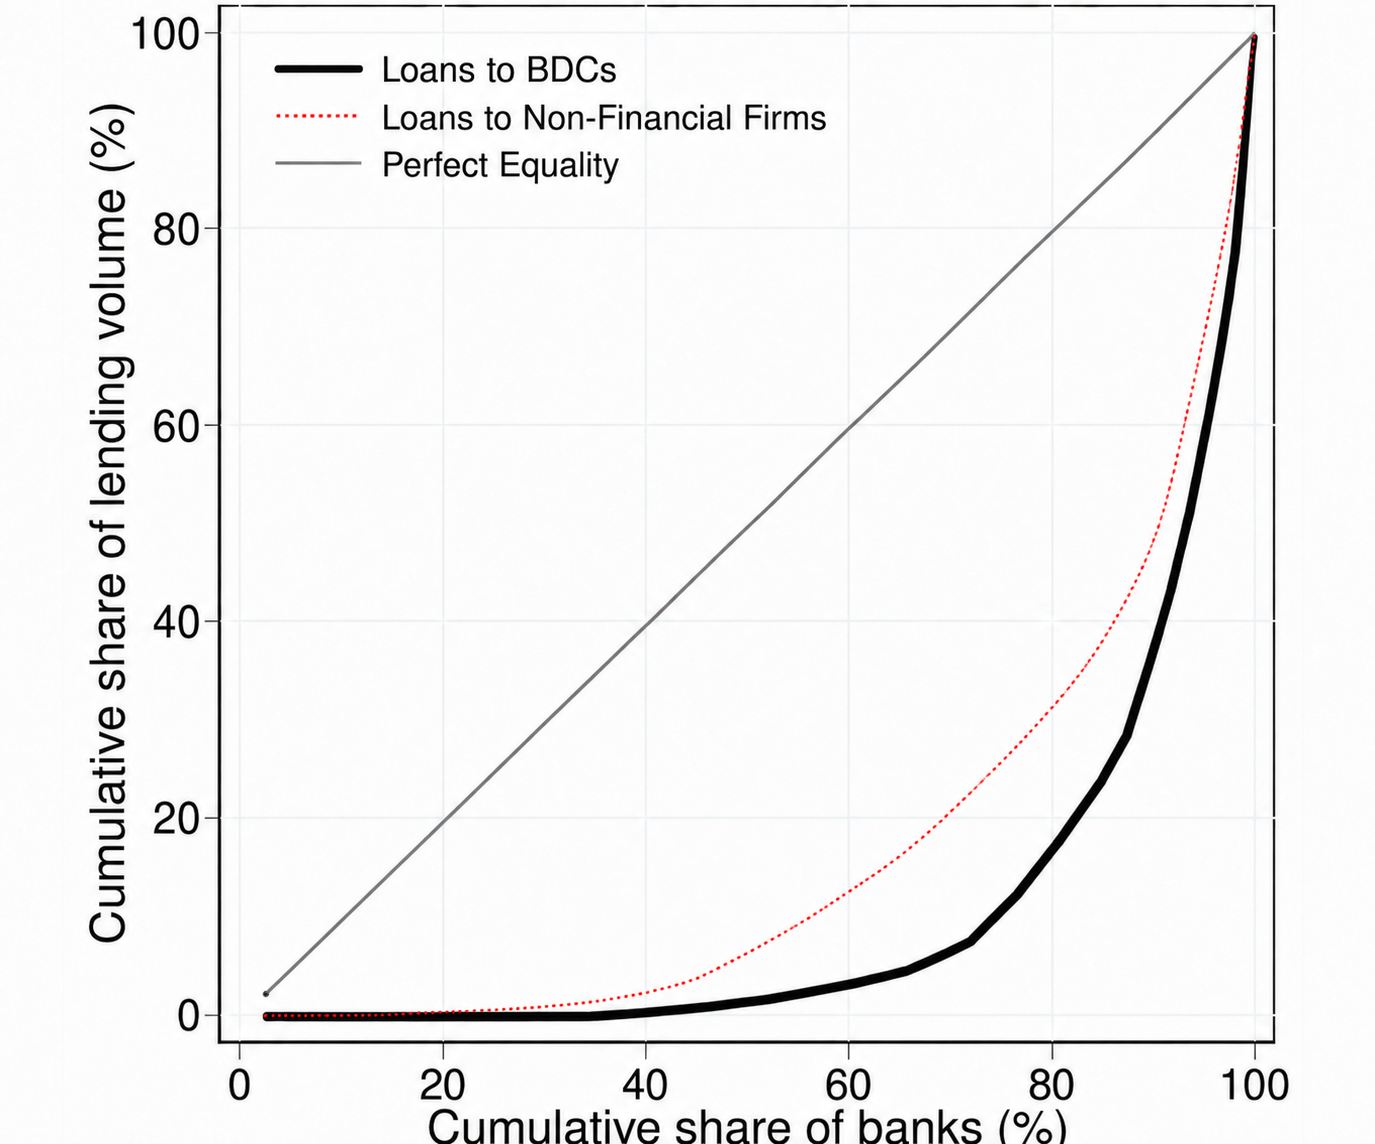
Source: FR Y-14Q Schedule H.1; LSEG Data & Analytics, BDC Collateral; authors' calculations.
Market concentration is especially relevant because bank–BDC relationships are persistent. Figure 4 plots the fraction of outstanding BDC bank loans that represent bank switches. Following Dempsey and Faria-e Castro (2025), a loan is classified as a switch if it is newly originated and the BDC has not had a lending relationship with the originating bank during the previous four quarters. The switching rate is low throughout most of the sample, indicating that BDCs rarely change bank lenders.
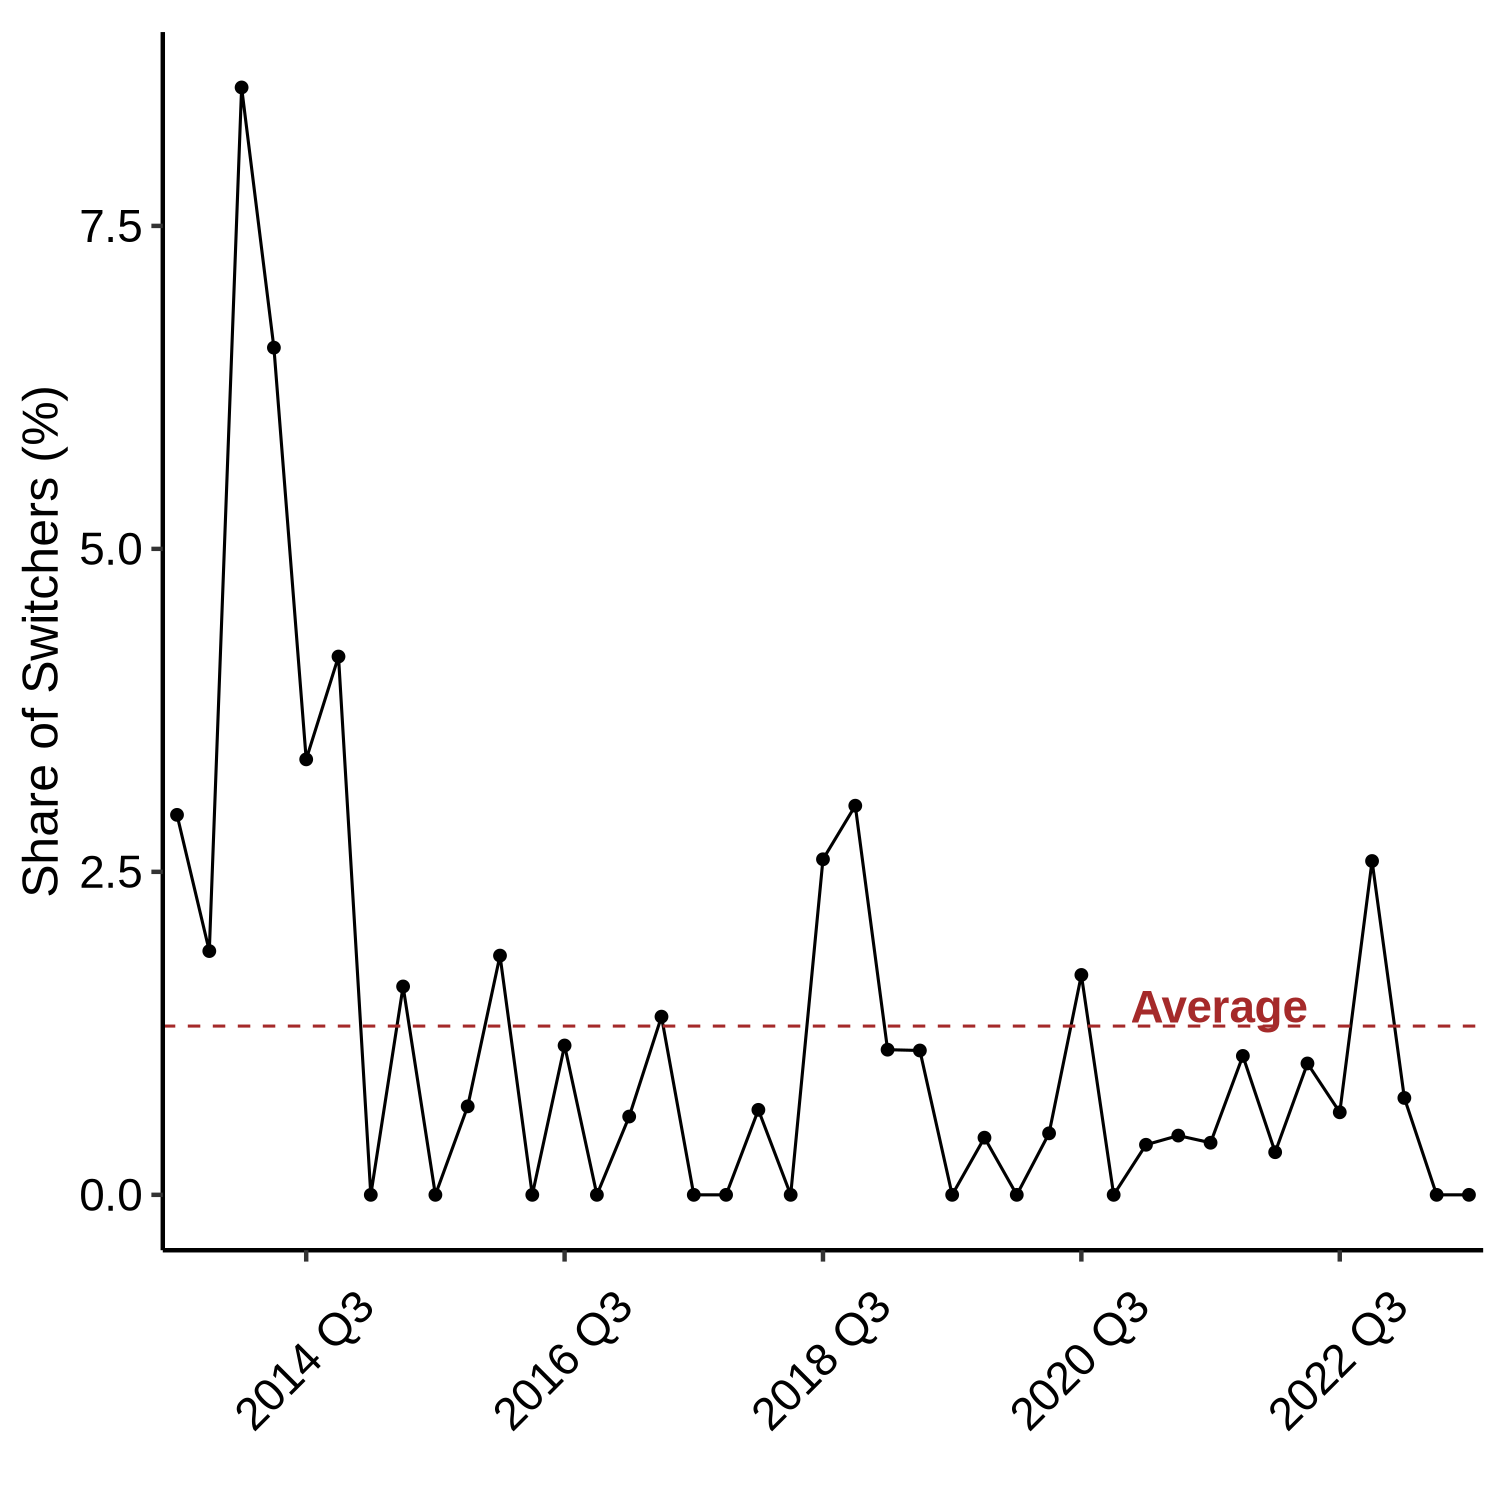
Source: FR Y-14Q Schedule H.1; LSEG Data & Analytics, BDC Collateral; authors' calculations.
This persistence matters for pricing. Much of the expansion in bank credit to BDCs occurs through renegotiation of existing credit lines rather than new loan origination. In these renegotiations, incumbent banks are naturally positioned to bargain over both credit limits and loan pricing. When BDC demand for bank funding rises during monetary tightening, relationship frictions may limit effective competition and strengthen incumbent banks' bargaining position.
Taken together, the evidence suggests that bank financing to BDCs occurs in a concentrated, relationship-based market. The higher interest rates charged to BDCs during tightening are therefore unlikely to reflect only compensation for credit risk. Instead, they are consistent with bargaining power in the upstream funding market while banks hold senior, collateralized, and relatively well-protected claims. This mechanism is consistent with Jiang (2023), who shows that banks can exercise pricing power over intermediary borrowers that depend on bank funding in mortgage markets. The setting here is different: BDCs channel bank funding to middle-market borrowers rather than mortgage borrowers. But the economic intuition is similar. When a nonbank lender depends on a concentrated set of banks for upstream funding, the price of that funding can shape downstream credit conditions.
A natural question is why banks do not instead charge similar markups directly to the middle-market firms that ultimately borrow from BDCs. The distinction is that the market power discussed here operates upstream, in the market for funding BDCs, rather than downstream, in the market for lending to firms. BDCs have specialized expertise in originating, monitoring, and restructuring middle-market loans, and they compete with other lenders for borrowers. By contrast, banks provide funding to BDCs in a more concentrated upstream market characterized by persistent lending relationships. These features may allow incumbent banks to extract rents from intermediary borrowers, especially when BDC demand for committed funding rises during tightening.
7. Implications
These findings have three implications. First, private credit should not be viewed as fully outside the banking system. Even when banks do not lend directly to the final borrower, they may fund the private credit vehicle that does. This means that the rise of private credit can shift banks' role from direct lenders to upstream liquidity providers.
Second, the price of bank funding matters for private credit. If banks charge BDCs more during tightening, and BDCs pass those costs on to firms, monetary policy can still transmit through private credit markets even when private credit volumes remain resilient. In the full paper, we show that this bank–BDC–firm credit chain supports credit supply during tightening but shifts monetary transmission from the quantity margin toward the price margin by raising borrowing costs relative to direct bank credit.
Third, concentration in upstream funding markets deserves attention. A small set of banks provides a large share of BDC funding, and BDCs rarely switch lenders. These relationships may make bank credit lines a stable source of liquidity, but they may also give incumbent banks pricing power when demand for committed funding rises.
8. Conclusion
Private credit has grown rapidly, but its growth does not mean banks have disappeared from credit intermediation. In the BDC market, banks remain important upstream liquidity providers. They supply credit lines that BDCs use to fund lending to firms, especially during monetary tightening. This note documents that BDCs' reliance on bank credit has increased, that banks charge BDCs a funding premium during tightening, and that bank funding is supplied through a concentrated, relationship-based market. These facts suggest that the price of private credit is shaped not only by the risk of firms borrowing from BDCs, but also by the structure and pricing of the bank funding behind BDCs.
For a fuller analysis of the bank-BDC-firm credit chain and its implications for monetary policy transmission, see Haque, Jang, and Wang (2026).
References
Acharya, Viral V., Manasa Gopal, Maximilian Jager, and Sascha Steffen. 2024. "Shadow Always Touches the Feet: Implications of Bank Credit Lines to Non-Bank Financial Intermediaries."
Acharya, Viral V., Nicola Cetorelli, and Bruce Tuckman. 2024. "Where Do Banks End and NBFIs Begin?" National Bureau of Economic Research Working Paper.
Berrospide, Jose, Fang Cai, Siddhartha Lewis-Hayre, and Filip Zikes. 2025. "Bank Lending to Private Credit: Size, Characteristics, and Financial Stability Implications." FEDS Notes. Board of Governors of the Federal Reserve System.
Cai, Fang, and Sharjil Haque. 2024. "Private Credit: Characteristics and Risks." FEDS Notes. Board of Governors of the Federal Reserve System, February 23.
Chernenko, Sergey, Robert Ialenti, and David S. Scharfstein. 2025. "Bank Capital and the Growth of Private Credit." Working paper.
Chernenko, Sergey, Isil Erel, and Robert Prilmeier. 2022. "Why Do Firms Borrow Directly from Nonbanks?" Review of Financial Studies 35(11): 4902–4947.
Davydiuk, Tetiana, Tatyana Marchuk, and Samuel Rosen. 2024a. "Direct Lenders in the U.S. Middle Market." Journal of Financial Economics 162.
Davydiuk, Tetiana, Tatyana Marchuk, and Samuel Rosen. 2024b. "Market Discipline in the Direct Lending Space." Review of Financial Studies 37(4): 1190–1264.
Degerli, Ahmet, and Phillip Monin. 2024. "Private Credit Growth and Monetary Policy Transmission." FEDS Notes. Board of Governors of the Federal Reserve System.
Gabriel, Ricardo Duque, and Julianna Sterling. 2025. "Shifting Dynamics in Bank Funding of NBFIs: The Rise of Credit Lines." FEDS Notes. Board of Governors of the Federal Reserve System.
Haque, Sharjil, Young Soo Jang, and Jessie Jiaxu Wang. 2026. "Indirect Credit Supply: How Bank Lending to Private Credit Shapes Monetary Policy Transmission." Working paper.
Dempsey, Kyle and Miguel Faria e Castro, 2025. "A quantitative theory of relationship lending," Journal of Financial Economics, 170, 104083.
Jiang, Erica Xuewei. 2023. "Financing Competitors: Shadow Banks' Funding and Mortgage Market Competition." Review of Financial Studies 36(10): 3861–3905.
Li, Jian, Yiming Ma, Caterina Mendicino, and Dominik Supera. 2026. "Bank to Non-Bank Lending and the Reallocation of Credit." ECB Working Paper No. 3220.
Xu, Chi. 2025. "The Value of Contingent Liquidity from Banks to Nonbank Lenders." The Wharton School Research Paper.
Haque, Sharjil, and Jessie Jiaxu Wang (2026). "The Price of Bank Funding Behind Private Credit: Evidence from Business Development Companies," FEDS Notes. Washington: Board of Governors of the Federal Reserve System, August 7, 2026, https://doi.org/10.17016/2380-7172.4142.
Disclaimer: FEDS Notes are articles in which Board staff offer their own views and present analysis on a range of topics in economics and finance. These articles are shorter and less technically oriented than FEDS Working Papers and IFDP papers.