


FEDS Notes
October 14, 2026
The Rise of Semiliquid Funds for Retail Investors
Logan George and Chaehee Shin
1. Introduction
Investment funds differ in how investors can access their capital. The redemption rules governing how and when investors can withdraw have evolved endogenously in response to shifting investor demand and regulatory constraints. While the immediate liquidity of open-end mutual funds and exchange-traded funds has long dominated the retail market, the landscape has been evolving over time. Asset managers are reportedly pivoting toward retail capital in private markets as, among other factors, some institutional investors such as pension funds and endowments may be reaching their target allocation limits for private markets.1 However, because retail investors generally demand greater liquidity than institutional investors, managers have developed vehicles that invest heavily in private markets while offering liquidity through periodic repurchases. Understanding these retail funds is critical as this changing investor base might significantly alter market dynamics and the broader supply of credit to the real economy.
In this note, we study the main vehicles driving the growth of retail investors in private markets: the so-called "semiliquid" vehicles. These are funds that invest in illiquid assets while offering investors periodic, albeit constrained, redemption opportunities. We compare their redemption and liquidity design, leverage and portfolio requirements, and portfolio composition. Our analysis highlights several findings. First, semiliquid funds for retail investors have expanded rapidly since 2018. Second, private credit exposure in interval funds, in particular, has been expanding significantly and now represents nearly half of total interval fund net assets. Finally, we draw on insights from mutual fund literature and historical parallels to examine the key implications of this growth of retail investors in private markets.
2. Growth and Types of Semiliquid Funds
In this note, we examine the three most prominent types of semiliquid funds: interval funds, tender offer funds, and non-traded perpetual-life business development companies (BDCs).2 As closed-end structures, all three vehicles are not bound by the 15% illiquid asset cap that restricts traditional open-end mutual funds; this enables higher exposure to more illiquid assets.3
Interval and tender offer funds most closely resemble traditional mutual funds in that they are continuously offered and priced at net asset value (NAV) under the Investment Company Act of 1940 framework designed for pooled investment vehicles. However, while traditional mutual funds are open-ended structures providing daily redemptions, these semiliquid funds only offer periodic redemptions, enabling investment in illiquid assets including private credit, private equity, real estate, and hedge fund strategies.
Non-traded perpetual-life BDCs are under distinct BDC provisions within the Investment Company Act that were designed for lending to private companies. These vehicles primarily invest in middle-market private credit and have become an important avenue through which retail investors access direct lending markets. While finite-term non-traded BDCs also exist, they represent a small and declining portion of the market and are not included in this analysis. For brevity, we refer to the dominant perpetual-life vehicles simply as "non-traded BDCs" throughout this note. We also exclude publicly traded BDCs, which constitute a significant portion of the BDC market, because their exchange listing provides daily liquidity in the secondary market and thus places them outside our definition of semiliquid funds. Throughout this note, interval funds, tender offer funds, and non-traded BDCs refer to distinct legal structures under the Investment Company Act. While many non-traded BDCs use periodic share repurchase programs that provide liquidity features similar to those of interval or tender offer funds, our classification is based on the legal structure of the vehicle rather than its specific redemption mechanism. Accordingly, references to these different types of funds in this note refer to those legal structures, even when their liquidity features overlap.
Figure 1 shows the rapid expansion of these three vehicles. Total net assets increased from $15 billion in 2018 to $388 billion in 2025, as asset managers increasingly orient their fundraising toward retail investors. For comparison, total mutual fund net assets grew only by 33% during the same period, highlighting the disproportionate momentum within the semiliquid space.
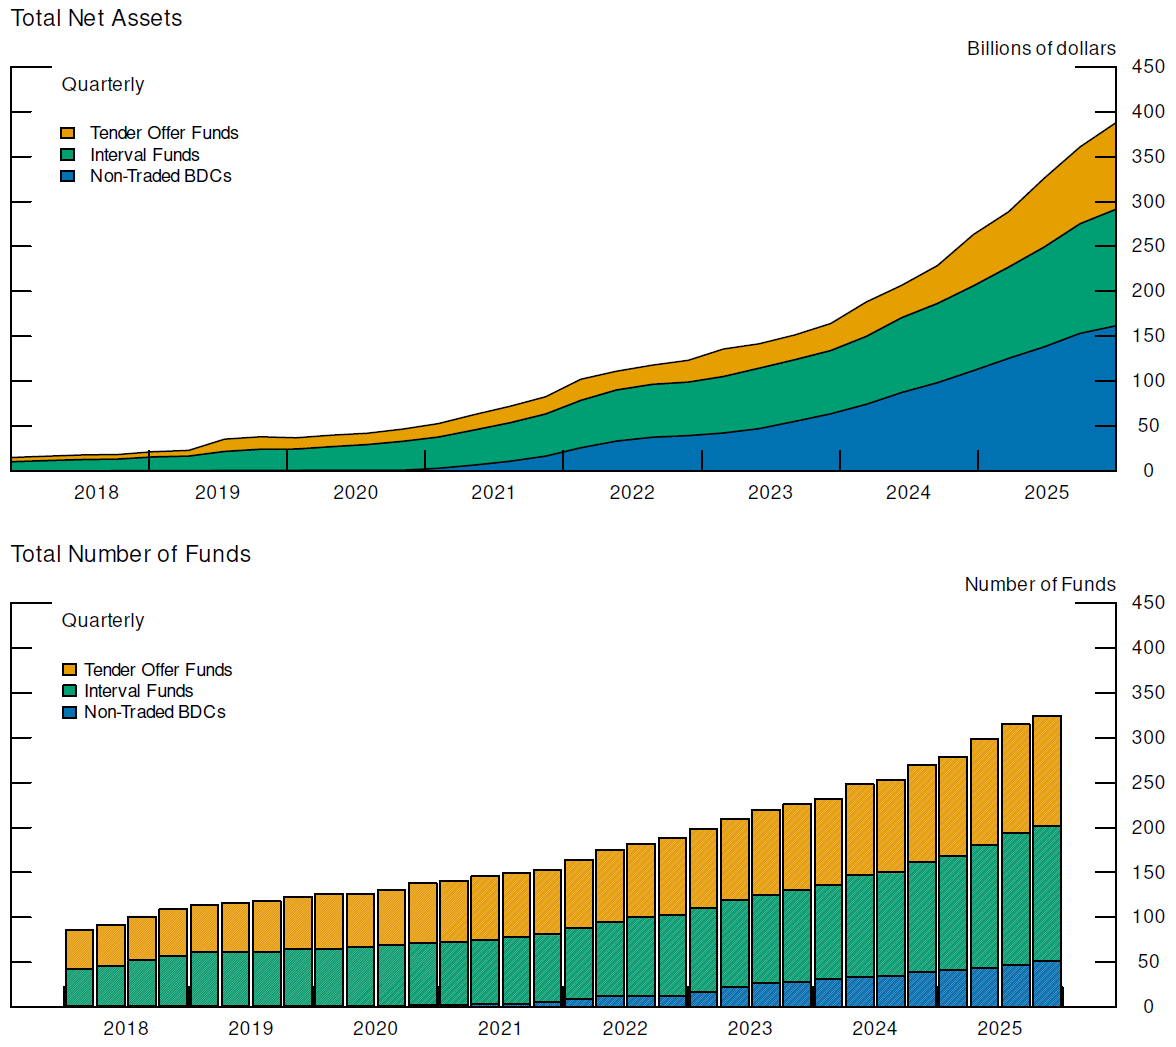
Note: The top chart plots total net assets (total assets under management minus total debt) of each vehicle type. Total AUM for non-traded BDCs was approximately $307B as of 2025Q4. For interval and tender offer funds, this chart provides a lower bound estimate of total fund net assets due to exclusion of some funds with missing total net asset data in Morningstar. The first non-traded perpetual-life BDC appears in our sample in 2018, and all values are reported through 2025Q4. Key identifies the series in order from top to bottom.
Source: Morningstar and LSEG Data & Analytics BDC Collateral.
While these three fund types serve as the primary conduit for retail capital into private markets through perpetual, closed-end structures, they differ in how liquidity is designed and governed. Table 1 summarizes their distinct characteristics.
Table 1: Comparison of Semiliquid Funds for Retail Investors
| Interval Funds | Tender Offer Funds | Non-Traded Perpetual-Life BDCs | |
|---|---|---|---|
| Fund Structure | Closed-end, perpetual | Closed-end, typically perpetual | Closed-end, perpetual |
| Subscription Frequency | Daily (or monthly) in general | Monthly (or quarterly) in general | Monthly (or quarterly) in general |
| Liquidity for Investors | Periodic liquidity at pre-specified intervals (typically quarterly; may be 1, 3, 6, or 12 months)6; legally required | Periodic liquidity at board-determined, discretionary intervals (typically quarterly; may be 1, 3, 6, or 12 month intervals)7 | Periodic liquidity at standardized intervals (mostly quarterly; some monthly) |
| Redemption | Fund must repurchase at least 5%, up to 25% of shares at each interval (typically 5%) | Offer amount is at full discretion of the board | Fund may repurchase up to a capped amount at each interval (typically 5% of NAV per quarter, often with an annual cap); may be modified/suspended |
| NAV | Daily or weekly, with mandatory daily calculations during the five business days preceding a repurchase deadline | Periodic (often monthly); only requires a NAV calculation at the time of a tender offer | Periodic (often monthly or quarterly); no specific frequency is mandated |
| Asset Limit | None | None | 70% must be "eligible" portfolio companies (mostly private firms) |
| Portfolio Liquidity Requirements | Must maintain full liquidity for a repurchase offer only during offer period, with no such requirement at other times | No requirements even during offer period | None |
| Leverage Requirements | Leverage limits of 300% asset coverage for debt / 200% for preferred stock | Leverage limits of 300% asset coverage for debt / 200% for preferred stock | Leverage limits of 150% asset coverage for debt (if elected; otherwise, 200%)8 |
| Access | Broadly open to retail investors, subject to (relatively low) minimum investments; available on brokerage platforms | Typically limited to accredited investors and qualified clients, subject to higher minimum investment; distributed through private wealth channels | Available to retail investors but subject to suitability requirements9 and (relatively low) minimum investments; distributed through private wealth channels |
The most important difference lies in how liquidity is managed. Interval funds provide structured, pre-committed liquidity by mandating share repurchases at set periods, mostly quarterly. Although tender offer funds typically provide similar quarterly repurchases, they offer more constrained liquidity since boards maintain full discretion over the timing, frequency, and size of those offers. Non-traded BDCs lie in between: although many offer quarterly share repurchases, these programs are typically subject to caps (typically around 5% of NAV per quarter) and may be curtailed, making liquidity somewhat predictable yet constrained.
These different liquidity designs directly inform the varying valuation and liquidity requirements across the three fund types. Interval funds are mandated to maintain the tightest link between NAV and investor transactions, while the other two can operate with fewer formal constraints. Furthermore, only interval funds are subject to a liquidity mandate tied to repurchase offers; however, they are only required to maintain full liquidity for the amount offered during the specific repurchase period, with no such requirements at any other time.4
Leverage and investment constraints differ according to the regulatory regime. Interval and tender offer funds follow the standard 1940 Act limits, whereas BDCs operate under specialized provisions that allow greater leverage, if elected, and impose portfolio restrictions consistent with direct lending.
Finally, interval funds are the most broadly accessible of the three types, with relatively low investment minimums and availability on many retail brokerage platforms. In contrast, tender offer funds and non-traded BDCs are typically restricted retail vehicles distributed only through private wealth channels. These funds involve more intermediated and screened participation as they are generally limited to accredited investors or qualified clients.5 However, some BDCs also offer retail share classes with relatively low minimum investments.
3. Holdings and Liquidity of Semiliquid Funds
We use three datasets to obtain detailed fund-level information, including portfolio holdings, on these three types of semiliquid funds. For interval and tender offer funds, we match the Morningstar universe of these vehicles with SEC Form N-PORT filings, which have detailed fund-level information on portfolio holdings and characteristics. As of 2025Q4, our final sample comprises 207 funds, representing approximately 84% of the total net assets reported by Morningstar for these categories.10 For the holdings information on non-traded BDCs, we use LSEG's BDC Collateral, which covers 52 non-traded BDCs.
Table 2 describes the cross-sectional summary statistics of these funds in our sample. The average interval fund and tender offer fund have $882 million and $876 million, respectively, in total net assets, with leverage ratios—defined as debt over equity—of 0.27 and 0.09, respectively. In contrast, non-traded BDCs are substantially larger, with average total net assets of $3.1 billion and with a higher average leverage ratio of 0.9, consistent with their regulatory allowance to use greater leverage than registered investment funds.
Table 2: Cross-Sectional Summary Statistics of Semiliquid Funds in Our Sample, as of 2025Q4
| Interval Funds | Tender Offer Funds | Non-Traded BDCs | ||
|---|---|---|---|---|
| Number of Funds | 136 | 71 | 52 | |
| Total Net Assets | Average | $882 Mil | $876 Mil | $3,111 Mil |
| Median | $207 Mil | $220 Mil | $740 Mil | |
| Leverage | Average | 0.27 | 0.09 | 0.90 |
| Median | 0.09 | 0.04 | 0.90 | |
Note: Due to data limitations for interval and tender offer funds, we approximate debt-to-equity ratios using total liabilities divided by net assets. Because total liabilities may include non-debt obligations, this measure should be interpreted accordingly as an upper-bound estimate of borrowing leverage, for interval and tender offer funds. "Average Leverage" is an equally weighted average across the sample of funds. Asset-weighted average leverage yielded similar results.
Source: SEC Form N-PORT, LSEG Data & Analytics BDC Collateral, and Morningstar.
Table 3 shows the aggregate portfolio composition of the semiliquid funds as of 2025Q4.11 Interval funds have a heavy concentration in private credit which accounts for nearly half (49.5%) of total holdings.12 In addition, they maintain a broader debt-centric profile including 18.4% in asset-backed securities (ABS) and 12.6% in debt securities. Non-traded BDCs are even more concentrated on private credit, with loans comprising 93.4% of the portfolios, reflecting their specialized direct lending mandate.
Table 3: Aggregate Portfolio Composition of Semiliquid Funds, as of 2025Q4
| Interval Funds | Tender Offer Funds | Non-Traded BDCs | |
|---|---|---|---|
| Asset-Backed Securities | 18.4% | 6.8% | 1.0% |
| Debt Securities | 12.6% | 8.70% | 0.1% |
| Equity | 6.2% | 12.2% | 3.7% |
|
Public |
0.5% | 0.4% | 3.1% |
|
Private |
5.8% | 11.8% | 0.6% |
| Loan | 55.3% | 13.4% | 93.4% |
|
Private Credit |
49.5% | 13.4% | 93.4% |
|
Syndicated |
5.8% | 0.0% | 0.0% |
| Real Estate | 0.6% | 0.3% | 0.0% |
| Repo | 0.3% | 0.0% | 0.0% |
| Short-term Liquid Assets | 3.0% | 8.8% | 0.2% |
| Other | 3.7% | 49.7% | 1.7% |
Note: This portfolio composition is aggregated, or, equivalently, value-weighted at the industry level. That is, rather than averaging fund-level ratios, we aggregate the values of each asset class across all funds to compute the total market-share composition. "Other" includes structured notes; indirect exposure to private markets through ownership stakes in hedge funds, direct infrastructure co-investments, and other private vehicles; holdings without asset class information, etc. Percentages may not sum to exactly 100% due to rounding.
Source: SEC Form N-PORT, LSEG Data & Analytics BDC Collateral, and Morningstar.
In contrast, tender offer funds prioritize a mix of equity and alternatives, allocating 13.4% to private credit and 12.2% to equity. This equity sleeve, held by all fund types, consists of direct holdings in public equity and private equity co-investments, although equity exposure remains small for interval funds and non-traded BDCs. The remainder of tender offer capital is in "Other" assets (49.7%), their largest category representing indirect exposure to private markets through ownership stakes in hedge funds and specialized private vehicles.
Along with the varying redemption design and regulatory requirements, portfolio allocation seems to affect how much liquidity these funds hold, as the nature of their underlying assets dictates the amount of necessary cash buffer. Because tender offer funds invest substantially in illiquid equity and alternatives, they maintain higher average short-term liquid assets of 8.8%—more than double the 3.0% held by interval funds—to ensure they can fund large capital calls and manage discretionary redemptions effectively. In contrast, interval funds have a greater focus on debt including private credit, which allows them to generate liquidity through steady interest and principal payments from these assets, despite their stricter, non-discretionary redemption schedules. Additionally, the reliance of interval funds on portfolio cash flow is supplemented by the regulatory safeguard described in Section 2. This safeguard requires interval funds to maintain 100% of the offer amount in highly liquid assets from the time a repurchase notice is sent until the NAV pricing date.13 Non-traded BDCs, by contrast, hold negligible cash buffers (0.2%) despite their even greater concentration in illiquid private credit, likely reflecting their reliance on portfolio cash flows, as well as their limited and discretionary share repurchase programs and the absence of regulatory liquidity requirements.
4. Private Credit Investment by Semiliquid Funds
Given the heightened focus on private credit by the academics and regulators in recent years, we further zoom into the growth of private credit allocation by semiliquid funds. Figure 2 illustrates the time-series evolution of aggregate portfolio allocations to private credit, by fund type. Since BDCs are structurally concentrated in corporate direct lending to portfolio companies due to regulatory requirements, this figure focuses only on interval and tender offer funds. The elevated private credit exposure of interval funds reported in Table 3 reflects a substantial and sustained expansion in recent years. While both interval and tender offer funds maintained comparable exposure of around 20% to private credit at the beginning of the sample period, private credit holdings by interval funds have climbed to nearly half of total net assets by 2025. In contrast, tender offer funds have shown a more constrained appetite for private credit, at around 13% of their portfolio holdings, most recently.
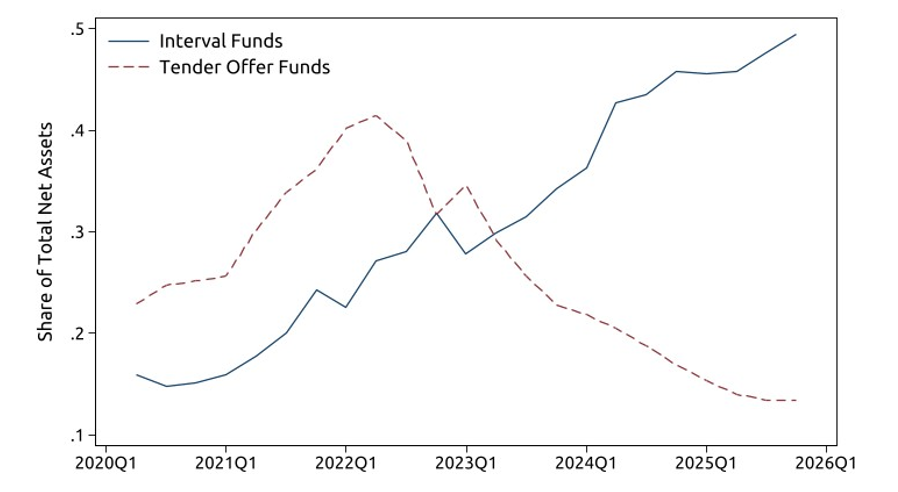
Source: N-PORT and Morningstar. A phased regulatory compliance period for N-PORT began in 2019Q3 and finished in 2020Q2, which is the first reporting quarter that contains the full universe of filers.
The composition of underlying holdings differs substantially across fund types. Table 4 compares holding-level characteristics of private credit investment. Interval funds and tender offer funds hold loans with an average size of about $9.3 million and $5.2 million respectively. The lower median size of private credit holdings reflects specialty finance including consumer and small-business loans (other than middle-market corporate direct lending). Non-traded BDCs hold much larger positions than the previous two fund types, with an average size of $43.1 million, reflecting their focus on directly originated middle-market loans.
Table 4: Holding-Level Characteristics of Private Credit Invested by Semiliquid Funds, as of 2025Q4
| Interval Funds | Tender Offer Funds | Non-Traded BDCs | ||
|---|---|---|---|---|
| Size | Average | $9,321,028 | $5,246,982 | $43,104,778 |
| Median | $4,881,615 | $3,170,514 | $36,970,905 | |
| Remaining Maturity (Days) | Average | 1,601 | 1,942 | 1,717 |
| Median | 1,647 | 1,581 | 1,620 | |
| Annualized Rate | Average | 7.3% | 8.7% | 8.5% |
| Median | 6.9% | 6.7% | 8.4% | |
| %Default | Average | 0.6% | 2.4% | 1.4% |
| Median | 0.0% | 0.0% | 1.6% | |
Note: "Size" is measured in balance for interval and tender offer funds, and in fair value for non-traded BDCs. Averages and medians are calculated by taking the average value for each fund and computing either a weighted average using fund total net assets as weights or a median across funds. "%Default" reflects default status for interval and tender offer funds and non-accrual status for non-traded BDCs, due to differences in data availability.
Source: SEC Form N-PORT and LSEG Data & Analytics BDC Collateral.
The maturity and interest rate profiles of all fund types are broadly similar, with average remaining maturities of around 4-5 years and annualized rates around 7-9%. Again, default rates differ with tender offer funds exhibiting a higher share of defaulted loans, likely due to their large exposure to specialty finance.
5. The Rise of Retail Participation in Private Markets: Key Implications
As previously shown, semiliquid funds take distinct strategies by pairing specific redemption technologies with their specialized portfolio choices to provide retail access to illiquid markets. This semiliquid approach departs from the longstanding institutional framework that fund managers have traditionally navigated, which relies on stable capital lock-ups. This section draws on established literature in mutual funds and past episodes to discuss key implications of the retail sector's rapid expansion in private markets through these vehicles.
In the mutual fund literature, the relative run propensity of retail versus institutional investors has long been debated. A pivotal contribution to this literature is Goldstein, Jiang, and Ng (2017), who show that asset illiquidity increases flow sensitivity to poor performance primarily in retail-oriented funds. They attribute this effect to retail investors' greater coordination problems because redemption decisions are dispersed across many small investors who respond to common signals, making collective outflows more likely. This greater susceptibility to coordination failure may translate into a higher propensity for runs among retail investors.
A long-standing body of empirical literature in mutual funds has also examined how retail participation is frequently driven by sentiment and visibility rather than underlying fundamentals. Sirri and Tufano (1998) find that investors disproportionately flow into funds with high media profiles, a media effect that Kaniel and Parham (2017) confirm is not necessarily driven by new informational content. Similarly, Barber and Odean (2008) demonstrate that individual investors act as net buyers of attention-grabbing stocks, specifically those appearing in the news or experiencing extreme returns. This systemic herding can cause prices to deviate from underlying fundamentals, as shown by Barber, Odean, and Zhu (2008), while Frazzini and Lamont (2008) find that such high retail sentiment often predicts low future returns, effectively characterizing these flows as "dumb money."
These findings from the mutual fund literature suggest that similar forces, including sentiment-driven flows and herding, can operate in semiliquid funds as retail participation expands. However, unlike mutual funds where these forces lead to immediate outflows, runs in semiliquid funds emerge as redemption queues when investor withdrawal requests exceed a fund's pre-set repurchase limit. Such dynamics were evident in early 2026, when several large private credit managers faced elevated redemption requests on their retail vehicles that exceeded existing repurchase limits, resulting in prorated withdrawals and unfulfilled redemption requests being carried forward.14 These episodes provide some evidence that liquidity management tools—including redemption caps, portfolio cash flows, and committed credit facilities—may absorb moderate stress, although their performance under a more severe and prolonged market-wide stress has yet to be further established.
Runs at non-traded Real Estate Investment Trusts (REITs)—another type of semiliquid funds—also illustrated how these dynamics play out and how long they take to resolve in practice. Between 2022 and 2024, major private REITs experienced a spike in redemption requests that could not be met with cash on hand and imposed gating, thereby restricting withdrawals despite the solvency of the underlying assets.15 The trigger of these runs was generally attributed to a valuation lag; as the public REIT prices plummeted in response to rising interest rates, private REIT valuations adjusted more gradually, leading retail investors to anticipate future NAV declines and accelerating redemption requests. These runs took months or years to resolve through aggressive asset sales and fresh capital infusions.
Taken together, these insights suggest that as more retail investors participate, the supply of private market funding may become more procyclical. Unlike traditional limited partner (LP) funds that use fixed, long-term capital, these retail vehicles grow or shrink based on investor behavior and market conditions. As Feroli et al. (2014) show in the context of bond funds, such sentiment-driven flows can create feedback loops that amplify market volatility. Furthermore, because resolving redemption requests can be a lengthy process, as seen from the case of REITs, the flow of credit to private companies might become less stable.
Finally, compounding these dynamics is the opacity of private asset valuations, a key friction in private markets. Private assets, including private credit loans, are largely non-traded, which prevents the availability of a continuous, market-based signal of their value. In practice, valuations are produced internally, relying on fund manager models and judgment rather than observable transaction prices, granting managers meaningful discretion. This limited price transparency can weaken the credibility of valuations and make them more susceptible to shifts in sentiment. To the extent that valuations of private assets adjust more slowly than public benchmarks, periods of market stress can also create perceived mispricing, potentially reinforcing the sentiment-driven flows and strengthening incentives for early redemption. Recent research highlights the need for greater transparency and risk monitoring, especially as retail investors gain exposure to the asset class (Aldasoro, Doerr, and Todorov (2025); IMF (2024)).
6. Conclusion
The rapid growth of semiliquid funds reflects an evolution in how investors access private markets, as asset managers increasingly adapt redemption design to accommodate retail investors. Interval funds, tender offer funds, and non-traded BDCs offer distinct approaches to balancing illiquid investments with varying degrees of investor liquidity. As retail participation expands, these vehicles may shape how capital flows into private markets and how credit supply responds over the cycle. Recent policy developments have focused attention on broadening retail access to private markets. For example, a recent executive order directs regulators to make it easier for 401(k) plans to include private market instruments.16 The potential scale of this shift is huge, as defined contribution plans in the US hold over $13.9 trillion in assets as of Sep. 2025 ($10 trillion in 401(k) plans).17 As the retail access evolves, its implications for private markets remain an important area for future research.
References
Aldasoro, Iñaki, Sebastian Doerr, and Karamfil Todorov. 2025. "Retail Investors in Private Credit." BIS Bulletin No. 106. Basel: Bank for International Settlements, July 9.
Barber, Brad M., Terrance Odean, and Ning Zhu. "Do retail trades move markets?." The Review of Financial Studies 22, no. 1 (2008): 151-186.
Barber, Brad M., and Terrance Odean. "All that glitters: The effect of attention and news on the buying behavior of individual and institutional investors." The Review of Financial Studies 21, no. 2 (2008): 785-818.
Frazzini, Andrea, and Owen A. Lamont. "Dumb money: Mutual fund flows and the cross-section of stock returns." Journal of Financial Economics 88, no. 2 (2008): 299-322.
Goldstein, Itay, Hao Jiang, and David T. Ng. "Investor flows and fragility in corporate bond funds." Journal of Financial Economics 126, no. 3 (2017): 592-613.
Kaniel, Ron, and Robert Parham. "WSJ Category Kings–The impact of media attention on consumer and mutual fund investment decisions." Journal of Financial Economics 123, no. 2 (2017): 337-356.
Feroli, Michael, Anil K. Kashyap, Kermit L. Schoenholtz, and Hyun Song Shin. "Market tantrums and monetary policy." Chicago Booth Research Paper 14-09 (2014).
International Monetary Fund (IMF). "The Rise and Risks of Private Credit." Chapter 2 in Global Financial Stability Report, (2024).
Sirri, Erik R., and Peter Tufano. "Costly search and mutual fund flows." The Journal of Finance 53, no. 5 (1998): 1589-1622.
1. See "Private Credit Begins Sacrificing Secrecy to Draw in Retail Cash," Bloomberg, October 23, 2025; "Blackstone Moves to Extend Its Reach Into Everyday Investors' Portfolios," Wall Street Journal, April 15, 2025; "Moody's Flags Risks From Retail Investors' Push Into Private Credit," Reuters, June 10, 2025; "Increasing Retail Client Exposure to Private Capital Investing," Deloitte, April 24, 2025. Return to text
2. In this note, we intentionally exclude non-traded real estate investment trust (REIT), another important semiliquid vehicle that invests in illiquid real estate assets and offers periodic redemptions subject to limits, to focus on vehicles primarily engaging in private credit and equity mandates. Return to text
3. The SEC's Liquidity Risk Management Rule (Rule 22e-4) prohibits open-end funds from investing more than 15% of their net assets in illiquid investments to ensure they can meet daily redemption obligations without significant price impact. Return to text
4. Rule 23c-3(b)(10)(i) dictates that from the time a repurchase notice is sent until the NAV pricing date, an interval fund must maintain 100% of the offer amount in highly liquid assets. Return to text
5. Under SEC Rule 501, "accredited investors" are individuals with an annual income exceeding $200,000 ($300,000 for a household) or a net worth above $1 million (excluding primary residence), among other criteria. Under Rule 205-3 of the Advisers Act, "qualified clients" are defined as individuals with at least $1.1 million under management with the adviser or a net worth exceeding $2.2 million. Return to text
6. Under the Investment Company Act of 1940 Rule 23c-3, interval funds may supplement their regular schedule with one discretionary repurchase offer every two years. Return to text
7. Under Securities Exchange Act of 1934 Rule 13e-4. Return to text
8. Following the 2018 Small Business Credit Availability Act, BDCs may elect to lower asset coverage from 200% to 150% (with board or shareholder approval), effectively increasing maximum leverage. Return to text
9. Suitability requirements are constraints imposed by the broker-dealer or the fund based on an investor's income and net worth, as well as limits on how much of their wealth can be invested (often, no more than 10%). Return to text
10. Some funds are missing total net asset data in Morningstar. Return to text
11. We restrict our sample to long-only, non-derivative positions denominated in or convertible to USD and reported in principal amount. On N-PORT, we identify private credit in interval and tender offer funds by isolating loans that are classified as Level 3 according to the fair value hierarchy and categorize loans that are classified as Level 2 as syndicated loans. On LSEG Data & Analytics BDC Collateral, we classify asset types via an iterative AI process that maps descriptive strings into private credit vs. syndicated loans, and public vs private equity, including manual validation to ensure accuracy. Return to text
12. For instance, see "Private Credit Doubles Down on Interval Funds for Main Street," Bloomberg, March 27, 2025. Return to text
13. Rule 23c-3(b)(10)(i). Return to text
14. "Trapped in Private Credit, Investors Wait to Pull Out $5 Billion," Bloomberg, Mar. 26, 2026; "Private-Credit Investors Are Cashing Out in Droves," The Wall Street Journal, Jan. 21, 2026. Return to text
15. "Blackstone's BREIT Highlights Looming Dangers of Private Funds," The Wall Street Journal, Dec. 12, 2022; "Facing Possible Cash Crunch, Giant Real Estate Fund Limits Withdrawals," The New York Times, May 23, 2024. Return to text
16. Executive Order 14330 (2025). Return to text
17. Release: Quarterly Retirement Market Data, Third Quarter 2025 | Investment Company Institute. Return to text
George, Logan, and Chaehee Shin (2026). "The Rise of Semiliquid Funds for Retail Investors," FEDS Notes. Washington: Board of Governors of the Federal Reserve System, October 14, 2026, https://doi.org/10.17016/2380-7172.4114.
Disclaimer: FEDS Notes are articles in which Board staff offer their own views and present analysis on a range of topics in economics and finance. These articles are shorter and less technically oriented than FEDS Working Papers and IFDP papers.