FEDS Notes
April 13, 2026
Wage and Income Growth Expectations Before, During, and After the Pandemic Period
Corinne Salter and Daniel Villar
1. Introduction
Inflation expectations are understood to play a crucial role in inflation dynamics and in the conduct of monetary policy. Recently, there has also been a renewed interest in the relationship between inflation expectations and wages. This is because wage expectations and wage outcomes are important for the transmission of inflation expectations to actual inflation. Hajdini et al. (2023) find that consumers' inflation expectations have only very limited pass-through into expectations of future wage growth, while Pilossoph and Ryngaert (2025) find that higher inflation expectations make workers more likely to search for a different job, likely in the hope of raising their wages and protecting their real income.
In this note, we look at the evolution of consumers' wage and income growth expectations before, during, and after the Covid-19 pandemic period, with a focus on the recent high-inflation and high-wage-growth period. As has been documented extensively (Hajdini et al., 2025), during this period, consumers' inflation expectations also rose substantially, before gradually receding and generally tracking the progress of actual inflation from 2021 to 2024. We look at whether consumers' expectations of their wage growth followed similar movements and tracked realized wage growth. Utilizing two surveys, we show that while price inflation, inflation expectations, and wage growth moved a lot, there was very little discernible movement in consumers' expectations about their future wage growth. These results raise the question of how workers and consumers form expectations about their own income, and why their wage expectations appear to underreact compared to inflation expectations. Given the importance of wages in the link between expectations and inflation, these patterns could be informative to evaluate theories of the role of expectations in inflation dynamics.
2. Data
We will present patterns on the evolution of both wage growth expectations and actual wage growth. We use two sources of data for expectations: the New York Fed's Survey of Consumer Expectations (SCE) and the University of Michigan Surveys of Consumers (UMSC).1 Both are monthly surveys that aim to capture a representative sample of the U.S. population. Respondents are asked about demographic characteristics and various aspects of their economic or financial situation, such as their employment status and income. They are also asked a large set of questions about their expectations of future changes both to their own situation and of the future evolution of the U.S. economy. Most importantly for our purposes, respondents are asked what they expect price inflation will be over the next twelve months, and how much their own wages will change.
In the SCE, respondents are asked about how much they expect their earnings will change if they stay in the same main job and work the same number of hours. This variable should therefore be understood as an expected change in hourly wage conditional on staying in the same primary job. The SCE also asks respondents to assign probabilities to different possible future realizations of inflation and wage growth, i.e. respondents provide a probability distribution of expected inflation and wage growth. This is in addition to asking for a point forecast for both inflation and wage growth.
The Michigan surveys capture the expected change in household income rather than individual hourly wages, asking respondents the percentage they expect their family income to increase or decrease over the next year. In this way, the Michigan measure will also capture the expected effect of possible job switching. In contrast to the SCE, the Michigan survey only asks for point forecasts. To keep results comparable between the two sources of data, our analysis of SCE data will focus on reported point forecasts. However, the patterns that we see are qualitatively similar if we were to use the implied mean forecast for each respondent, based on their reported probabilities.
We construct the actual wage growth data from the Current Population Survey (CPS) using the same methodology employed by the Federal Reserve Bank of Atlanta to create the Wage Growth Tracker (WGT). This captures individual growth in reported hourly wages over twelve months. We use the micro data provided by the Federal Reserve Bank of Kansas City's CADRE CPS data application tool to compute various summary statistics of wage growth. Other measures of wage growth are available, such as Average Hourly Earnings or the Employment Cost Index, and tend to be used to track wage growth in the U.S. However, we believe that the WGT statistics are most relevant in this case because they correspond to individuals' experienced wage growth (and not to growth in an average wage) and thus are more appropriate to compare with individuals' reported expectations of their own wage or income growth. At the same time, all measures of wage growth in the U.S. increased substantially in the post-pandemic period and followed a similar contour.
3. Results
In this section we present our findings on wage growth from the sources of data described above.
3.1. Comparison with Inflation Expectations
First, it is apparent that wage expectations do not move in sync with inflation expectations, as we show by comparing these two variables in the SCE and Michigan surveys. Figure 1 shows the winsorized means for inflation as well as for wage and income growth expectations. The winsorized mean is the mean calculated after setting the value of the observations above and below the top and bottom five percentiles of the distribution equal to the top and bottom fifth percentiles, respectively. This statistic thus reflects changes in the distribution of responses without remaining stuck at round numbers (like medians often do) and without being influenced by extreme outliers.2 Based on the SCE (Panel A), the winsorized mean measure of wage growth expectations has mostly fluctuated around a stable trend since 2013, without the stark and persistent changes observed in the winsorized mean measure of inflation expectations from the same survey. Inflation expectations surged during the Covid-19 pandemic and subsequently moderated, roughly following the path of actual inflation.
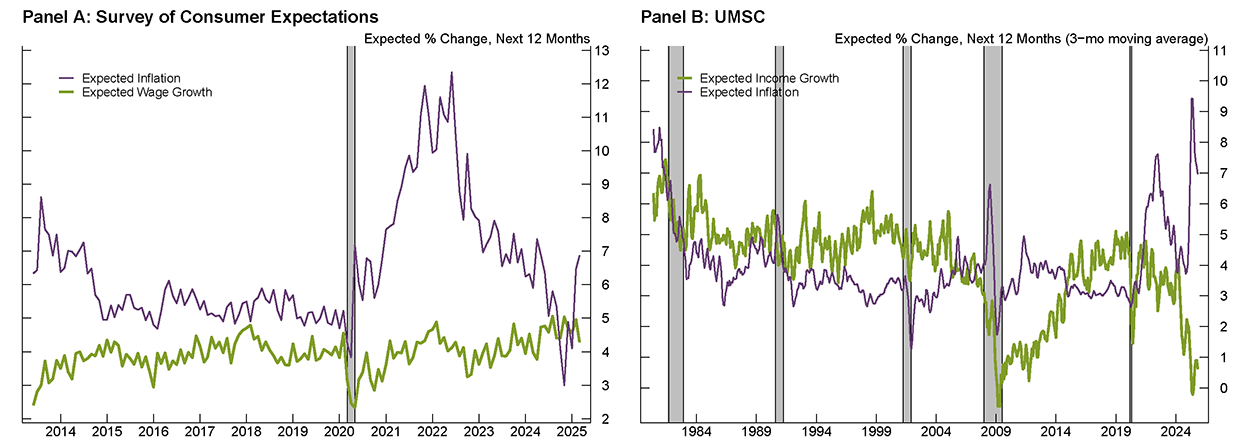
Note: Values shown are the authors' calculations of winsorized means. The shaded bars indicate the following periods of business recession as defined by the National Bureau of Economic Research (NBER): July 1981–November 1982, July 1990–March 1991, March 2001–November 2001, December 2007–June 2009, and February 2020–April 2020.
Source: Federal Reserve Bank of New York, University of Michigan.
Panel B of Figure 1 shows the Michigan survey measure. This series has a longer history, which makes it possible to see that income growth expectations were not stable prior to 2014. Indeed, they fell sharply during the Great Financial Crisis and only slowly increased during the recovery. Income growth expectations were also generally higher in the 1980's and early 90's, when inflation and nominal income growth were generally higher. The Michigan income growth series generally appears to be more cyclical than the SCE series. This could be because income growth expectations depend in part on the perceived probability of starting or losing a job and are thus more likely to move with the unemployment rate.3 In recent history, what stands out is the divergence between income growth and inflation expectations: the former fell substantially after the start of the pandemic while the latter surged. We also highlight that, in both survey measures, wage growth expectations do not seem to move with inflation expectations, instead following an independent trend.
Finally, Figure 2 shows the winsorized mean of the density mean forecast based on SCE respondents' expected probability distribution, for both future wage growth and future inflation. Figure 2 looks very similar to Panel A of Figure 1: it also shows little change in wage growth expectations, except for a short-lived dip in early 2020 at the start of the pandemic.
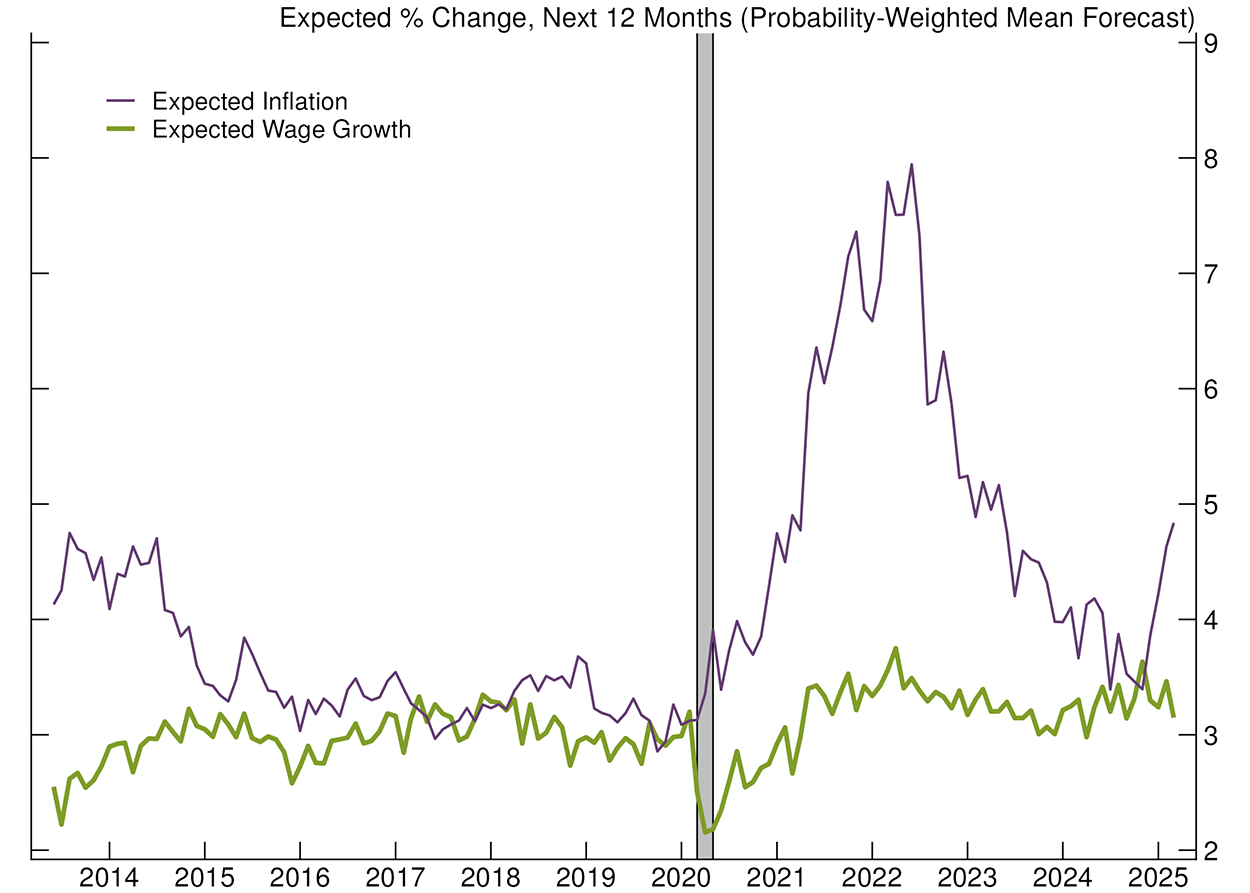
Note: Values shown are the authors' calculations of winsorized means. The shaded bar indicates the following period of business recession as defined by the National Bureau of Economic Research (NBER): February 2020–April 2020.
Source: Federal Reserve Bank of New York.
3.2. Comparison with Actual Wage Growth and Inflation
We now compare consumers' wage growth expectations to actual reported wage changes in the CPS as well as consumers' price inflation expectations to actual reported inflation—as measured by the Consumer Price Index. These comparisons make clear that, at least in the aggregate, wage growth expectations are not correlated with realized wage growth. Note that in this analysis the measurement of wage growth expectations and realizations is independent. In other words, the data for expectations and realizations are each from different samples of individuals (we analyze expectations and realizations that are matched at the individual level in the next sub-section). Also note that here, wage growth at month $$t$$ is measured between month $$t-12$$ and month $$t$$, while expected wage growth at month $$t$$ is an SCE respondent's forecast for what their wage growth will be between month $$t+12$$ and month $$t$$.4 Thus, we do not view the comparison between these series as having to do with forecast accuracy. Rather, we are interested in whether people take signal from recent wage growth in the overall economy for their expectations of future wage growth.
To illustrate the comparison, in Figure 3, we plot the winsorized means of expected and realized wage growth and inflation. This figure underscores the difference and lack of relationship between expected and realized wage growth. While realized wage growth moves frequently and with more volatility, expectations remain relatively stable, with small adjustments that do not align with the period or strength of realized wage growth. In contrast, the lines plotting expected and realized price inflation move together, with comparable size and direction of movement despite their difference in levels.
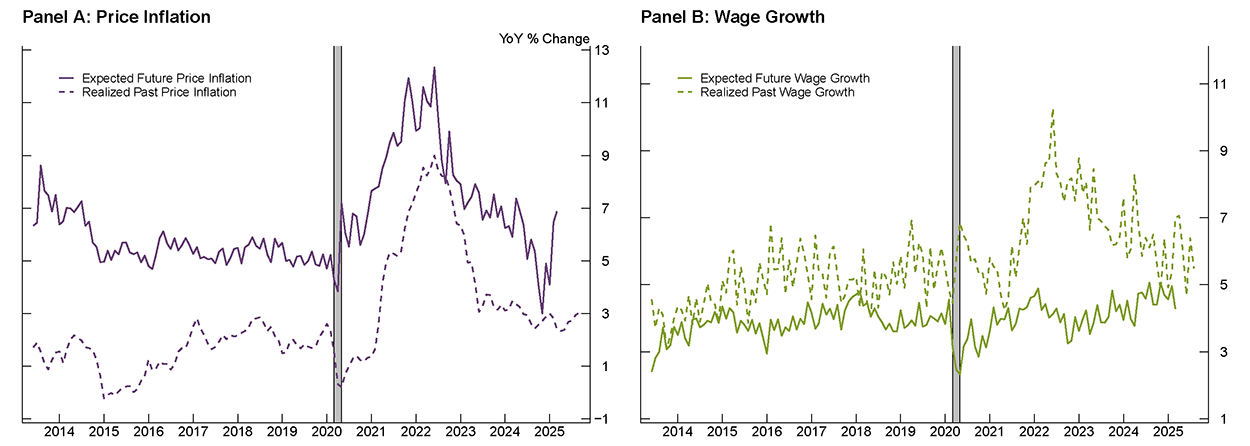
Note: Values shown are the authors' calculations of winsorized means. The shaded bar indicates the following period of business recession as defined by the National Bureau of Economic Research (NBER): February 2020–April 2020.
Source: Federal Reserve Bank of New York, Bureau of Labor Statistics.
What stands out the most in these comparisons is that while realized wage growth, on average, increased substantially in the post-pandemic period, there was no perceptible change in average wage growth expectations at any time during this period.5 This is in stark contrast to inflation, for which both the realization and expectations moved sharply and together.
To dig into the comparison between expected and realized wage growth in some more detail, Figure 4 shows various percentiles of the distribution of expected wage growth based on the SCE, and of actual wage growth as reported by the CPS. As with the winsorized means, realized wage growth shows more frequent fluctuations across both time and percentile groups than expected wage growth. Further, the (small) movements in the two measures are, again, not correlated. Additionally, the percentile groups for expected wage growth are more compressed than those of actual wage growth, with the distance between the 25th and 75th percentile lines for expected wage growth remaining about three percentage points over the observed period, while that of actual wage growth is between 15 and 20 percentage points.
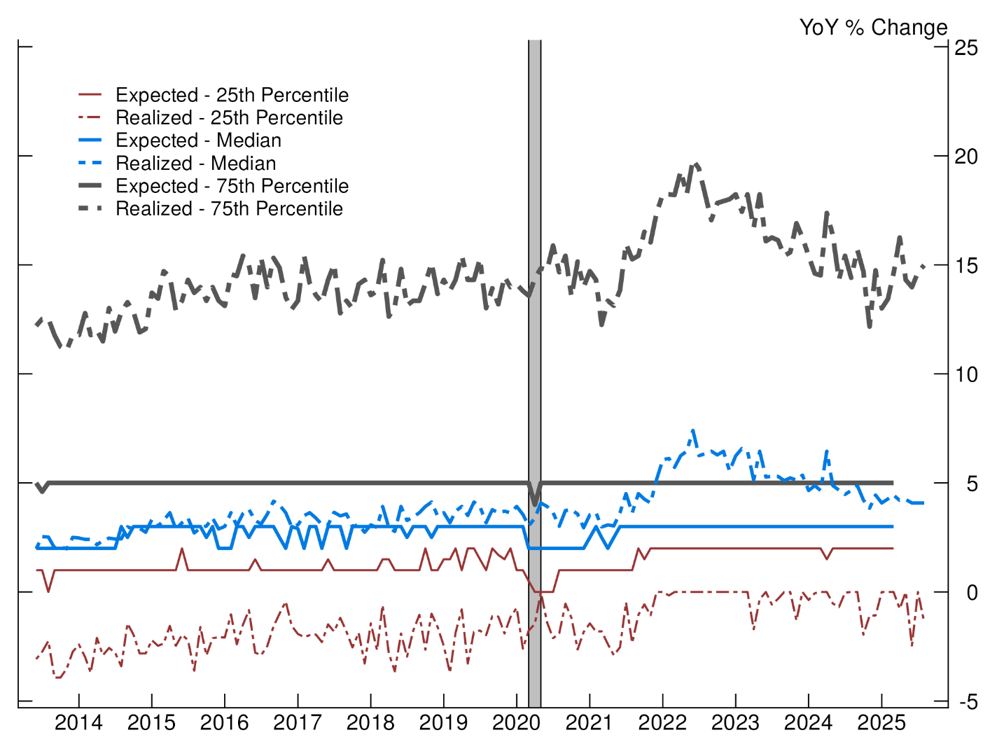
Note: The shaded bar indicates the following period of business recession as defined by the National Bureau of Economic Research (NBER): February 2020–April 2020.
Source: Federal Reserve Bank of New York, Federal Reserve Bank of Atlanta, Bureau of Labor Statistics.
3.3. Comparison with Individual Wage Growth
Finally, to look more closely at how connected wage growth expectations and realizations are, we study the relationship between an individual's wage growth expectations and subsequent personal wage or income growth. In Section 3.2 we showed that aggregate average wage growth expectations seem to have little connection with realized average wage growth. However, it is possible that individuals are informed about their own wage growth prospects in a way that gets obscured when focusing on averages. Here again, we find that expectations seem to have little predictive power for future realized wage growth, except possibly for very large wage changes.
To get at this relationship, we use the labor supplement to the SCE. This supplemental survey is fielded every four months and asks an additional set of questions (relative to the base survey) about the labor market, including the respondents' annual earnings from their main job. The SCE is a longitudinal survey, so some respondents take the labor supplement more than once. We can thus observe a change in reported earnings for these respondents, in addition to their wage expectations. The percent change in a household's reported income between their first and last response to the labor supplement is thus our constructed measure of individual wage growth.6 To our knowledge, the SCE is the only source of data that enables observing consumer expectations as well as a measure of own income growth in the U.S., and we believe that we are the first to explore this connection.
We run regressions of the following form:
$$$$ \Delta y_{it+1}=\beta E_{it}{\Delta w}_{t+1}+X_{it}+\ \epsilon_{it} $$$$
Where $$\Delta y_{it+1}$$ is our measure of realized income growth for an individual respondent, $$E_{it}{\Delta w}_{t+1}$$ is expected wage growth, and $$X_{it}$$ is a set of control variables. The main variable of interest on the right-hand side is that individual's reported expected wage growth the first time they answered the main SCE survey. Income growth is computed as the change in reported annual income between the first and last response to the labor supplement.7 The regression also includes individual inflation expectations and other controls (the perceived probability of losing one's job, and the perceived probability of finding a job if one were to lose one's job, to control for the respondent's optimism and pessimism).
Table 1 shows the coefficients from various specifications of the regression. The first column is the baseline, in which the coefficient on expected wage growth is significant and positive: individuals who expect higher wage growth tend to subsequently have a higher rate of reported income growth, with a "pass-through" of about one third. However, the second column shows the results for the same regression excluding individuals who report a very high rate of income growth (more than 50 percent). In this case, the coefficient on expected wage growth is slightly negative and insignificant. We interpret this to mean that there is little connection between expectations and realizations of income growth at low to moderate rates, but there is a connection when income grows substantially. In other words, individuals might be able to anticipate very large changes, such as a major promotion or a change to a much higher paying job. But outside these large changes, there is little evidence that what they expect for wage growth has predictive power for subsequent income growth.
Table 1: Individual Income Growth Regressions
Standard errors in parentheses
=* p<0.1 **p<0.05 ***p<0.01
| (1) | (2) | (3) | (4) | (5) | (6) | |
|---|---|---|---|---|---|---|
| $$\Delta Y$$ | $$\Delta Y$$ | $$\Delta Y$$ | $$\Delta Y$$ | $$\Delta Y$$ | $$\Delta Y$$ | |
| Eπ, point | 0.154*** | -0.086*** | 0.157*** | -0.087*** | ||
| (0.057) | (0.03) | (0.057) | (0.03) | |||
| E ΔW, point | 0.325*** | -0.077 | ||||
| (0.117) | (0.062) | |||||
| E ΔIncome | 0.164*** | -0.019 | ||||
| (0.06) | (0.032) | |||||
| Eπ, mean | 0.05 | -0.038 | ||||
| (0.103) | (0.058) | |||||
| E ΔW, mean | 0.008 | 0.148* | ||||
| (0.158) | (0.09) | |||||
| P(Lose job) | 0.031 | -0.055*** | 0.031 | -0.053*** | 0.028 | -0.054*** |
| (0.027) | (0.015) | (0.027) | (0.015) | (0.027) | (0.015) | |
| P(Find job) | -0.021 | 0.017** | -0.02 | 0.017** | -0.022 | 0.011 |
| (0.013) | (0.007) | (0.013) | (0.007) | (0.013) | (0.007) | |
| Observations | 6285 | 5835 | 6282 | 5832 | 6094 | 5664 |
| R2 | 0.005 | 0.008 | 0.005 | 0.008 | 0.001 | 0.006 |
| Sample | All | $$\Delta Y$$ < 50 | All | $$\Delta Y$$ < 50 | All | $$\Delta Y$$ < 50 |
Note: The dependent variable for these regressions is the estimate of individual income growth described in Section 3.3. The explanatory variables consist of combinations of individual expectations for inflation ($$E \pi$$), for wage growth ($$E \Delta W$$), or for income growth ($$E \Delta Income$$), and the perceived probability of either losing one’s job or finding a new job in the case of job loss. Some specifications exclude observations with actual income growth greater than 50 percent. An observation consists of an individual respondent to the SCE. The sample runs from March 2014 to April 2024.
Columns 3 and 4 show the same results but using expected household income growth instead of expected wage growth as the explanatory variable: the coefficient is positive and significant with the whole sample, and small and insignificant when excluding very large income changes.
Columns 5 and 6 use the probability distribution (density)-implied mean individual expectations for wage growth and inflation as explanatory variables, instead of the point forecasts. The pattern here is slightly different: under the full sample the coefficient on wage growth expectations is close to zero, and in the restricted sample it is positive, small, and marginally significant. The latter result could perhaps indicate that individual's perceived probability of high wage growth, which influences the density mean, might be informative about future wage growth at moderate levels.
Table 1 also shows that the sign and size of the coefficients on expected inflation are not robust across specifications. Neither are the coefficients on the perceived probability of losing and finding a job: these coefficients are as expected in the restricted sample, but insignificant in the full sample.
Finally, Figure 5 shows bin scatter plots that illustrate the relationship between expected and realized wage growth without controls. Panel A is based on the full sample, while Panel B excludes observations with realized income growth greater than 50 percent. We exclude these observations because we suspect that the associated expectations are informed by confirmed increases in pay from job switching or large raises and bonuses. In each panel, the blue dots use wage growth expectations as the expectations variable, while the orange hollow dots use household income growth expectations. These panels confirm the regression analysis: there is no clear relation between expectations and realizations. In the full sample, individuals with relatively high expectations do tend to see higher income growth on average, which is what the full sample regressions in Table 1 are capturing. However, in the restricted sample there seems to be an inverse-V shape: there is a positive relationship for the lowest values of expectations, but then a negative relationship.
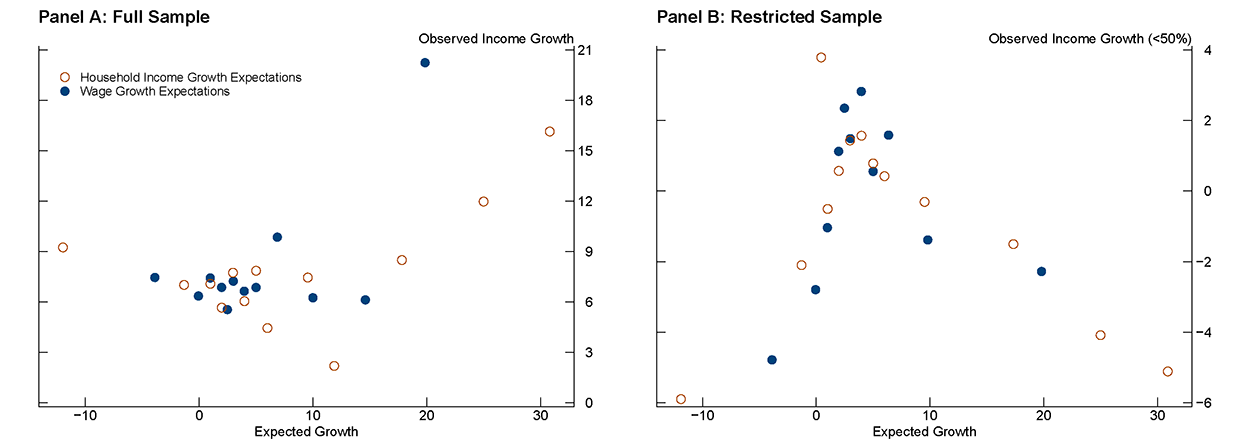
Note: This figure plots binned averages, where observations are grouped into equal-sized bins by the x-axis variable (expected wage or income growth), and each point shows the mean of both variables within that bin.
Source: Federal Reserve Bank of New York.
Overall, these results suggest that there is not a clear, robust relationship between expected wage growth and subsequent actual wage growth at the individual level. Although our measure of actual wage growth is imperfect and can be thought of as a proxy, we would still expect to find more robustly positive coefficients if individuals' wage growth expectations were closely tied to their actual prospects. Wage growth expectations, at least as reported in surveys such as the SCE, seem to have little discernible connection with actual wage growth.
4. Discussion and Conclusion
We have documented patterns related to the behavior of wage and income expectations that are relevant for policymakers and academics who pay attention to macroeconomic dynamics and inflation. We have highlighted the exceptional stability of wage and income growth expectations, especially in the post-pandemic period. This stability is notable and surprising given the movements in actual wage growth, which at least in the aggregate are uncorrelated with expectations, and the behavior of inflation expectations, which move much more and seems to respond to economic conditions. These patterns potentially reflect limited attention paid to wage growth trends in the economy. Other studies have documented similar patterns, but ours is, to the best of our knowledge, the first to do so for the U.S. using long-running surveys of consumers, and the first to explore the connection with actual wage growth. Lastly, we find that there is no predictive power of wage or price inflation expectations for future realized wage growth except for large changes. Overall, these findings lead us to question the mechanism through which inflation expectations are translated into realized inflation via wage growth expectations.
These findings have potentially important implications for monetary economics. Expectations are central to the determination of key aggregates such as inflation, the transmission of shocks, and the conduct of monetary policy. What does it mean that inflation and wage expectations behave so differently? More specifically, how does the behavior of wage expectations shape the role of inflation expectations in the economy? As an example of an interesting question raised by our findings: under what conditions can rising inflation expectations set off "wage-price spirals" if wage expectations seem to respond little to changes in conditions. Finally, our findings also raise the fundamental question of why wage and income growth expectations behave so differently from inflation expectations to begin with, and why they seem so disconnected from the behavior of actual wage gains. Exploring these and other questions could help shed light on how consumers form expectations about different variables, and how inflation and wages are jointly determined.
References
Binder, C. C. (2023). Nominal income expectations of consumers. Mercatus Center at George Mason University Working Paper.
Hajdini, I., Knotek E. S., Leer J., Pedemonte, M. Rich, R., Schoenle, R. (2023). Low passthrough from inflation expectations to income growth expectations: Why people dislike inflation. Federal Reserve Bank of Cleveland Working Paper No. 22-21
Hajdini, I., Shapiro, A. H., Smith, L. Villar Vallenas, D. (2025). Inflation since the pandemic: Lessons and challenges. Finance and Economics Discussion Series, 2025-070.
Pilossoph, L., Ryngaert, J. M. (2025). Job search, wages, and inflation. National Bureau of Economic Research Working Paper 33042.
1. Binder (2023) also looks at nominal income growth expectations in the Michigan survey and its evolution over time. However, that study focuses on the usefulness of income expectations to potentially inform monetary policy that targets nominal income growth and does not focus on comparisons with actual wage or income growth. Return to text
2. A significant share (in some cases, a majority) or respondents in any given period report round numbers for their wage growth and inflation expectations. As a result, percentiles of these measures tend to "bunch" at round numbers. For example, median wage growth expectations in the SCE are exactly 3 percent for the vast majority of months for which data are available. Return to text
3. Another difference between the two measures is that household income growth (which is measured in the Michigan survey) also depends on changes in the number of workers within a household. To the extent that this extensive margin is at play, it could drive a significant difference between household income growth and wage growth. Return to text
4. We focus on the SCE measure of wage growth expectations because they are more comparable to the wage growth that we can measure in the CPS. In contrast, the Michigan survey only has information on expected household income growth. Return to text
5. It is worth noting again that in the SCE, wage growth expectations are conditional on staying in the same job. Available evidence suggests that post-pandemic wage growth was especially high for job switchers (see, for example, Hajdini et al. (2025)). To the extent that wage growth was elevated because workers were moving to jobs with higher pay, it is to be expected that the SCE measure would not show an increase. However, wage growth among job stayers as measured in the CPS by the Atlanta Fed also increased significantly in the post-pandemic years. It is therefore still surprising that wage growth expectations remained so flat. Return to text
6. We consider this measure to be a proxy. We would ideally observe actual wages or hourly earnings, as changes in hours worked affect total earnings even if the hourly wage has not changed—this is why most of our previous analysis focuses on the SCE, which unlike the Michigan survey measures wage growth expectations. In addition, self-reporting likely introduces some measurement error. Still, we believe that this measure carries meaningful signal about true individual wage changes. Return to text
7. As a result, the change in income will be based on changes over 4, 8, or 12 months. Ideally, we would observe changes over twelve months in all cases, which would line up more closely with the question about expected wage growth. The fact that this is not the case adds some error to our measure. Also, this measure can only be computed for individuals who respond to more than one instance of the labor supplement, which significantly limits the size of the sample. Return to text
Salter, Corinne, and Daniel Villar (2026). "Wage and Income Growth Expectations Before, During, and After the Pandemic Period" FEDS Notes. Washington: Board of Governors of the Federal Reserve System, April 13, 2026, https://doi.org/10.17016/2380-7172.4038.
Disclaimer: FEDS Notes are articles in which Board staff offer their own views and present analysis on a range of topics in economics and finance. These articles are shorter and less technically oriented than FEDS Working Papers and IFDP papers.