FEDS Notes
September 01, 2021
What Did we Learn from 2 billion jabs? Early Cross-Country Evidence on the Effect of COVID-19 Vaccinations on Deaths, Mobility, and Economic Activity
Giuseppe Fiori and Matteo Iacoviello1
In the first five months of 2021, about two billion doses of COVID-19 vaccines were administered around the world. The pace of vaccinations varied significantly across countries and over time. In this note, we study the early effects of vaccinations on mortality, stringency of government restrictions on activity, and mobility indicators, using a large sample of advanced and emerging market economies from December 2020 through May 2021. We show that, throughout that period, countries with early access to vaccine doses experienced larger reductions in COVID-19 deaths and larger rebounds in economic activity.2
The effectiveness of vaccines was established in clinical trials, but whether vaccines lead to a significant decline in fatalities under real-world conditions is not a foregone conclusion.3 As vaccines are rolled out, the spread of the disease could increase if people abandon social distancing measures, if governments relax activity restrictions too soon, or if new COVID-19 variants significantly reduce the efficacy of the vaccines.
Heterogeneity in Early Vaccination Efforts across Countries
Figure 1 illustrates the heterogeneity in early vaccination efforts of the countries in our sample, which includes many advanced and emerging economies that were hit hard by the pandemic.4 The sample starts on December 15, 2020, and ends on May 15, 2021. Starting in December 2020, Israel, the United Kingdom, and the United States ("fast vaccinators") began rapid mass vaccination campaigns. In contrast, vaccine availability delayed the vaccination campaigns in other economies. Among these “slow vaccinators” (such as Canada and Europe excluding the United Kingdom), the vaccine rollout accelerated only in April as manufacturers increased supplies and shipments. Between mid-April and mid-May 2021, vaccinations in many countries proceeded at the same pace as in the United States and the United Kingdom.
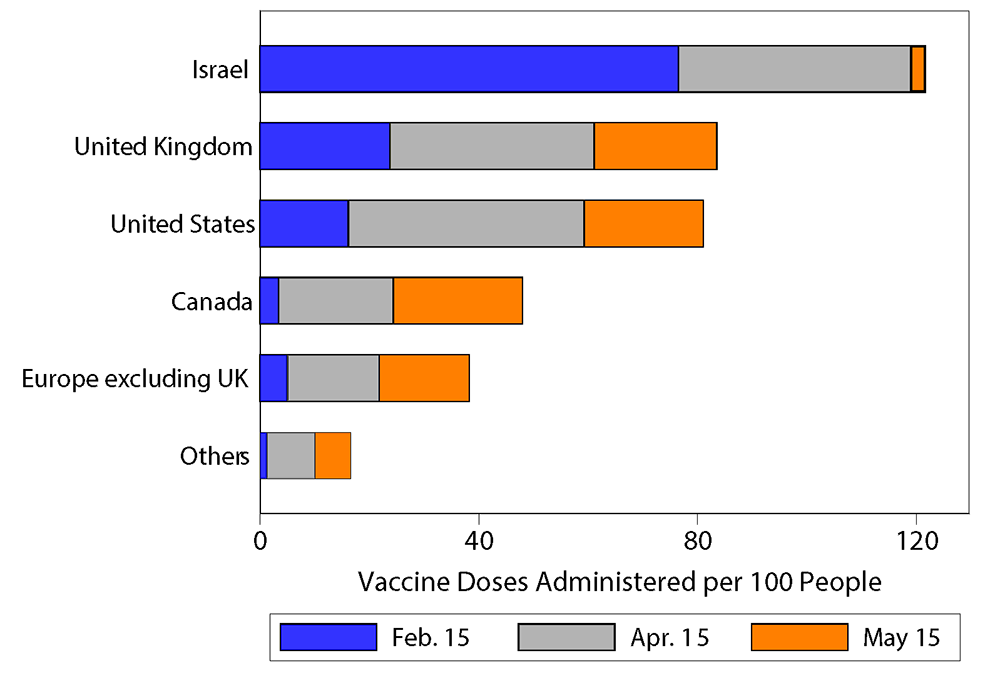
Note: Key identifies series in order from left to right. The bars show total vaccine doses administered in each country or region on the date shown in the legend.
Disentangling the Effect of Vaccinations from Other Factors
To disentangle the effect of vaccinations from other factors, such as stringency of government restrictions and changes in people's behavior, we rely on a comparative case study that tracks the evolution of health and economic outcomes across two groups: an equally-weighted average of the fast vaccinators, and a control group of slow vaccinators. We assemble the control group using weights that are optimally chosen using the synthetic control method.5 The method weights the slow vaccinators so as to create a synthetic country that resembles the fast vaccinators in terms of mortality, stringency of government restrictions, and mobility, between mid-December 2020 and mid-February 2021 (the pre-treatment period).6 The initial sample reflects the initial period when vaccinations are too low to have discernible aggregate effects. Starting in mid-February and until mid-May (the post-treatment period), vaccination efforts are assumed to begin affecting aggregate outcomes, based on trial results suggesting that vaccines become fully effective two weeks following the administration of the last dose.7
Figure 2 illustrates our main finding that vaccinations reduce deaths. Throughout the sample period, the fast vaccinators administered more vaccine doses than the slow ones. By construction, until mid-February, fast and slow vaccinators show matching time profiles for mortality, stringency of government restrictions, and mobility. After mid-February, the behavior of the two groups diverges. As the number of vaccinations increases and as individuals build immunity, fast vaccinators see an ongoing decline in the severity of the pandemic—the death rate falls more in fast-vaccinating countries (top-right panel). The decline in mortality allows governments to relax stringency measures on activity (bottom-left panel), which in turn allows mobility to rise faster among the fast vaccinators (bottom-right panel).
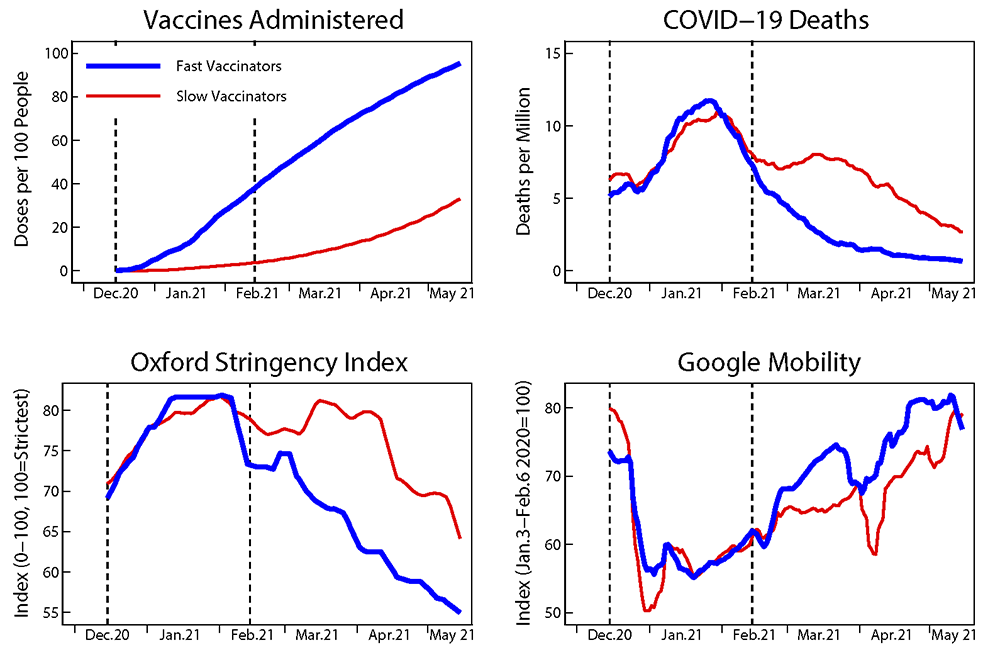
Note: Dashed vertical lines show the beginning and the end of the period when slow vaccinators are constructed to have similar deaths, stringency, and mobility, as fast vaccinators. All data are expressed as 7-day moving averages. The fast vaccinators are an average of Israel, United Kingdom, and the United States. The slow vaccinators are the other countries in the sample.
Assessing the Statistical Significance of the Estimates
To assess the statistical significance of our estimates, we follow the procedure in Abadie, Diamond and Hainmueller (2010) and construct confidence intervals for the average difference in outcomes between fast and slow vaccinators under the assumption that the fast vaccinators are chosen from the "placebo" group of the slow vaccinators. In practice, we ask how plausible it is that a group of randomly chosen countries experience the same outcomes in terms of COVID-19 related deaths, government stringency, and mobility for two months, and a large decline in deaths and a large increase in mobility afterwards. Figure 3 displays the results for this test, focusing on deaths.8 The width of the confidence intervals is a manifestation of the heterogeneity in outcomes across the placebo group of slow vaccinators. In other words, the placebo group exhibits nontrivial variations in mortality rates even in the absence of large differences in vaccination rates. Even so, the estimated gap (the blue solid line) lies around the 5th percentile of the distribution and is unusually large around the end of March. In sum, formal statistical evidence suggests that it is very unlikely that the different outcomes between fast and slow vaccinators occurred purely by chance.
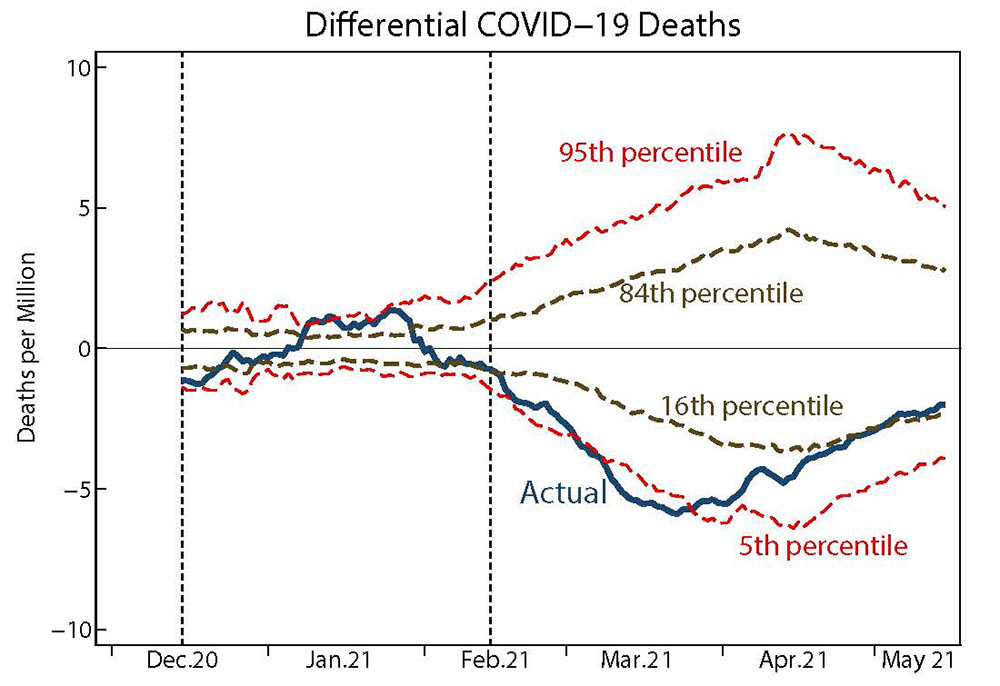
Note: The blue line plots the actual difference in mortality rates between fast and slow vaccinators before and after the vaccination campaigns. The percentile lines depict the range of outcomes around the placebo effects on mortality gaps for countries where the vaccination campaigns did not take place.
Dashed vertical lines show the beginning and the end of the period when slow vaccinators are constructed to have similar deaths, stringency, and mobility, as fast vaccinators. The fast vaccinators are an average of Israel, United Kingdom, and the United States. The slow vaccinators are the other countries in the sample. Data are expressed as 7-day moving averages.
Calculating the GDP Effects of Higher Vaccinations
We next provide an assessment of the early macroeconomic effects of the vaccination campaigns, focusing on the behavior of mobility. Starting in mid-February, and consistent with the relaxation of government restrictions, mobility is higher among the fast vaccinators. An average difference in (cumulative) vaccination rates of about 33 percentage points in the first quarter of 2021 is followed by 5.26 percentage point higher mobility between mid-February and mid-May. Next, we map this effect on mobility into an effect on economic activity. Since the beginning of the COVID-19 pandemic, economic activity across many countries has moved in sync with mobility. To quantify this relationship, we regress quarterly GDP on quarterly time dummies and on quarterly averages of the mobility index, using all available country-quarter observations for fast and slow vaccinators from 2020:Q1 to 2021:Q1.9 The inclusion of quarterly dummies captures common global trends in economic activity that are independent of the behavior of mobility or other seasonal factors. The estimated coefficient of GDP on mobility is 0.187 (with a standard error of 0.037), implying that an increase of 5.26 percentage point in mobility (triggered by higher vaccinations) boosted the level of GDP among the fast vaccinators by nearly 1 percent (0.187×5.26=0.98).
All told, our results illustrate that a faster pace of COVID-19 vaccinations in the first five months of 2021 not only improved health outcomes, but also supported economic activity. As the global vaccine rollout continues, these results support the observation that the global economy will continue to recover from the slump of early 2020.
References
Abadie, Alberto, Alexis Diamond, and Jens Hainmueller (2010). "Synthetic Control Methods for Comparative Case Studies: Estimating the Effect of California's Tobacco Control Program," Journal of the American Statistical Association, 105:490, pp. 493-505.
Abadie, Alberto, and Javier Gardeazabal (2003). "The Economic Costs of Conflict: A Case Study of the Basque Country," American Economic Review, vol. 93 (March), pp. 113–32.
Fernández-Villaverde, Jesús, and Charles Jones (2020). "Macroeconomic Outcomes and COVID-19: A Progress Report (PDF)," NBER Working Papers 28004, National Bureau of Economic Research, Inc.
Hale, Thomas, Noam Angrist, Rafael Goldszmidt, et al. (2021). "A global panel database of pandemic policies (Oxford COVID-19 Government Response Tracker)," Nat Hum Behav, 5, pp. 529–538.
Thompson, Mark, Jefferey Burgess, Allison Naleway, et al. (2021). "Interim Estimates of Vaccine Effectiveness of BNT162b2 and mRNA-1273 COVID-19 Vaccines in Preventing SARS-CoV-2 Infection among Health Care Personnel, First Responders, and Other Essential and Frontline Workers—Eight U.S. Locations, December 2020–March 2021 (PDF)," Morbidity and Mortality Weekly Report, vol. 70 (April), pp. 495–500.
Appendix
The data source for COVID-19 vaccinations and deaths is Our World in Data. The data source for the Oxford Stringency Index is Hale, Angrist, Goldzsmidt, et al. (2021). The data for mobility are from Google COVID-19 Community Mobility Reports. Mobility is calculated as an equally-weighted average of work mobility and retail mobility.
We include in our sample three countries with high vaccination rates in the first two months of 2021: Israel, United Kingdom, and the United States.
We compare the countries above to a synthetic control group formed by selecting optimal weights among many potential country controls. The list includes all countries with fully available daily data on COVID-19 deaths, Oxford Stringency Index, Google Mobility, and vaccination rates that have population greater than two million and average deaths per million greater than 1 between December 1, 2020, and May 31, 2021. These criteria give us a sample with the following 54 countries: Argentina, Austria, Belgium, Bolivia, Bosnia and Herzegovina, Botswana, Brazil, Bulgaria, Canada, Chile, Colombia, Costa Rica, Croatia, Czechia, Denmark, Ecuador, France, Georgia, Germany, Greece, Guatemala, Honduras, Hungary, Ireland, Italy, Jamaica, Jordan, Kuwait, Lebanon, Libya, Lithuania, Mexico, Moldova, Namibia, Nepal, Netherlands, Oman, Panama, Paraguay, Peru, Poland, Portugal, Romania, Russia, Serbia, Slovakia, Slovenia, South Africa, Spain, Sweden, Switzerland, Turkey, Ukraine, and Uruguay.
The fast vaccinators are equally weighed. The optimally chosen weights for the slow vaccinators are positive for the following countries (weights in parentheses): Colombia (0.064), Czechia (0.243), Germany (0.142), Ireland (0.16), Jordan (0.148), Lebanon (0.089), Portugal (0.07), Slovakia (0.019), and Slovenia (0.066).
For the mobility-GDP regressions, we use real quarterly GDP in (in local currency, seasonally adjusted) obtained from national sources through Haver Analytics. The GDP regressions include the countries listed above except Bolivia, Ireland, Jamaica, Kuwait, Lebanon, Libya, Nepal, and Oman. We exclude Ireland from the sample because its official GDP rose in 2020 due to large increases in multinational exports.
1. Contact: [email protected]. All errors and omissions are our own responsibility. The views expressed in this paper are solely the responsibility of the authors and should not be interpreted as reflecting the views of the Board of Governors of the Federal Reserve System or of anyone else associated with the Federal Reserve System. We thank Stefan Baral for discussions on some of the topics in this note. Return to text
2. Throughout this note, we use official counts of COVID-19 deaths as a proxy for the severity of the pandemic. While death counts may underreport the true number of fatalities attributable to the pandemic, they are a better indicator than COVID-19 cases which may also reflect the extent of testing and the availability of testing facilities. Return to text
3. The Center for Disease Control and Prevention reports that mRNA COVID-19 vaccines are effective in preventing infection in a large sample of health-care personnel, first responders, and other essential and frontline workers. The effectiveness of the vaccines is 80 percent two weeks after the first dose and rises to 90 percent two weeks after the second dose. See Thompson, Burgess, Naleway, and others (2021). Return to text
4. The Appendix lists the countries in our sample and our criteria for inclusion. Return to text
5. The synthetic control method rests on the idea that the effects of the treatment (vaccinations) can be measured by comparing outcomes between an aggregate of treated entities (in our case, the fast vaccinators) and a single control group constructed using appropriately weighted untreated entities (in our case, the slow vaccinators). The method involves a data-driven procedure to select the weights of the control group so that both treated and untreated entities look similar in terms of deaths and stringency of government restrictions before the treatment (mid-February). We refer the reader to Abadie and Gardeazabal (2003) for a more thorough description of the method. Return to text
6. The fast vaccinators are Israel, the United Kingdom, and the United States, which led vaccination efforts at the beginning of 2021. The control group of slow vaccinators is chosen from 54 countries that are listed in the Appendix. Return to text
7. We use the real-time indicators of mobility published by Google based on aggregated and anonymized users' location history. For a description of the usefulness of the Google mobility indicators, see Fernández-Villaverde and Jones (2020). Return to text
8. Similar significance in the results obtains when we look at the behavior of mobility in the pre-treatment and post-treatment period. Return to text
9. GDP is expressed in each country as a percent change relative to its pre-pandemic (2019:Q4) level. The regression includes 245 observations for 49 of the original 57 countries in our sample for which we have all available quarterly real GDP data from 2019:Q4 through 2021:Q1. Return to text
Fiori, Giuseppe, and Matteo Iacoviello (2021). "What Did we Learn from 2 billion jabs? Early Cross-Country Evidence on the Effect of COVID-19 Vaccinations on Deaths, Mobility, and Economic Activity," FEDS Notes. Washington: Board of Governors of the Federal Reserve System, September 01, 2021, https://doi.org/10.17016/2380-7172.2984.
Disclaimer: FEDS Notes are articles in which Board staff offer their own views and present analysis on a range of topics in economics and finance. These articles are shorter and less technically oriented than FEDS Working Papers and IFDP papers.