FEDS Notes
February 12, 2026
Why have far-forward nominal Treasury rates increased so much in the past few years? Old risks reemerge in an era of Fed credibility
Daniel Covitz and Eric Engstrom
On July 15, 2026, the source for Figure 1 was updated from FRB-NY to Federal Reserve Board.
Increases in far-forward nominal interest rates in recent years have been remarkable. For example, the increase in the 9- to 10-year forward Treasury rate over the past five years is the largest since its extraordinary ramp-ups in the late 1970s and early 1980s (Figure 1). The increase in far-forward rates is consequential for the economy because higher forward rates mean higher long-term Treasury yields, which boosts the current cost of long-term credit to households and businesses. Indeed, more than 80 percent of the variation in annual changes in the 10-year Treasury yield over the past 50 years can be explained with a simple regression of the 10-year yield on changes in the 9-to-10 year forward rate. Understanding why far-forward rates have increased may also help explain why the 10-year Treasury yield has hovered somewhat above 4 percent over the past year and a half despite 175 basis points of cuts in the target federal funds rate by the Federal Open Market Committee (FOMC) over the same period. The following note offers an asset pricing perspective on these questions. We find that the recent rise in far-forward rates can be attributed to heightened perceived risks of future adverse economic supply shocks and increased concerns about future federal deficits. Even so, we find no evidence that an increase in far-ahead inflation risk has played a role in the rise in far-forward rates. This may seem surprising given supply shocks and fiscal difficulties have historically (and in other countries) been associated with elevated inflation, but it is not implausible, as monetary policy can mitigate inflationary implications of such shocks. Overall, our results suggest a new(ish) era of risks for asset pricing, one in which two old risks —adverse supply shocks and fiscal unsustainability— have reemerged, but the credibility of the Federal Reserve to keep inflation in check has remained.
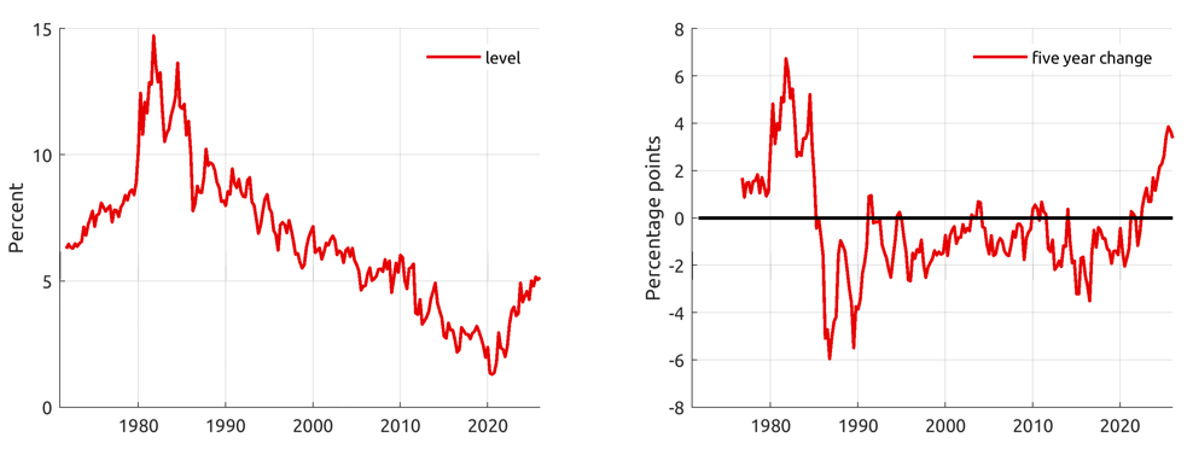
Notes: The left panel depicts the nominal 9-10 year forward rate from smoothed yield curves. The right panel depicts 20-quarter rolling changes in the 9-10 year forward rate.
Source: Federal Reserve Board.
We arrive at this assessment in two steps. The first is to argue that three components of far-forward rates from a standard asset-pricing decomposition (see equation below), far-forward expected inflation, far-forward inflation risk, and expected far-forward real short-term interest rates, have not increased much in the past few years, which implies that the only other component of far-forward rates, the far-forward real risk premium, has increased. The second step is to use the logic of structural asset pricing to identify theoretically plausible explanations for the apparent rise in far-forward real-risk premiums and then narrow that set of explanations based on empirical estimates of economic risks in Engstrom (2025) and public projections for the federal deficit.
Throughout this discussion, we rely on a standard decomposition of far-forward nominal Treasury rates:
$$$$ \text{far fwd rate} = E[\pi] + \text{prem}[\pi] + E[{r^f}] + \text{prem}[{r^f}] $$$$
In this expression, the far-forward rate is the sum of four components: The far-forward expected rate of inflation, $$E[\pi]$$, a far-forward inflation risk premium, $$\text{prem}[\pi]$$, the far-forward expected real rate, $$E[{r^f}]$$ and a far-forward real risk premium, $$\text{prem}[{r^f}]$$.
Far-forward expected inflation and its associated risk premium appear unlikely to have increased in the past few years, mainly because the compensation investors require for future expected inflation and inflation risk, measured as the difference between nominal forward Treasury yields and forward yields on Treasury Inflation Protected Securities, has not increased (Figure 2, left chart, thick red line). In addition, empirical measures of expected long-run inflation from surveys (i.e., far-forward expected inflation) have also not increased. For instance, the thin black line in the left panel of Figure 2 depicts the perceived long-term inflation target (labeled pi-star) used in FRB/US—a model publicly available on the Federal Reserve's website. This measure has also been mostly stable over the past few years. Many would attribute the apparent stability of far-forward inflation compensation and estimates of expected far-forward inflation to investor confidence in the FOMC's commitment to keeping inflation close to its 2 percent target. Moreover, inflation compensation and far-forward inflation expectations from surveys have been very close together, both near 2 percent over the past few years, which suggests that the level of the far-forward inflation risk premium –the gap between the red and black lines— has been about zero and has not increased.
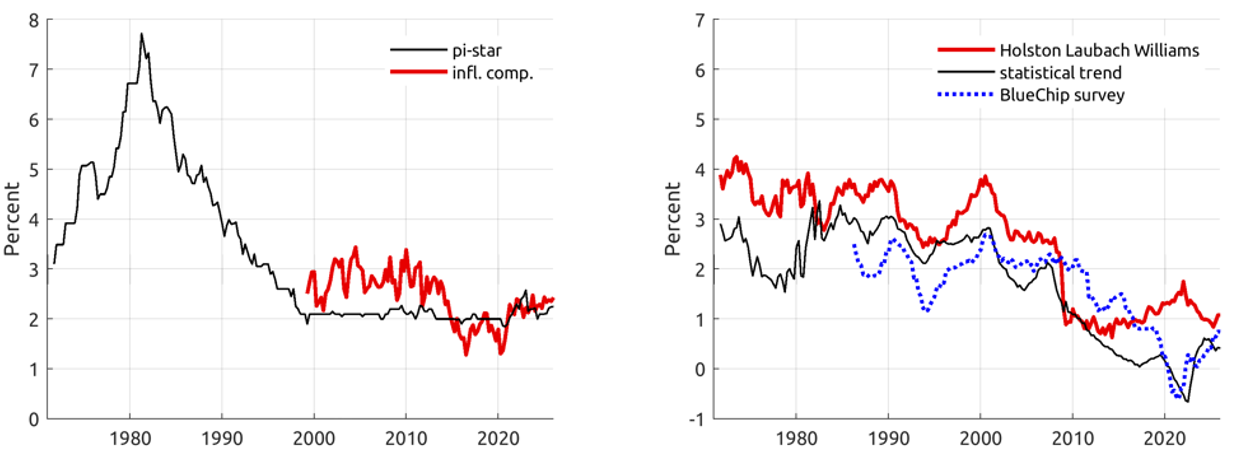
Notes: The left panel depicts in thin black variable "PTR", labeled "pi-star" from the public variable file from FRB/US at the Federal Reserve Board website. (Data for 2025:Q2-Q3 is imputed from the Survey of Professional Forecasters). Plotted in thick red is 9-10 year forward inflation compensation derived from smoothed nominal and inflation-protected Treasury securities. The right panel depicts estimates of r-star from Holston, Laubach and Williams (2017), thick red line, and survey-based estimate from the BlueChip survey, dotted blue, and a purely statistical model of the trend in short term real rates, thin black.
Sources: Survey of Professional Forecasters, BlueChip survey, Federal Reserve Board of Governors, FRB-NY.
Far-forward expected real short-term interest rates may have increased in recent years but unlikely by enough to explain much of the rise in far-forward rates. One far-forward estimate of the real short rate is the "neutral" level of real interest rates, defined as the level of real short-term rates that neither boosts nor restrains economic growth, from Holston, Laubach and Williams ("HLR", 2017), which is available on the public website of the Federal Reserve Bank of New York. As shown by the thick red line in the right panel of Figure 2, this measure has trended down over the past several decades and now stands at the bottom of its historical range. Also shown are two other estimates: an estimate of far-forward expected real rates derived from the BlueChip survey and a purely statistical model of the far-forward expectation for real short rates, shown by the blue dotted and thin black lines, respectively. These two estimates share salient low frequency dynamics with the HLR estimate, in particular a secular decline from 2000 to 2020, but in contrast to HLR they exhibit some upward drift in the post-pandemic years, likely because survey participants are now looking past the period of very low real short rates associated with the pandemic, and the statistical trend model tends to look-through shorter-term fluctuations in real short rates such as the sharp declines in real rates during the pandemic period. Based on these three estimates —all imperfect, to be sure— we surmise that while expected long-run real short rates may have increased some over the past five years, that change is likely small relative to the rise in far-forward rates shown in Figure 1.
Given the apparent stability of far-forward expected inflation and the far-forward inflation risk premium, and the modest rise in expected far-forward real short-term interest rates, we are left with only rising far-forward real risk premiums as the explanation for why far-forward rates have increased so markedly in recent years.
For a historical perspective on the evolution of estimated far-forward risk premiums, Figure 3 shows estimates using a methodology inspired by Bauer and Rudebusch (2017). For the total far-forward risk premium, we subtract from the 9-10 year forward Treasury rate measures of far-forward expected inflation and far-forward expected real interest rates, with the sum of those two elements shown by the thin black line; to measure the far-forward real premium, we also subtract off the far-forward inflation risk premium.1 The estimate of the total far-forward risk premium, illustrated by the thick red line in Figure 3, is now at about its 85th percentile since 1971, though still 200 basis points below the peaks in the early 1980s. It has risen about 200 basis points over the past few years, and the recent increase is attributed entirely to the rise in real far-forward risk premiums, shown by the dotted blue line. That the total risk premium was notably higher in the 1980s relative to today may reflect that the inflation risk premium was higher in the earlier period when the credibility of the Federal Reserve was arguably less well established, but we do not have data to verify this conjecture.
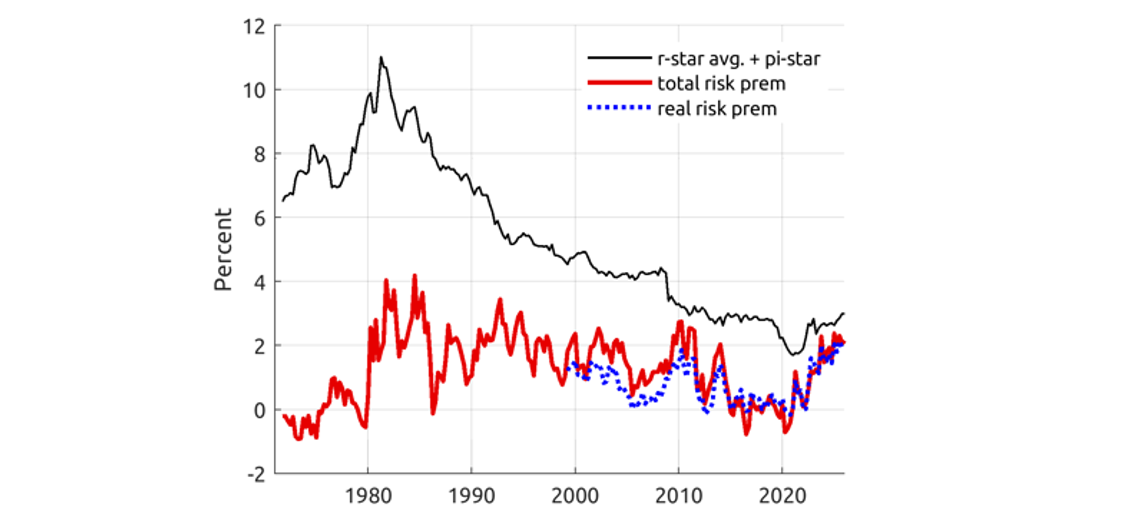
Notes: The thin black line depicts the sum of the PTR variable, labeled "pi-star" from the public variable file from FRB/US at the Federal Reserve Board website and median of the estimates of far-forward expected real short rates shown Figure 2. Data for pi-star for 2025:Q2-Q3 is imputed from the Survey of Professional Forecasters. The thick red line depicts the difference between the nominal 9-10 year forward rate and the sum, pi-star+r-star. The dotted blue line additionally subtracts off the inflation risk premium, measured as far-forward inflation compensation minus pi-star (see Figure 2).
Sources: Survey of Professional Forecasters, Federal Reserve Board of Governors, FRB-NY.
So why might far-forward real risk premiums have increased so substantially in recent years? As is standard in the structural asset pricing literature, we posit that investors require compensation (higher far-forward rates in this case) for risks to an investment position (long the 10-year Treasury and short the 9-year Treasury in this case) that lower the value of the position in poor states of the world such as recession. One possible risk that meets these two requirements is the risk of large adverse supply shocks, which we define as shocks that simultaneously push inflation higher and weaken real economic activity. The inflation pressure generated by adverse supply shocks may induce the Fed to raise real short-term interest rates to keep inflation in check, which reduces the value of the forward investment position; and both adverse supply shocks and the monetary policy response to higher inflation might lead to recessions.
Moreover, the risk of adverse supply shocks may have increased recently. This is suggested by Engstrom's (2025) estimates of adverse supply and demand shocks from 1971 to 2025, reproduced here in Figure 4 in the panels on the left.2 Under this methodology, adverse supply shocks are defined to be shocks that cause unexpectedly low real activity and unexpectedly high inflation, and negative demand shocks are defined to be shocks that cause unexpectedly low real activity and unexpectedly low inflation. Engstrom finds that the 1970s and first 1980s recessions had large supply shock components and no material demand-shock components, consistent with conventional wisdom that oil supply shocks contributed to these recessions, while the next four recessions had large demand-shock components but no material supply-shock components. He also finds that the 2020 recession had both material adverse supply shock and demand shock components, which is intuitive given the deep decline in activity was not accompanied by severe deflation (as would be the case if in the event of a pure demand shock) or a historic increase in inflation (as would be the case in the event of a pure supply shock). In addition, he finds that adverse supply shocks occurred in 2021 and 2022, outside of a recession, but when recession risk was elevated.3
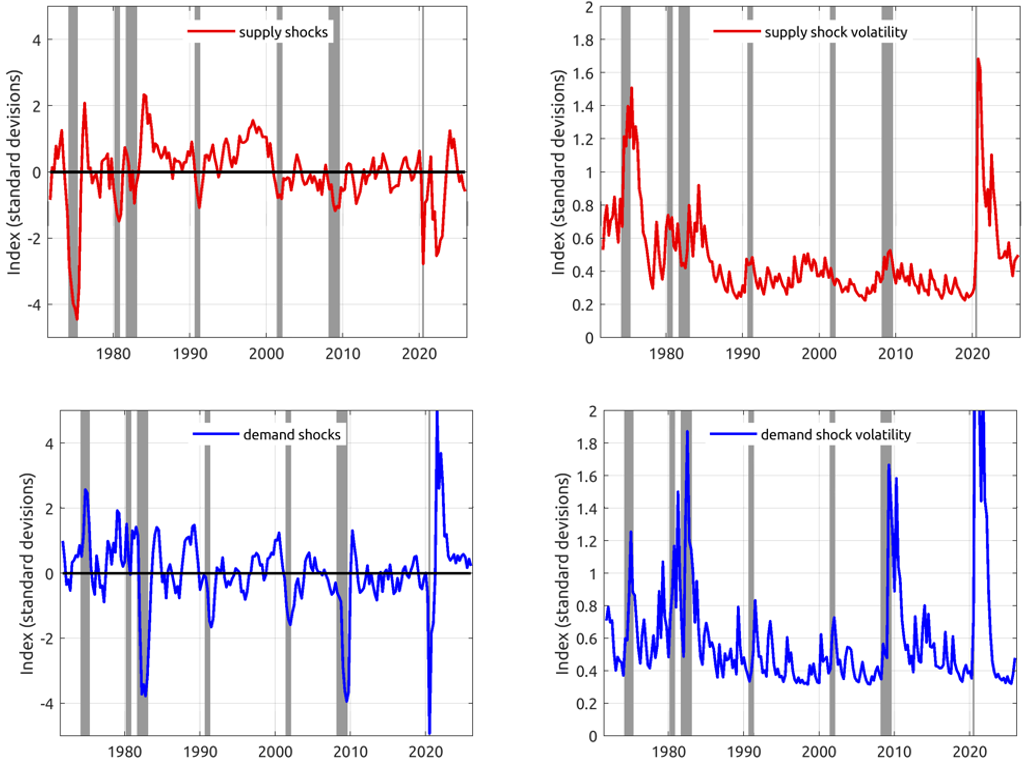
Notes: The panels on the left depict the estimated supply and demand shocks from Engstrom (2025). The panels on the right depict GARCH-based estimates of the expected volatility of supply and demand shocks. NBER-defined recessions are shaded in blue.
Sources: NBER, Federal Reserve Board of Governors.
Therefore, if investors form beliefs about future possibilities based on past experience, we can plausibly conjecture that the risk of large adverse supply shocks (where this risk refers to the likelihood of supply shocks sufficiently large to cause recessions) increased with the recessions in 1975 and 1980, decreased steadily with the streak of demand induced recessions through the subsequent four decades, and then rebounded somewhat in recent years with the demand/supply shock recession in the pandemic and its aftermath. This narrative is corroborated by the upper right panel in Figure 4, which shows a model-based estimate of the predicted volatility of the supply shocks shown to the left. The model is of the GARCH class, so that it maps the magnitudes of recent supply shocks into a prediction for the volatility of supply shocks looking forward. The chart shows that uncertainty about supply shocks indeed peaked in the recessions of the late 1970s and 1980s followed by a long tranquil period of low volatility until 2020, when supply shock uncertainty ramped up again during the Covid recession and subsequent supply disruptions. In combination with the fact shown earlier that the far-forward inflation risk premium does not appear to have increased, the reemergence of supply shock risk as an asset pricing factor is somewhat surprising, as supply shocks have historically coincided with higher inflation. However, the steady level of the inflation risk premium is consistent with investors believing the Fed will return inflation quickly to its 2 percent target level in the event of future supply shocks.
We also consider whether the risk of adverse demand shocks has declined recently, as this would also exert upward pressure on forward-rate premiums. A decline in demand shock risk would raise premiums by reducing the hedging value of the position against demand shocks—hedging value intuitively lowers the compensation investors require. Forward positions hedge against demand shocks because demand shocks, when they hit, lead to lower interest rates in bad states of the world (e.g., when the Fed is battling low inflation and weak economic activity by easing monetary policy). However, given that adverse demand shocks have been a reliable feature of recessions for the past several decades, at least according to Engstrom (2025), we have no evidence that the risk of adverse demand shocks has declined. Indeed, the model-based predicted volatility of demand shocks, shown in the lower right panel of Figure 4, has ramped up materially in almost all recessions, and notably during the GFC and Covid recessions.
The rise in far-forward rate premiums may also reflect a rise in perceived risks to far-forward rates related to the federal debt. As shown in Figure 5, the Congressional Budget Office's projections for the debt to GDP ratio have increased markedly since 2015, with current projections indicating debt is on pace to continue to rise rapidly and reach nearly 120 percent of GDP in about ten years, surpassing the current highest level on record experienced during World War II—debt is measured relative to GDP as it proxies, albeit roughly, for the government's debt servicing capacity. As these increasing projections have been publicly available, it seems intuitive that concerns about future deficits may have increased. This implies an increasing risk that Treasury yields, including short term yields, will need to increase in the future if investors come to believe the federal debt has become unsustainable. An increase in Treasury yields, particularly if driven by concerns about debt sustainability, would likely raise borrowing costs across the economy, which increases the risk of recessions. The reverse is also true. Recessions tend to reduce the government's debt servicing capacity, which could further exacerbate concerns about debt sustainability. This feedback loop suggests that far-forward positions in Treasury securities have become inherently riskier in recent years. From a structural asset pricing perspective, this increased risk should be reflected in higher risk premiums.4 Concerns about debt sustainability were also likely important for asset pricing during World War II. Not only did the level of debt to GDP reach historic highs in the 1940s but the decision of the Treasury Department and Federal Reserve at that time to engage in a decade-long policy of yield curve control suggests the risks to interest rates were material (see Rose, 2021). Notably, debt sustainability crises in other countries have historically led to inflation through consequent drops in the value of their currencies. However, as we discussed earlier, we see no evidence of a perceived increase in inflation risk in recent years.
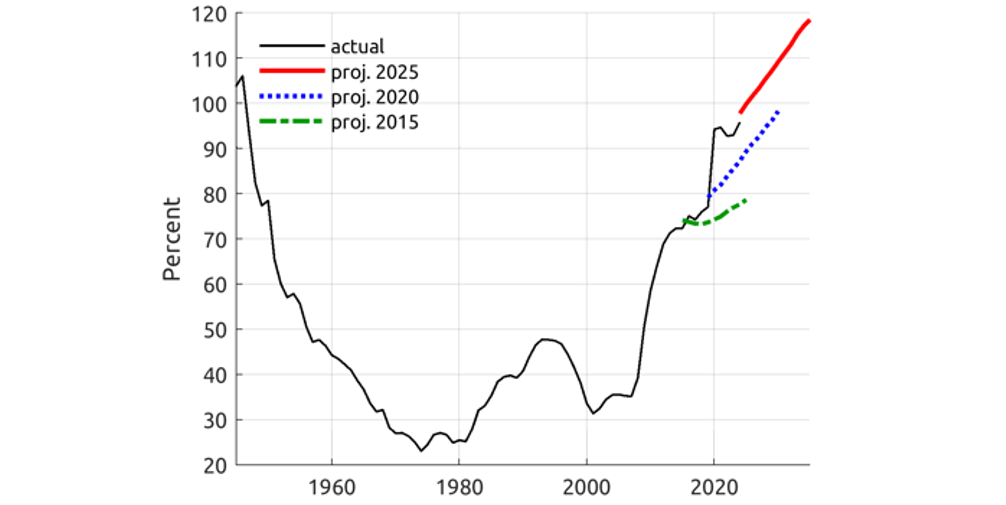
Notes: The black line shows actual levels for U.S. Treasury debt held by the public as reported by the Congressional Budget Office (CBO). Also plotted are three vintages of CBO 10-year debt-to-GDP projections from 2015, 2020, and 2025 in green, blue, and red, respectively.
Source: CBO.
To conclude, a structural asset pricing perspective suggests that increases in the risks of both adverse supply shocks and debt sustainability episodes in the minds of market participants plausibly explains the recent rise in far-forward interest rates. That said, the relative stability of inflation compensation suggests investors continue to have confidence in the FOMC to mitigate the extent to which the materialization of these risks leads to persistently higher inflation.
References
Bauer, Michael D., and Glenn D. Rudebusch. 2020. "Interest Rates under Falling Stars." American Economic Review, 110 (5): 1316-54. DOI: 10.1257/aer.20171822.
Engstrom, Eric, C. 2025. "Soft Landing or Stagflation? A Framework for Estimating the Probabilities of Macro Scenarios," Finance and Economic Discussion Series, Federal Reserve Board of Governors, 2025-047.
Fuhrer, Jeffrey C., Giovanni P. Olivei, and Geoffrey M. B. Tootell. 2012. "Inflation Dynamics When Inflation Is Near Zero." Journal of Money, Credit and Banking 44 (February): 83–122
Gust, Christopher and Skaperdas, Arsenios. 2024. "Government Debt, Limited Foresight, and Longer-Term Interest Rates," Finance and Economic Discussion Series, Federal Reserve Board of Governors 2024-27
Holston, K., Laubach, T., & Williams, J. C. 2017. "Measuring the natural rate of interest: International trends and determinants," Journal of International Economics, 108(S1), S59-S75.
Rose, Jonathan. 2021, "Yield Curve Control in the United States, 1942 to 1951," Economic Perspectives, Federal Reserve Bank of Chicago, October 2021 No. 2
1. The far-forward inflation risk premiums is calculated as the difference between inflation compensation and far-forward expected inflation (see Figure 2). We only have reliable measures of inflation compensation since the year 1999. TIPS were introduced in 1997 but were relatively illiquid for their first few years. We therefor only calculate a forward inflation risk premium from 1999, which implies we can only back out a forward real risk premium since 1999. Return to text
2. The supply and demand shocks are identified using structural vector auto regressions: In particular, Engstrom (2025) estimates the matrix of loadings that maps unobserved structural shocks (supply, demand, and other) to reduced-form shocks, by matching the variance-covariance matrix of the reduced-form shocks, while also employing intuitive sign restrictions on the effects of supply and demand shocks. This allows identification of the unobserved supply and demand shocks. Return to text
3. Recession fears were elevated at the time. According to the mean response from the Survey of Professional Forecasters, the probability of a decline in real GDP one quarter ahead peaked at 47 percent in 2022Q4, compared to a median historical level of 13 percent in data since 1968Q4. Return to text
4. Outside the structural asset pricing literature, behavioral models of preferred habitat also link deteriorating fiscal positions to rising term premiums on interest rates (see Gust and Skaperdas, 2024). Return to text
Covitz, Daniel, and Eric Engstrom (2026). "Why have far-forward nominal Treasury rates increased so much in the past few years? Old risks reemerge in an era of Fed credibility," FEDS Notes. Washington: Board of Governors of the Federal Reserve System, February 12, 2026, https://doi.org/10.17016/2380-7172.4009.
Disclaimer: FEDS Notes are articles in which Board staff offer their own views and present analysis on a range of topics in economics and finance. These articles are shorter and less technically oriented than FEDS Working Papers and IFDP papers.