


Recent Economic and Financial Developments
Monetary Policy Report submitted to the Congress on July 10, 2026, pursuant to section 2B of the Federal Reserve Act
Domestic Developments
Inflation trended up last year and moved notably higher in recent months
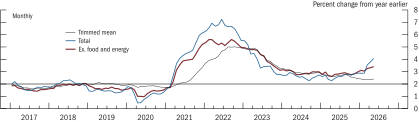
After having fluctuated around a rate somewhat above the Federal Open Market Committee's (FOMC) 2 percent target in 2024 and early 2025, measures of consumer price inflation moved up steadily over the remainder of last year amid signs that increases in tariffs on U.S. goods imports had pushed up domestic prices for some consumer goods. Measured inflation then stepped up further in March as energy prices surged after the start of the Middle East conflict. Over the 12 months ending in May, the price index for personal consumption expenditures (PCE) rose 4.1 percent, up substantially from a 2.5 percent pace a year earlier (figure 1). Core price inflation—which excludes food and energy items and historically has been a better gauge of future inflation—was 3.4 percent over the 12 months ending in May, up from a 2.8 percent pace a year earlier. By contrast, some other measures of inflation that attempt to reduce the influence of idiosyncratic price movements have moved lower over the past year. For example, the 12-month change in the trimmed mean measure of PCE prices constructed by the Federal Reserve Bank of Dallas declined from 2.6 percent last May to 2.4 percent this May.2
Figure 1. Personal consumption expenditures price indexes
Accessible Version | Return to text
Note: The horizontal line indicates the Federal Open Market Committee's objective of 2 percent inflation.
Source: For trimmed mean, Federal Reserve Bank of Dallas; for all else, Bureau of Economic Analysis; all via Haver Analytics.
Consumer energy prices have risen sharply since February, while food prices continued to increase moderately
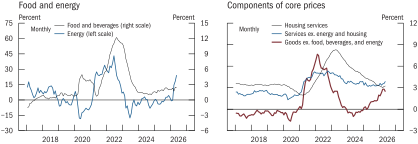
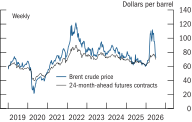
PCE energy prices leaped 24 percent over the 12 months ending in May (figure 2, left panel). Much of the gain reflects a jump in oil and gasoline prices following the start of the military conflict in the Middle East, which severely constrained shipping through the Strait of Hormuz—a key passageway for oil—and damaged some of the region's energy infrastructure. As a consequence, oil prices rose sharply and have been volatile since then, fluctuating on news regarding negotiations between the U.S. and Iran (figure 3).
Figure 2. Price indexes for subcomponents of personal consumption expenditures
Accessible Version | Return to text
Note: Percent change is from year earlier.
Source: Bureau of Economic Analysis via Haver Analytics.
Figure 3. Oil prices
Accessible Version | Return to text
Note: The data are weekly averages of daily data and extend through July 2, 2026.
Source: ICE Brent Futures via Bloomberg.
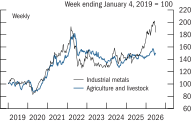
Although the pace of increase in PCE food prices remained moderate, it has picked up this year. Food prices rose 2.4 percent over the 12 months ending in May, up from 1.8 percent at the same time last year (figure 2, left panel). A few somewhat interrelated factors contributing to the step-up in measured food price inflation include the effects of higher tariffs and increases in agricultural and livestock commodity prices (figure 4, blue line).
Figure 4. Spot prices for commodities
Accessible Version | Return to text
Note: The data are weekly averages of daily data and extend through July 2, 2026.
Source: For industrial metals, S&P GSCI Industrial Metals Spot Index; for agriculture and livestock, S&P GSCI Agriculture & Livestock Spot Index; both via Haver Analytics.
Lower-income households are particularly sensitive to changes in the costs of food and energy, as these necessities account for a large share of their expenditures. Reflecting the sharp run-ups seen in 2021 and 2022, as well as the increase this year, food prices are almost 30 percent higher than before the pandemic, well above the 8 percent increase that would have been observed if these prices had continued rising at their average rates over the decade before the pandemic.3
Core goods price inflation continued to move up early this year
In assessing the outlook for inflation, it is helpful to consider three separate components of core prices: core goods, housing services, and core nonhousing services (figure 2, right panel). Core goods price inflation moved up notably over 2025 and continued to rise in the early months of this year. The 12-month change in PCE core goods prices stood at 2.4 percent in May, far higher than the 0.6 percent pace recorded a year earlier.
The effects of tariffs cannot be observed directly in the official consumer price statistics, and these effects depend on the responses of consumers, firms, importers, and foreign exporters. Nonetheless, the pattern of price changes last year suggests that tariff increases contributed in part to the upturn in consumer goods price increases. As an example, relative to their pre-tariff trends, average monthly price increases were higher in goods categories that are more exposed to tariff increases due to their relatively high import content, such as household appliances and a variety of consumer electronics.
In the early months of 2026, rapid gains in consumer prices for software and accessories, computers, and other electronics also contributed to overall measured core goods inflation.4 These prices are quite elevated relative to their year-earlier levels, and the gains likely reflect the surge in demand for semiconductors and other components important to the buildout of data centers that provide the infrastructure needed for artificial intelligence (AI) applications and services. Although a large portion of high-tech goods are imported, most of these products are exempt from tariffs, so changes in tariff rates are not an important factor in their prices.
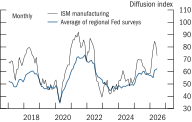
Rising prices for fuel, metals, and other key inputs have increased cost pressures on domestic manufacturers and are likely feeding into core goods prices. This year, purchasing managers have reported in both the Institute for Supply Management manufacturing survey and regional Federal Reserve surveys that the prices they paid for inputs used in production moved higher (figure 5). Many respondents cited geopolitical tensions in the Middle East, rising fuel and transportation costs, and broad supply constraints as primary drivers of these elevated input costs. Indeed, global benchmark prices for industrial metals have risen considerably, on net, this year, likely reflecting supply constraints resulting from the conflict in the Middle East and increased demand arising from data center construction and outfitting (figure 4, black line). Finally, the Federal Reserve Bank of New York's Global Supply Chain Pressure Index—which incorporates information from a range of sources—indicates that supply chain pressures have jumped in recent months.
Figure 5. Prices paid indexes from manufacturing surveys
Accessible Version | Return to text
Note: The data extend through June 2026. The regional survey average comprises data from the Dallas Fed's Texas Manufacturing Outlook Survey, the Kansas City Fed's Survey of Tenth District Manufacturers, the New York Fed's Empire State Manufacturing Survey, and the Philadelphia Fed's Manufacturing Business Outlook Survey. ISM is Institute for Supply Management.
Source: Institute for Supply Management, Manufacturing Report on Business; Federal Reserve Bank of Dallas, Texas Manufacturing Outlook Survey; Federal Reserve Bank of Kansas City, Survey of Tenth District Manufacturers; Federal Reserve Bank of New York, Empire State Manufacturing Survey; Federal Reserve Bank of Philadelphia, Manufacturing Business Outlook Survey; all via Haver Analytics.
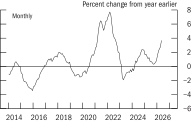
Published nonfuel import prices, which measure the prices charged by foreign suppliers and exclude tariffs, have risen sharply this year, driven up by higher prices for industrial metals, computers, and semiconductors (figure 6). By contrast, the prices paid by domestic producers to import these products, which do include tariffs, are estimated to have decreased this year. These price reductions primarily reflect a decline in the average U.S. tariff rate following February's Supreme Court ruling that invalidated many prevailing tariff measures and whose repeal was only partially offset by new, alternative tariff measures.
Figure 6. Nonfuel import price index
Accessible Version | Return to text
Note: The missing value for the nonfuel import price index in October 2025 is estimated using the average of the September 2025 and November 2025 values.
Source: Bureau of Labor Statistics.
Housing services price inflation moved lower
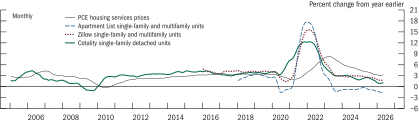
Housing services price inflation declined considerably last year and is now close to its pre-pandemic pace. Over the 12 months ending in May, housing services prices rose 3.2 percent, a notably smaller gain than the 4.1 percent increase for the comparable period in 2025 (figure 7).
Figure 7. Measures of rental price inflation
Accessible Version | Return to text
Note: The data start in January 2016 for Zillow and January 2018 for Apartment List. PCE is personal consumption expenditures. Apartment List, Zillow, and Cotality data measure market-rate rents—that is, rents for a new lease by a new tenant.
Source: Bureau of Economic Analysis, PCE, via Haver Analytics; Apartment List, Inc., via Haver Analytics; Zillow, Inc.; Cotality; Federal Reserve Board staff calculations.
Core nonhousing services price inflation remains above its pre-pandemic average
Finally, prices for core nonhousing services—a broad group that includes medical, travel and dining, and financial services—increased 3.9 percent over the 12 months ending in May, somewhat above the range of readings this measure has recorded since the middle of last year. Robust increases in prices for medical services, accommodations, and airfares (likely due to a recent surge in jet fuel prices) have contributed to the gains in this category. Despite the recent uptick in the pace of price increases, there do not appear to be persistent cost pressures for firms in this sector, where labor is the most important input: Wage growth has declined gradually in recent years, and even though it remains at a solid level, it has been accompanied by strong productivity growth.
Most measures of longer-term inflation expectations have been stable, while most measures of shorter-term expectations have risen in recent months
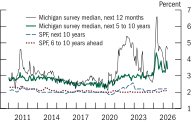
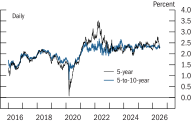
A generally held view among economists is that inflation expectations influence actual inflation by affecting wage- and price-setting decisions. Most measures suggest that longer-term inflation expectations remain well anchored. Survey-based measures produced by Blue Chip Financial Forecasts, the Federal Reserve Banks of New York and Atlanta, and the Survey of Professional Forecasters from the Federal Reserve Bank of Philadelphia have moved roughly sideways in recent months and remain within the range seen in the decade before the pandemic, when inflation was low (figure 8).5 For example, the median forecaster in the Survey of Professional Forecasters continued to expect inflation to average 2.1 percent over the five years beginning five years from now. Similarly, market-based measures of longer-term inflation compensation based on financial instruments linked to inflation have been little changed so far this year (figure 9).
Figure 8. Measures of inflation expectations
Accessible Version | Return to text
Note: The data for the Michigan survey are monthly and extend through June 2026. The data for the Survey of Professional Forecasters (SPF) are quarterly and extend through 2026:Q2.
Source: University of Michigan Surveys of Consumers; Federal Reserve Bank of Philadelphia, SPF.
Figure 9. Inflation compensation implied by Treasury Inflation-Protected Securities
Accessible Version | Return to text
Note: The data are at a business-day frequency and are estimated from smoothed nominal and inflation-indexed Treasury yield curves.
Source: Federal Reserve Bank of New York; Federal Reserve Board staff calculations.
By contrast, most measures of shorter-term inflation expectations have risen this year—particularly since the start of the conflict in the Middle East—though the extent of the increases has varied considerably. At one extreme, 12-month inflation expectations in the University of Michigan survey rose from 3.4 percent in February to 4.6 percent in June, an elevated rate that was nevertheless still well below the peak that followed last year's announcements of tariff increases (figure 8, black line). Other short-term measures, such as those produced by the Federal Reserve Bank of New York's Survey of Consumer Expectations, the Blue Chip survey, and many measures of businesses' expectations of inflation and cost increases, have risen less dramatically or have changed little, on net, as have market-based inflation compensation measures.
A task force will explore inflation frameworks
Against the backdrop of persistently elevated inflation, the Federal Reserve has commissioned an independent task force to explore inflation frameworks. In particular, the task force will examine the drivers of inflation, consider first principles, and weigh a wide range of ideas on how monetary policy can deliver price stability in a changing economy.
Labor market conditions have been broadly stable so far this year
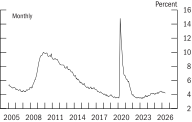
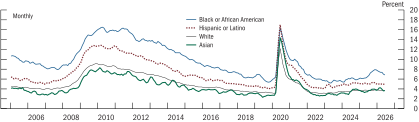
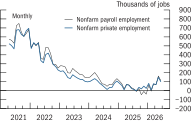
As measured across a range of indicators, the labor market has stabilized this year following a period of cooling. In June, the unemployment rate stood at 4.2 percent—low by historical standards—and it has been little changed this year (figure 10). Similarly, unemployment rates across most demographic groups have held stable at low levels (figure 11). (The box "Employment and Earnings across Demographic Groups" provides further details.) Layoffs have been subdued, and job vacancies have been roughly flat on net. Meanwhile, job growth has picked up so far this year, although it remains soft by historical standards: Following very anemic average monthly gains of about 30,000 in the second half of last year, private payroll gains increased to nearly 80,000 in the first quarter of this year and then stepped up further to almost 100,000 in the second quarter (figure 12). Across industries, while employment growth in health care has been relatively strong, other industries have posted more modest gains, with employment in leisure and hospitality, information, and financial activities recording declines.
Figure 10. Civilian unemployment rate
Accessible Version | Return to text
Note: The data extend through June 2026. Missing data for October 2025 are estimated using the average of the September 2025 and November 2025 values.
Source: Bureau of Labor Statistics via Haver Analytics.
Figure 11. Unemployment rate, by race and ethnicity
Accessible Version | Return to text
Note: All data shown are 3-month moving averages and extend through June 2026. Unemployment rate measures total unemployed as a percentage of the labor force. Persons whose ethnicity is identified as Hispanic or Latino may be of any race. Small sample sizes preclude reliable estimates for Native Americans and other groups for which monthly data are not reported by the Bureau of Labor Statistics. Missing data for October 2025 are estimated using the average of the September 2025 and November 2025 values.
Source: Bureau of Labor Statistics via Haver Analytics.
Figure 12. Nonfarm payroll employment
Accessible Version | Return to text
Note: The data shown extend through June 2026 and are a 3-month moving average of the change in nonfarm payroll employment.
Source: Bureau of Labor Statistics via Haver Analytics.
Growth in labor supply has been historically low...
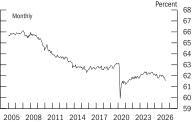
Growth in the supply of labor—determined by both the growth of the working-age population and changes in the labor force participation rate, which is the share of the population either currently employed or actively looking for work—has slowed notably over the past two years to a pace that is extremely subdued relative to historical norms.6 Much of the slowdown can be attributed to a sharp reduction in net immigration. According to estimates produced by the Census Bureau, strong immigration from 2022 through 2024 contributed to elevated population growth in those years, but immigration slowed markedly over the 12 months ending in June 2025; more recent indicators point to very low immigration and population growth since then. Meanwhile, the labor force participation rate has moved down since reaching its recent peak in 2023, reflecting downward pressure from population aging (figure 13).
Figure 13. Labor force participation rate
Accessible Version | Return to text
Note: The data extend through June 2026. Values before January 2026 are estimated by Federal Reserve Board staff to eliminate discontinuities in the published history. Missing data for October 2025 are estimated using the average of the September 2025 and November 2025 values.
Source: Bureau of Labor Statistics via Haver Analytics.
. . . and growth in labor demand appears to have stabilized at a modest pace
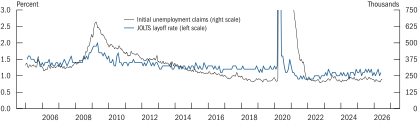
Job openings, as measured in the Job Openings and Labor Turnover Survey (JOLTS), have moved a little higher since late last year. Meanwhile, an alternative measure of vacancies that uses job postings data produced by Indeed, a large online job board, has flattened out this year following declines in previous years. Indicators of layoff activity have remained muted, as initial claims for unemployment insurance have been moving sideways, on net, and the JOLTS layoff rate has averaged only 1.1 percent so far this year, similar to its pre-pandemic average (figure 14).
Figure 14. Indicators of layoffs
Accessible Version | Return to text
Note: The data for initial unemployment claims cover regular state programs, are reported as a 4-week moving average, and extend through June 27, 2026. The data for the Job Openings and Labor Turnover Survey (JOLTS) layoff rate are monthly. Series are truncated at the top of the figure in 2020 and 2021.
Source: Bureau of Labor Statistics via Haver Analytics; Department of Labor, Employment and Training Administration.
With growth in labor supply and demand about equally subdued, many key indicators of labor market conditions and resource utilization have been broadly stable
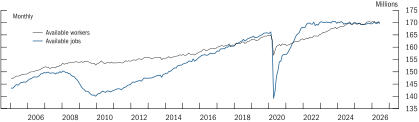
Various indicators that track labor market conditions have held mostly steady this year, suggesting that the labor market has become neither notably more nor less tight. For example, the JOLTS measure of the percentage of workers quitting their jobs each month—an indicator of the availability of attractive job prospects—has been largely flat in recent months. Additionally, the gap between the total number of available jobs (measured by employed workers plus job openings) and the number of available workers (measured by the size of the labor force) has edged slightly higher this year after having drifted a bit lower last year (figure 15). Finally, after declining steadily through last year, the share of respondents to the Conference Board Consumer Confidence Survey who say that jobs are plentiful flattened out in early 2026, though it moved down in June.
Figure 15. Available jobs versus available workers
Accessible Version | Return to text
Note: The data extend through June 2026. Available jobs are employment plus job openings as of the end of the previous month. Available workers are the labor force. Data for employment and labor force before January 2026 are estimated by Federal Reserve Board staff to eliminate discontinuities in the published history. Missing data for October 2025 are estimated using the average of the September 2025 and November 2025 values.
Source: Bureau of Labor Statistics via Haver Analytics; Federal Reserve Board staff calculations.
Labor productivity increased robustly last year
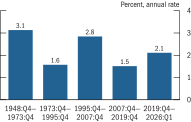
Since late 2019, business-sector labor productivity growth has averaged 2.1 percent per year—notably faster than the 1.5 percent average pace over the previous business cycle between the fourth quarters of 2007 and 2019 (figure 16). The strong gains in productivity over the past few years are likely attributable to a variety of factors, including firms' investments in labor-saving technologies and high-tech capital to improve efficiency as well as the elevated pace of business formation since 2020. More recently, businesses' adoption of AI technologies could also be a contributing factor, albeit modest to date.
Figure 16. Average U.S. labor productivity growth
Accessible Version | Return to text
Note: The data are output per hour in the business sector.
Source: Bureau of Labor Statistics via Haver Analytics; Federal Reserve Board staff calculations.
A task force will explore productivity and jobs
One of the recently announced independent task forces will explore the subject of productivity and jobs. It will survey the pace, the reach, and the economic effects of generative AI—a new general-purpose technology—and other innovations. The task force will explore the implications for the Federal Reserve in pursuit of its maximum-employment and price-stability mandates.
Wage growth remains solid and, with persistently strong productivity growth, is roughly consistent with 2 percent inflation over time
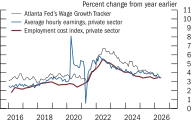
Measures of nominal wage growth remain solid, although they have edged down this year on net. Total hourly compensation for private-sector workers, as measured by the employment cost index, increased 3.4 percent over the year ending in March, unchanged from its pace a year earlier but well below its peak increase of 5.5 percent in mid-2022 (figure 17). However, other measures of labor compensation growth, such as average hourly earnings (a less comprehensive measure of compensation) and the Federal Reserve Bank of Atlanta's Wage Growth Tracker (which reports the median 12-month wage growth of individuals responding to the Current Population Survey), have moved lower over the past year.
Figure 17. Measures of change in hourly compensation
Accessible Version | Return to text
Note: For the Atlanta Fed's Wage Growth Tracker, the data are shown as a 3-month moving average of the 12-month percent change; for private-sector average hourly earnings, the data are 12-month percent changes and extend through June 2026; for the private-sector employment cost index, change is over the 12 months ending in the last month of each quarter.
Source: Bureau of Labor Statistics; Federal Reserve Bank of Atlanta, Wage Growth Tracker; all via Haver Analytics.
Although wage growth remains a touch above its pre-pandemic pace, persistently strong labor productivity growth suggests that current nominal wage growth is roughly consistent with 2 percent inflation over time.
Solid nominal wage gains have nonetheless been outpaced by overall price inflation over the past year. With the recent jump in energy prices boosting the change in PCE prices to 4.1 percent over the 12 months ending in May, the purchasing power of workers' wages, in the aggregate, declined somewhat over this period. That said, for the year ending in May 2025, wage gains outpaced price inflation. The effects on individual households, though, depend in part on workers' circumstances—because nominal wage changes vary significantly across industry and occupation and because households consume different baskets of goods than the one represented in the aggregate PCE price index. (For details on how real wage gains have differed across demographic groups, see the box "Employment and Earnings across Demographic Groups.")
Box 1. Employment and Earnings across Demographic Groups
Employment disparities across sex, race, ethnicity, and education groups—some of which reached record lows in 2023 and early 2024 in an especially tight labor market—continue to be relatively narrow compared with historical levels. However, despite the labor market progress for many demographic groups in recent years, significant disparities in absolute levels across groups remain. Additionally, the robust real wage gains experienced by some historically disadvantaged groups in recent years have since moderated as labor market tightness has eased and consumer price inflation has remained elevated.
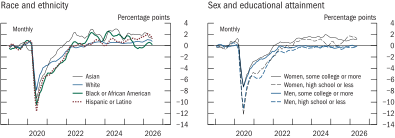
Among prime-age people (aged 25 to 54), the employment-to-population (EPOP) ratio for Black or African American workers softened considerably in the first half of 2025 but has since partially recovered and, in recent months, has been a touch above its average level in 2019 (figure A, left panel).1 This development primarily reflects an increase in the unemployment rate for this group over early 2025 that has since partially reversed.2 At the same time, the employment rate for white workers has continued to gradually drift higher over the past year. As a result, the EPOP ratio gap between Black and white individuals has widened, on net, over the past year, although it remains narrow compared with its historical level.3 By contrast, the employment rate for Hispanic or Latino workers has held roughly steady, on net, over the past year, while the employment rate for Asian workers has edged down a touch, although the ratios for both groups are elevated by historical standards. The EPOP ratio gap between Hispanic and white workers is roughly unchanged relative to a year ago, while the gap between Asian and white workers has widened.4
Figure A. Prime-age employment-to-population ratios compared with the 2019 average ratio, by group
Accessible Version | Return to text
Note: The data are 3-month moving averages. The data by race and ethnicity extend through June 2026. Prime age is 25 to 54. All series are seasonally adjusted by Federal Reserve Board staff. Data by sex and education before January 2026 are estimated by Federal Reserve Board staff to eliminate discontinuities in the published history. Missing data for October 2025 are estimated using the average of the September 2025 and November 2025 values.
Source: Bureau of Labor Statistics; U.S. Census Bureau, Current Population Survey; Federal Reserve Board staff calculations.
The EPOP ratio for prime-age women grew strongly during the post-pandemic recovery and peaked in 2024, which led to a historically narrow EPOP ratio gap between prime-age men and women. This increase in the EPOP ratio for women mostly reflects the continuation of the pre-pandemic trend of rising female labor force participation—some of which is likely attributable to increased educational attainment—among other factors.5 In the past year, growth in the female EPOP ratio has leveled off, but given that the male EPOP ratio has been roughly flat over this time, the employment gap between men and women has remained near its low point. Both women with and without some college education currently have EPOP ratios a bit above their pre-pandemic levels (figure A, right panel). By contrast, male EPOP ratios are about equal to their pre-pandemic levels for both these education groups.
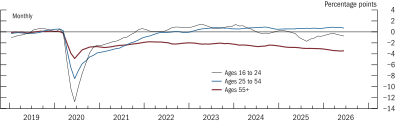
Among all prime-age people (aged 25 to 54), the EPOP ratio has remained roughly stable over the past year (figure B). The EPOP ratio for people aged 55 or older, though, has continued to gradually decline and is now approximately 3.5 percentage points below its 2019 average. Most of this shortfall relative to 2019 reflects retirements related to the aging of the baby-boom generation. As this cohort has grown older, the median age of people in the aged 55 or older population has risen, and because older workers are more likely to have retired, this trend has lowered the group's EPOP ratio. Further, workers in this group, particularly those aged 65 or older, began retiring somewhat earlier than usual during the pandemic, which has put some additional downward pressure on their EPOP ratio.6 After falling a fair bit from its post-pandemic peak in 2024, the EPOP ratio of younger workers (aged 16 to 24) has remained flat, on net, over the past year, and now sits a touch below its average level in 2019. The net decline relative to 2024 likely reflects a combination of factors particular to this age group: greater sensitivity of labor force participation decisions to the easing labor market conditions of the past two years, potential vulnerability to the adoption of generative artificial intelligence (GenAI) across employers, and potential negative effects of remote-work policies on early-career workers.7
Figure B. Employment-to-population ratios compared with the 2019 average ratio, by age
Accessible Version | Return to text
Note: The data are 3-month moving averages and extend through June 2026. All series are seasonally adjusted by Federal Reserve Board staff. Data before January 2026 are estimated by Federal Reserve Board staff to eliminate discontinuities in the published history. Missing data for October 2025 are estimated using the average of the September 2025 and November 2025 values.
Source: Bureau of Labor Statistics; U.S. Census Bureau, Current Population Survey; Federal Reserve Board staff calculations.
Although employment disparities across many demographic groups remain near the historical lows reached during the post-pandemic recovery period, substantial gender, racial, ethnic, and geographic gaps in levels persist. Currently, prime-age women are employed at a rate 11 percentage points less than men, while prime-age Black and Hispanic workers are employed at a rate 6 percentage points and 3 percentage points below white workers, respectively, underscoring long-standing structural factors.8
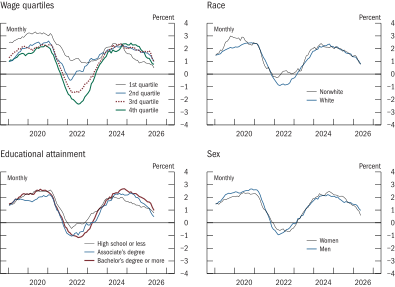
Real wage growth has cooled a bit further in the past year as consumer price inflation has stepped up. Earlier in the current expansion, the tight labor market led to robust real wage growth, particularly for lower-wage workers and for many historically disadvantaged groups; however, since mid-2024, wage growth for these groups has slowed. As shown in the top-left panel of figure C, real wage growth—as measured by the Federal Reserve Bank of Atlanta's Wage Growth Tracker and deflated by the personal consumption expenditures price index—was generally stronger for workers in the bottom half of the income distribution during the post-pandemic recovery through the first half of 2024. This strength was driven by both labor demand outpacing labor supply in lower-wage industries during the post-pandemic reopening of the economy and strong wage growth for job switchers over the same period who were disproportionately lower-wage workers.9 However, since late 2024, real wage growth for workers in the bottom quartile has fallen below that of the other quartiles but has remained positive, on average, over the past 12 months. Real wage growth among the highest income quartile remained robust through mid-2025 but has since slowed sharply. (The data used in this discussion to measure real wage growth across demographic groups are a 12-month moving average and are therefore lagged relative to actual real wage growth.10 As a result, the group-specific real wage growth measures discussed here remain positive even while the aggregate real wage growth measures discussed elsewhere in this report have turned negative.)
Figure C. Median real wage growth, by group
Accessible Version | Return to text
Note: Series show 12-month moving averages of the median percent change in the hourly wage of individuals observed 12 months apart, deflated by the 12-month moving average of the 12-month percent change in the personal consumption expenditures price index. In the top-left panel, workers are assigned to wage quartiles based on the average of their wage reports in both Current Population Survey outgoing rotation group interviews; workers in the lowest 25 percent of the average wage distribution are assigned to the 1st quartile, and those in the top 25 percent are assigned to the 4th quartile.
Source: Federal Reserve Bank of Atlanta, Wage Growth Tracker; Bureau of Labor Statistics; U.S. Census Bureau, Current Population Survey; Federal Reserve Board staff calculations.
The recent cooling in real wage growth is visible across all broad demographic groups, including among some groups for whom, up until a year ago, wage growth had remained robust. Wage growth for nonwhite workers had been a bit stronger than for white workers from 2022 through mid-2024 but has been similar to white workers' since then (figure C, top-right panel). Similarly, wage growth for workers with a high school diploma or less was strong relative to other groups in the post-pandemic tight labor market; however, as labor market conditions softened in 2024, wage growth for this group fell below that for college-educated workers in early 2024 and has been slowing, on net, since mid-2024 (figure C, bottom-left panel). Some of this softening may be spreading to workers with an associate's degree, for whom real wage growth has eased more significantly in the past year and currently stands below that for other education groups. Finally, wages for men and women largely grew in tandem until the middle of 2024, but real wage growth for women was a bit stronger than that for men from mid-2024 through mid-2025 (figure C, bottom-right panel). However, in recent months, wage growth for women has tapered a bit and is now a touch below that of men.
1. Because of the government shutdown in 2025, the Bureau of Labor Statistics did not collect October employment and wage data. Therefore, October 2025 employment and nominal wage values are estimated as the average of September 2025 and November 2025 values.
The missed collection of employment data for October 2025 may complicate the comparison of employment and labor force participation rates across demographic groups because of the varying effect across groups of a form of survey sampling error referred to as "excess rotation group" bias. For a discussion of this possible bias, see Hie Joo Ahn and James D. Hamilton (2022), "Measuring Labor-Force Participation and the Incidence and Duration of Unemployment," Review of Economic Dynamics, vol. 44 (April), pp. 1–32. Return to text
2. The EPOP ratio—that is, employment divided by population—can also be expressed as LFPR * (1 – UR), where LFPR is the labor force participation rate and UR is the unemployment rate. The EPOP ratio therefore decreases as the LFPR decreases or as the unemployment rate increases. The EPOP ratio is multiplied by 100 for presentation purposes in the figures. Return to text
3. In figures A and B, EPOP ratios are shown indexed to their 2019 average; therefore, gaps between groups are not readily evident. Through December 2025, EPOP ratios by sex and education are constructed using harmonized microdata weights. For more information, see John Coglianese, Seth Murray, and Christopher J. Nekarda (2025), "Harmonized Population and Labor Force Statistics," Finance and Economics Discussion Series 2025-057 (Washington: Board of Governors of the Federal Reserve System, August), https://doi.org/10.17016/FEDS.2025.057. Return to text
4. As monthly series have greater sampling variability for smaller groups, we do not plot EPOP ratio estimates for American Indians or Alaska Natives. Return to text
5. For a discussion of the contribution of educational attainment to prime-age female labor force participation before the pandemic, see Didem Tüzemen and Thao Tran (2019), "The Uneven Recovery in Prime-Age Labor Force Participation," Federal Reserve Bank of Kansas City, Economic Review, vol. 104 (Third Quarter), pp. 21–41, https://www.kansascityfed.org/Economic%20Review/documents/652/2019-The%20Uneven%20Recovery%20in%20Prime-Age%20Labor%20Force%20Participation.pdf. Return to text
6. For an analysis on the increase in retirements following the pandemic, see Joshua Montes, Christopher Smith, and Juliana Dajon (2022), " ‘The Great Retirement Boom': The Pandemic-Era Surge in Retirements and Implications for Future Labor Force Participation," Finance and Economics Discussion Series 2022-081 (Washington: Board of Governors of the Federal Reserve System, November), https://doi.org/10.17016/FEDS.2022.081. Return to text
7. For a discussion of the cyclical dynamics of labor force participation, see Tomaz Cajner, John Coglianese, and Joshua Montes (forthcoming), "The Long-Lived Cyclicality of the Labor Force Participation Rate," Review of Economics and Statistics. For analyses of the effect of GenAI adoption on the employment of early-career workers, see Erik Brynjolfsson, Bharat Chandar, and Ruyu Chen (2025), "Canaries in the Coal Mine? Six Facts about the Recent Employment Effects of Artificial Intelligence," working paper, Stanford Digital Economy Lab, November; and Seyed Mahdi Hosseini Maasoum and Guy Lichtinger (2025), "Generative AI as Seniority-Biased Technological Change: Evidence from U.S. Résumé and Job Posting Data," working paper, August (revised June 2026). For analyses of the potential effects of remote-work policies on early-career workers, see Natalia Emanuel, Emma Harrington, and Amanda Pallais (2023), "The Power of Proximity to Coworkers," NBER Working Paper Series 31880 (Cambridge, Mass.: National Bureau of Economic Research, November; revised June 2026), https://www.nber.org/system/files/working_papers/w31880/w31880.pdf; and Peter John Lambert and Yannick Schindler (2026), "The Broken Ladder: AI, Remote Work, and Early-Career Hiring," working paper, May. Return to text
8. These structural factors include observable features—such as persistent educational differences—as well as important components that cannot be explained by observable factors. For further discussion of employment disparities by gender, see Claudia Goldin (2021), Career and Family: Women's Century-Long Journey toward Equity (Princeton, N.J.: Princeton University Press). For further discussion of employment disparities by race and ethnicity, see Tomaz Cajner, Tyler Radler, David Ratner, and Ivan Vidangos (2017), "Racial Gaps in Labor Market Outcomes in the Last Four Decades and over the Business Cycle," Finance and Economics Discussion Series 2017-071 (Washington: Board of Governors of the Federal Reserve System, June), https://doi.org/10.17016/FEDS.2017.071. Return to text
9. For a discussion of labor market tightness and wage growth during the pandemic recovery, see David Autor, Arindrajit Dube, and Annie McGrew (2023), "The Unexpected Compression: Competition at Work in the Low Wage Labor Market," NBER Working Paper Series 31010 (Cambridge, Mass.: National Bureau of Economic Research, March; revised May 2024), https://www.nber.org/papers/w31010. Return to text
10. Figure C shows the 12-month moving averages of the groups' median 12-month real wage change in order to reduce noise due to sampling variation, which can be pronounced when considering disaggregated groups' wage changes. Thus, by construction, these series lag the actual real wage changes. Return to text
Gross domestic product growth has been moderate
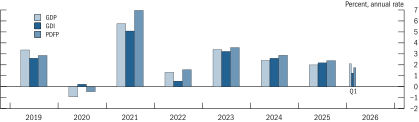
Real gross domestic product (GDP) moved up 2.1 percent at an annual rate in the first quarter of this year, about the same pace as last year (figure 18). The first-quarter gain was supported by solid growth in high-tech-related business investment and a bounceback in real federal purchases following the government shutdown in the fourth quarter of last year. However, first-quarter output growth was tempered somewhat by a decline in residential investment, by a very modest gain in consumer spending, and by the high import share of AI-related business spending, as imports are subtracted from other spending flows in the GDP calculation to isolate the value-added of domestic production.
Figure 18. Change in real gross domestic product, gross domestic income, and private domestic final purchases
Accessible Version | Return to text
Note: The key identifies bars in order from left to right. GDP is gross domestic product; GDI is gross domestic income; PDFP is private domestic final purchases.
Source: Bureau of Economic Analysis via Haver Analytics.
Among other measures of economic activity, real private domestic final purchases—which comprises consumer spending, business fixed investment, and residential investment and which is usually considered a better indicator of the underlying momentum in the economy than GDP—grew a modest 1.7 percent in the first quarter of this year, somewhat below its pace last year. In addition, gross domestic income—a measure of economic activity conceptually equivalent to GDP but estimated from the total income earned and the costs incurred in producing goods and services—increased a subdued 1.2 percent in the first quarter.
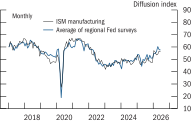
Output in the manufacturing sector has moved up strongly this year, consistent with the pickup in manufacturing new orders (figure 19). The momentum in the sector has been supported by industries producing computer and electronic products, metals, and machinery, suggesting that demand in these industries may be deriving support from AI-related investments and, in some cases, tariffs. In addition, motor vehicle production rebounded after disruptions in the supply of metals and semiconductors constrained production in the fourth quarter of 2025.
Figure 19. Manufacturing new orders
Accessible Version | Return to text
Note: The data extend through June 2026. The regional survey average comprises data from the Dallas Fed's Texas Manufacturing Outlook Survey, the Kansas City Fed's Survey of Tenth District Manufacturers, the New York Fed's Empire State Manufacturing Survey, the Philadelphia Fed's Manufacturing Business Outlook Survey, and the Richmond Fed's Fifth District Survey of Manufacturing Activity. ISM is Institute for Supply Management.
Source: Institute for Supply Management, Manufacturing Report on Business; Federal Reserve Bank of Dallas, Texas Manufacturing Outlook Survey; Federal Reserve Bank of Kansas City, Survey of Tenth District Manufacturers; Federal Reserve Bank of New York, Empire State Manufacturing Survey; Federal Reserve Bank of Philadelphia, Manufacturing Business Outlook Survey; Federal Reserve Bank of Richmond, Fifth District Survey of Manufacturing Activity; all via Haver Analytics.
Consumer spending growth has slowed
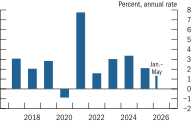
Following two years of robust gains, consumer spending growth slowed to a moderate pace of about 2 percent last year, and it slowed further over the first five months of this year, increasing at an average annualized rate of 1.3 percent (figure 20). The slowdown in consumer spending growth last year and this year can be explained in large part by a moderation in real disposable income growth, which reflects lower net immigration, easing wage growth, and the effects of tariffs and elevated gasoline prices on consumer prices. These headwinds have more than offset support from rising equity prices and the recent pickup in job growth.
Figure 20. Change in real personal consumption expenditures
Accessible Version | Return to text
Source: Bureau of Economic Analysis via Haver Analytics.
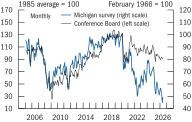
Most measures of consumer sentiment moved down after the start of the Middle East conflict, with many survey respondents pointing to elevated gasoline prices as an important factor. Most notably, the Michigan index of consumer sentiment fell to an extraordinarily low level by historical standards (figure 21). By contrast, the Conference Board measure—which relies on questions that are not as directly related to inflation—held up fairly well. In recent weeks, sentiment measures appear to have stabilized or started to rebound, likely in response to the positive news on negotiations between the U.S. and Iran and the decline in gasoline prices. In any case, in recent years low sentiment readings have not presaged particularly weak consumption growth.
Figure 21. Indexes of consumer sentiment
Accessible Version | Return to text
Note: The data extend through June 2026.
Source: University of Michigan Surveys of Consumers; Conference Board.
Broadly, household balance sheets and finances appear healthy. Aggregate wealth is high, and debt remains at moderate levels. Net worth is elevated relative to its 2019 level and has risen in recent years for households across the income distribution. Even so, there are indications that the financial situation of some households is becoming stretched. In particular, auto loan delinquency rates have increased for consumers residing in low- and moderate-income census tracts. For the first quarter, a preliminary estimate of the saving rate stood at 3.9 percent, a fair bit below its pre-pandemic level, which could be another sign of financial pressure on households.
Consumer credit flow picked up, while borrowing costs remained elevated
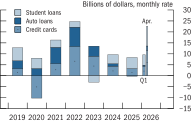
For most households, consumer credit continued to be generally available through the first quarter of 2026. After growing slowly in January and February, credit card and auto loan balances have picked up in recent months, more notably in the case of credit card loans (figure 22). However, the borrowing costs associated with these loans continued to be elevated. Auto loan rates fell slightly, on net, through May but remained somewhat above the levels seen in 2019.
Figure 22. Consumer credit flows
Accessible Version | Return to text
Note: Auto loan balances were little changed in 2025. The data are seasonally adjusted by Federal Reserve Board staff.
Source: Federal Reserve Board, Statistical Release G.19, "Consumer Credit."
Residential investment growth remains weak
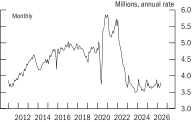
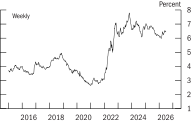
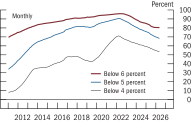
Following a decline in 2025, residential investment fell further in the first quarter of this year, and indicators suggest that activity in the housing market remained stagnant in April and May. Sales of existing homes have been trending sideways for a few years at very low levels and were little changed, on net, over the first five months of this year (figure 23). One factor likely holding down home sales is "rate lock," a phenomenon that discourages homeowners who secured mortgages at rates well below current levels from moving. Even though mortgage rates have moved down somewhat over the past couple of years, the majority of outstanding mortgages still have interest rates below 4 percent—substantially lower than the prevailing 30-year fixed interest rate of 6.4 percent (figure 24 and 25).
Figure 23. Existing home sales
Accessible Version | Return to text
Source: National Association of Realtors via Haver Analytics.
Figure 24. Mortgage interest rates
Accessible Version | Return to text
Note: The data are contract rates on 30-year, fixed-rate conventional home mortgage commitments and extend through July 1, 2026.
Source: Freddie Mac Primary Mortgage Market Survey via Haver Analytics.
Figure 25. Distribution of interest rates on outstanding mortgages
Accessible Version | Return to text
Note: The sample only includes outstanding mortgages current on their payments.
Source: ICE, McDash ®.
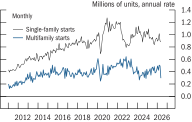
Single-family housing starts have been trending down since early 2024, as high inventories of unsold homes have forestalled new construction (figure 26). Construction of multifamily units—which are predominantly rental units—has returned to more typical levels after a wave of new construction for multifamily units broke ground from 2021 through 2023.
Figure 26. Private housing starts
Accessible Version | Return to text
Source: U.S. Census Bureau via Haver Analytics.
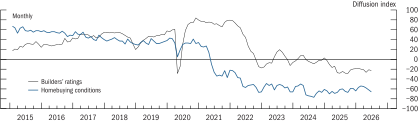
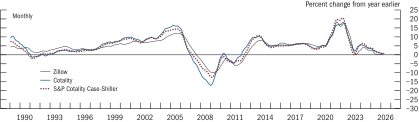
Consistent with the generally weak housing market, market sentiment is downbeat as measured by low readings for builders' ratings of new home sales and homebuyers' sentiment (figure 27). In addition, growth in house prices has slowed further (figure 28). That said, the level of house prices is still well above its pre-pandemic level.
Figure 27. Builder and homebuyer sentiment
Accessible Version | Return to text
Note: The data extend through June 2026; the June data are preliminary. The builders' ratings of new home sales series measures the percentage of respondents saying current sales conditions are good less the percentage responding conditions are poor. The Michigan survey of homebuying conditions measures the percentage of respondents saying it is a good time to buy less the percentage responding it is a bad time to buy.
Source: National Association of Home Builders (U.S.), Housing Market Index; University of Michigan Surveys of Consumers.
Figure 28. Growth rate in house prices
Accessible Version | Return to text
Note: The data for Cotality and S&P Cotality Case-Shiller extend through April 2026.
Source: Cotality, Home Price Index; Zillow, Inc., Real Estate Data; S&P Cotality Case-Shiller U.S. National Home Price Index. The S&P Cotality Case-Shiller index is a product of S&P Dow Jones Indices LLC and/or its affiliates. (For Dow Jones Indices licensing information, see the Data Notes page.)
Capital spending growth has been brisk, reflecting strong demand for investment related to artificial intelligence
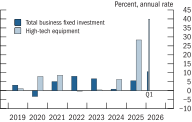
After having increased at a solid rate of 5-1/2 percent in 2025, business fixed investment moved up at a robust annual rate of 11 percent in the first quarter of this year (figure 29). Most of the strength in investment appears to be connected to building the infrastructure necessary to support AI services. Construction spending on new data centers has surged since 2022, and announced plans for future data center construction have skyrocketed. As spending on the construction of new data centers has increased, so has spending on the equipment and software required to operate them. Outside of AI-related categories, investment spending—particularly for offices and manufacturing structures—has been fairly weak on net. Still, overall investment has likely benefited from fiscal policy tailwinds following changes in 2025 to reinstate full expensing for certain types of investment.
Figure 29. Change in real business fixed investment
Accessible Version | Return to text
Note: Business fixed investment is known as "private nonresidential fixed investment" in the national income and product accounts. The key identifies bars in order from left to right.
Source: Bureau of Economic Analysis via Haver Analytics.
Drilling and mining investment contracted about 10 percent last year and has increased only modestly so far this year. While oil prices rose sharply in early March, the industry seemed cautious about ramping up investment, likely due to uncertainty about the persistence of elevated prices. That said, the number of active drilling rigs crept up from March through June.
Measures of business sentiment and measures of capital spending plans have been mixed. Analyst expectations of corporate earnings growth are strong, corporate bond spreads are at very low levels, and measures of business uncertainty from financial markets—such as the one-month option-implied volatility on the S&P 500 index, or the VIX—have returned to typical levels after spiking at the start of the Middle East conflict. However, other indicators of trade and geopolitical policy uncertainty are still quite high, and although measures of business sentiment have improved somewhat, they remain on the low side by historical standards.
Business financing conditions have been uneven
Financing conditions for large businesses remained generally accommodative, including financing conditions in capital markets. Gross nonfinancial corporate bond issuance continued at a robust pace in the first half of the year. Net issuance of investment-grade corporate bonds was particularly strong in the first quarter, in part driven by large, publicly traded tech firms, which increased their debt financing of AI infrastructure expansion. Investor sentiment in private credit markets weakened amid net outflows from semi-liquid investment vehicles, but the spillover into broader credit markets was limited.
By contrast, small business financing conditions remained somewhat restrictive. Loan originations declined somewhat, on net, while credit card borrowing by businesses steadily increased in the first half of this year. The increasing level of revolving balances on small business credit card debt, a high-cost credit option, suggests small businesses have been finding it difficult to obtain loans or credit lines from banks. Interest rates on short-term loans and credit cards have fallen somewhat in 2026, but they remain high by recent years' standards. Short-term delinquency rates have begun to tick up after moderating somewhat earlier this year; they now stand above their pre-pandemic levels.
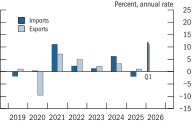
Imports and exports surged in the first quarter
Real imports and exports of goods and services jumped in the first quarter, as the AI-related trade of high-tech goods soared (figure 30). Both nominal imports and exports grew further in April, supported by continued strong trade in high-tech goods and by a jump in U.S. energy exports amid reduced foreign supplies caused by the conflict in the Middle East. All told, net exports subtracted about 0.4 percentage point from GDP growth in the first quarter, and the trade deficit as a share of GDP edged down to 2.1 percent from 2.4 percent in the second half of last year.
Figure 30. Change in real imports and exports of goods and services
Accessible Version | Return to text
Note: The key identifies bars in order from left to right.
Source: Bureau of Economic Analysis via Haver Analytics.
Federal purchases fell last year but rebounded this year
Federal purchases declined last year because of a reduction in the size of the federal workforce and the government shutdown that temporarily lowered purchases in the fourth quarter. Purchases then rebounded in the first quarter of this year as the effects of the shutdown unwound.7
The budget deficit and federal debt continue to be elevated
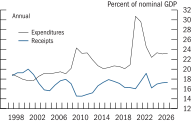
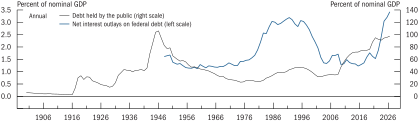
In fiscal year 2025 and so far in fiscal 2026, the federal budget deficit—the difference between federal expenditures and receipts—has been around 6 percent of GDP, little changed since fiscal 2023 and notably larger than in the years preceding the pandemic (figure 31). The elevated budget deficit results from both higher noninterest outlays that have outpaced receipts and higher debt-servicing costs that reflect elevated interest rates and a higher level of debt. Reflecting large annual deficits, the ratio of federal debt held by the public to GDP has been moving higher for some time and is now close to its historical peak at the end of World War II (figure 32).
Figure 31. Federal receipts and expenditures
Accessible Version | Return to text
Note: Through 2025, the receipts and expenditures data are on a unified-budget basis and are for fiscal years (October to September); gross domestic product (GDP) is for the 4 quarters ending in Q3. For 2026, receipts and expenditures are annualized for the first 8 months of the fiscal year; GDP is the average of 2025:Q4 and 2026:Q1.
Source: Department of the Treasury, Bureau of the Fiscal Service; Office of Management and Budget and Bureau of Economic Analysis via Haver Analytics.
Figure 32. Federal government debt and net interest outlays
Accessible Version | Return to text
Note: Federal debt held by the public equals federal debt excluding most intragovernmental debt, evaluated at the end of the quarter. Net interest outlays are the cost of servicing the debt held by the public, offset by certain types of interest income the government receives. Through 2025, federal debt data, which begin in 1900, are on a fiscal year basis; net interest outlays data, which begin in 1948, are on a unified-budget basis and are for fiscal years (October to September); and gross domestic product (GDP) is for the 4 quarters ending in Q3. For 2026, federal debt and net interest outlays are annualized for the first 8 months of the fiscal year; GDP is the average of 2025:Q4 and 2026:Q1.
Source: For GDP, Bureau of Economic Analysis via Haver Analytics; for federal debt, Congressional Budget Office and Federal Reserve Board, Statistical Release Z.1, "Financial Accounts of the United States."
State and local government revenue grew moderately
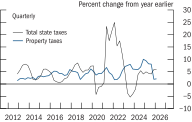
State tax revenue grew moderately last year, rising roughly in line with the broader economy (figure 33). According to the National Association of State Budget Officers, states' total balances—that is, including rainy day fund balances and previous-year surplus funds—are estimated to have declined in fiscal 2026 as a share of general fund spending but remain very elevated relative to pre-pandemic norms. At the local level, growth in property tax receipts was firm in 2025 overall, although growth moved noticeably lower at the end of the year and remained low in early 2026. While the near-term fiscal position of state and local governments remains solid in the aggregate, significant variation exists across jurisdictions.
Figure 33. State and local tax receipts
Accessible Version | Return to text
Note: Receipts shown are year-over-year percent changes of 4-quarter moving averages beginning in 2012:Q4. Property taxes are primarily collected by local governments.
Source: U.S. Census Bureau, Quarterly Summary of State and Local Government Tax Revenue.
State and local government spending growth moderated
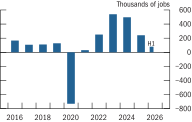
The rise in state and local government purchases moderated, on average, over 2025 and so far this year relative to the rapid pace of increase in the years immediately following the pandemic. In particular, the pace of hiring by these governments moved down from recent years, returning very roughly to the rate of jobs added during the years before the pandemic (figure 34). Real construction outlays have been edging down, though they remain elevated.
Figure 34. Change in state and local government payroll employment
Accessible Version | Return to text
Note: The annual values are the difference between the average level in one year and the average level in the previous year. 2026:H1 data are the annualized change from 2025:Q4 to 2026:Q2.
Source: Bureau of Labor Statistics via Haver Analytics.
A task force will evaluate new data sources
Achieving the Federal Reserve's dual mandate requires high-quality and timely information on economic conditions. Accordingly, the Federal Reserve has commissioned an independent task force to evaluate new information sources and consider methodological changes to improve data gathering. The ultimate goal is to provide the Federal Reserve with more accurate, relevant, contemporaneous, and, perhaps most important, actionable information on the state of the economy.
Financial Developments
The expected path of the federal funds rate shifted up notably...
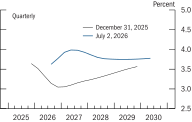
Market-based measures of the expected path of the federal funds rate showed little change early in 2026 before moving up significantly following the onset of the conflict in the Middle East (figure 35). Earlier in the year, expectations of a decline in inflation and lingering concerns about stabilization in the labor market contributed to the view that the policy rate would fall further toward estimates of its long-run neutral level. Subsequently, however, the policy rate path moved above the levels prevailing at the start of the year. Upward revisions to expectations of the path of the policy rate partly reflected assessments that the Middle East conflict would lead to higher inflation this year and increased confidence in the stability of the U.S. labor market. Federal funds futures quotes suggest that investors currently expect the federal funds rate to increase about 30 basis points above the current effective rate to around 4 percent by year-end 2026. The market-implied path of the federal funds rate also shifted higher for the period beyond 2026.
Figure 35. Market-implied federal funds rate path
Accessible Version | Return to text
Note: The federal funds rate path is implied by quotes on overnight index swaps—a derivative contract tied to the effective federal funds rate. The implied path as of December 31, 2025, is compared with that as of July 2, 2026. The path is estimated with a spline approach, assuming a term premium of 0 basis points. The December 31, 2025, path extends through 2029:Q4 and the July 2, 2026, path through 2030:Q2.
Source: Bloomberg; Federal Reserve Board staff estimates.
. . . and yields on nominal Treasury securities are higher on net
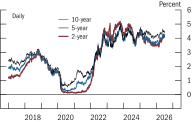
Since the beginning of the year, yields on nominal Treasury securities have increased, on net, with the largest moves concentrated at shorter maturities. The 2- and 10-year nominal Treasury yields have risen, on net, about 60 basis points and around 35 basis points, respectively (figure 36). Short-term inflation compensation increased sharply after the onset of the conflict in the Middle East but retraced later following headlines of de-escalation. Meanwhile, inflation compensation at longer horizons was a touch lower and stayed at levels consistent with the Committee's inflation objective.
Figure 36. Yields on nominal Treasury securities
Accessible Version | Return to text
Source: Department of the Treasury via Haver Analytics.
Yields on other long-term debt rose moderately on net
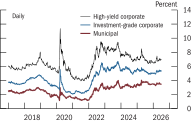
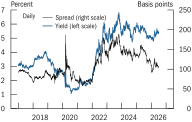
Since the start of the year, corporate bond yields across credit categories have risen moderately, while spreads over comparable-maturity Treasury securities have narrowed somewhat, remaining low by historical standards (figure 37). Meanwhile, yields on municipal bonds were roughly unchanged from the start of the year and remained at elevated levels. Yields on agency mortgage-backed securities—an important factor in the setting of home mortgage interest rates—rose modestly and recorded spreads over Treasury security rates that were little changed, on net, since the start of the year (figure 38).
Figure 37. Corporate bond yields, by securities rating, and municipal bond yield
Accessible Version | Return to text
Note: High-yield corporate reflects the effective yield of the ICE Bank of America Merrill Lynch (BofAML) High Yield Index (H0A0). Investment-grade corporate reflects the effective yield of the ICE BofAML triple-B U.S. Corporate Index (C0A4). Municipal reflects the yield to worst of the ICE BofAML U.S. Municipal Securities Index (U0A0).
Source: ICE Data Indices, LLC, used with permission.
Figure 38. Yield and spread on agency mortgage-backed securities
Accessible Version | Return to text
Note: Yield shown is for the uniform mortgage-backed securities 30-year current coupon, the coupon rate at which new mortgage-backed securities would be priced at par, or face, value for dates after May 31, 2019; for earlier dates, the yield shown is for the Fannie Mae 30-year current coupon. Spread shown is to the average of the 5-year and 10-year nominal Treasury yields.
Source: Department of the Treasury; J.P. Morgan. Courtesy of J.P. Morgan Chase & Co., Copyright 2026.
Broad equity price indexes increased, largely driven by robust corporate earnings and optimism about artificial intelligence
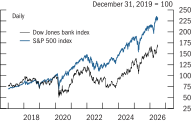
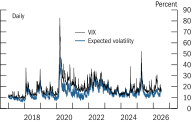
The S&P 500 equity price index has increased about 9 percent since the beginning of the year amid sizable fluctuations and reactions to news about AI-sector developments and the Middle East conflict (figure 39). Reflecting increased investor enthusiasm regarding AI technology and strong earnings growth in the sector, stock prices in the S&P 500 Information Technology industry group are up about 16 percent. The strong stock market performance occurred amid increased volatility, with large price declines from late January through late March. In early February, aggregate stock prices declined amid news about the potential of AI to disrupt certain industries and emerging concerns about over-investment in AI infrastructure. The decline continued in March, as concerns over the inflation outlook emerged from the Middle East conflict. Subsequently, stock prices recovered to reach new record highs, supported by strong corporate earnings results and improved investor risk sentiment. The VIX reached elevated levels of around 30 percent in late March but, on net, has increased only modestly since the beginning of the year and currently sits near the median of its historical distribution (figure 40). (For a discussion of financial stability issues, see the box "Developments Related to Financial Stability.")
Figure 39. Equity prices
Accessible Version | Return to text
Source: S&P Dow Jones Indices LLC via Bloomberg. (For Dow Jones Indices licensing information, see the Data Notes page.)
Figure 40. S&P 500 volatility
Accessible Version | Return to text
Note: The VIX is an option-implied volatility measure that represents the expected annualized variability of the S&P 500 index over the following 30 days. The expected volatility series shows a forecast of 1-month realized volatility, using a heterogeneous autoregressive model based on 5-minute S&P 500 returns.
Source: Cboe Volatility Index ® (VIX ®) via Bloomberg; LSEG Data & Analytics, DataScope; Federal Reserve Board staff estimates.
Box 2. Developments Related to Financial Stability
This discussion reviews vulnerabilities in the U.S. financial system. The framework used by the Federal Reserve Board for assessing the resilience of the U.S. financial system focuses on financial vulnerabilities in four broad areas: asset valuations, business and household debt, leverage in the financial sector, and funding risks.
Overall, the U.S. financial system remained sound and resilient, with vulnerabilities roughly unchanged since January. This assessment reflects elevated asset valuations, low levels of total business and household debt, strong bank capital positions, and moderate funding risk, along with high leverage of hedge funds and some strains in private credit funds.
Asset prices remained above levels consistent with their historical relationship to certain fundamentals across several major asset classes. In equity markets, the price of S&P 500 firms relative to analysts' earnings projections stayed in the upper range of its historical distribution. Measures of the equity premium increased from overall low levels late last year amid periods of higher equity and broader market volatility but remained at the lower end of their historical range. Corporate bond and loan spreads remained low by historical standards, although credit concerns increased for riskier debt and spreads widened for speculative-grade technology bonds and leveraged loans. For property markets, house price growth continued to moderate, but the ratio of house prices to rents remained well above historical norms. Commercial real estate markets showed further signs of stabilization, with little change in vacancy rates and rent growth across a broad range of property sectors.
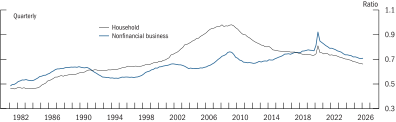
The combined debt of nonfinancial businesses and households as a share of gross domestic product stood at its lowest level since the early 2000s (figure A). Some measures of the aggregate leverage of publicly traded firms stayed high relative to their historical distributions, but solid interest coverage ratios suggest these firms remained well positioned to continue servicing their debt. Debt-servicing capacity was lower among some publicly traded non-investment-grade firms and riskier private firms, especially those relying on floating-rate debt such as leveraged loans and private credit. In the household sector, balance sheets remained strong overall, with most debt being owed by borrowers with strong credit histories. Mortgage credit risk remained low due to large home equity cushions and strong underwriting standards. That said, delinquencies on credit cards and auto loans remained above levels that have prevailed over the past decade.
Figure A. Nonfinancial business and household debt-to-GDP ratios
Accessible Version | Return to text
Note: GDP is gross domestic product.
Source: Federal Reserve Board, Statistical Release Z.1, "Financial Accounts of the United States"; Bureau of Economic Analysis, national income and product accounts; Federal Reserve Board staff calculations.
Leverage at hedge funds remained near all-time highs and was concentrated in a small number of large funds. This leverage is associated with a broad range of strategies, including those involving Treasury securities, interest rate derivatives, and equities. Leverage at the largest life insurers stayed well into the upper quartile of its historical distribution, albeit well above regulatory benchmarks. In the banking sector, regulatory measures of bank capital remained near historically high levels. Banks continued to reduce exposure to a potential rise in interest rates as their balance sheets moved toward less interest rate sensitive short-duration securities. These actions helped reduce fair value losses on banks' fixed-rate assets relative to peaks in 2022, but these losses remained sizable. Intermediation activity at broker-dealers continued to support a range of markets, including those for Treasury securities, while their leverage remained roughly unchanged, with asset-to-equity ratios slightly below their historical median.
With regard to funding risks, banks' funding profiles remain mostly unchanged since January. Uninsured deposits have declined for the banking system as a whole since early 2023, and the reduction has been most pronounced among those banks that were most reliant on this source of funding at that time. Outside of the banking system, assets in cash-management vehicles continued to grow, largely driven by government money market funds, which historically have been the least susceptible to large-scale investor redemptions. Finally, some types of private credit vehicles faced increased redemption requests triggered by concerns about reduced returns and the quality of some underlying assets. In most cases, the managers of these funds chose to accommodate redemption requests up to 5 percent of net asset value, and private credit markets continued to function normally.
Major asset markets functioned in an orderly manner
Functioning in the markets for both Treasury securities and equities has been orderly since the start of the year. That said, Treasury securities market liquidity deteriorated amid the heightened volatility following the Middle East conflict. Liquidity recovered in subsequent weeks to near-January levels. Meanwhile, liquidity conditions in equity markets have deteriorated slightly since the start of the year and have remained low, with a notable feature being a low reading on market depth—a measure of the availability of contracts at the best quoted prices. Corporate and municipal bond markets functioned in an orderly manner.
Short-term money market conditions remained stable
Conditions in overnight bank funding and repurchase agreement (repo) markets remained stable but have softened somewhat since the start of the year. The Federal Reserve continued to purchase Treasury bill securities to ensure an ample supply of reserves, and as a result, reserve balances have increased slightly since the beginning of January. The effective federal funds rate decreased, on net, by 1 basis point below the interest on reserve balances (IORB) rate to 2 basis points below the IORB rate, and other unsecured rates also decreased, with limited volatility. The Secured Overnight Financing Rate declined relative to the IORB rate and exhibited limited volatility on Treasury settlement days and quarter-ends. Over the period, there was limited uptake at the overnight reverse repurchase agreement facility or of standing repo operations. Overall, conditions in money markets suggest that reserve balances remain within the range consistent with ample reserves. (See the box "Developments in the Federal Reserve's Balance Sheet and Money Markets.")
Following the onset of the Middle East conflict, spreads on lower-rated commercial paper widened but have since returned to historically normal ranges as geopolitical tensions eased. Money market mutual funds maintained near-record levels of assets under management, as the yields they offered to potential customers continued to be more attractive than interest rates available on bank deposits.
Bank credit expanded at a strong pace
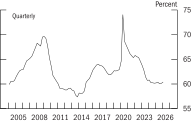
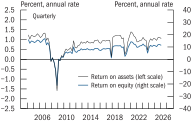
Banks' core loan holdings increased at a 5.5 percent annualized rate in the first quarter, above the growth rate in 2025, and expanded at a similar pace during the second quarter (figure 41). Banks' responses to the April 2026 Senior Loan Officer Opinion Survey on Bank Lending Practices indicated, over the first quarter of 2026, easier lending standards across loan categories for the third consecutive quarter and stronger demand, on net, for the fourth consecutive quarter, supporting the uptick in loan growth. Measures of credit quality, including loan delinquency rates and loan loss provisioning across loan categories, were little changed, on average, over the first quarter of 2026. Bank profitability measures were also little changed, on net, in the first quarter (figure 42).
Figure 41. Ratio of total commercial bank credit to nominal gross domestic product
Accessible Version | Return to text
Source: Federal Reserve Board, Statistical Release H.8, "Assets and Liabilities of Commercial Banks in the United States"; Bureau of Economic Analysis via Haver Analytics.
Figure 42. Profitability of bank holding companies
Accessible Version | Return to text
Source: Federal Reserve Board, Form FR Y-9C, Consolidated Financial Statements for Holding Companies.
The M2 measure of money grew in line with trends observed in the 2010s
A measure of the stock of money potentially has a role to play in the evaluation of financial and economic conditions. Although it is difficult to measure the stock of money in the modern economy, one of a number of series traditionally used to provide an empirical approximation to the concept of the stock of money is the M2 monetary aggregate. During the first five months of the year, M2—which consists of currency, liquid deposits (deposits readily usable in transactions), small time deposits, and retail money funds—was 4.7 percent higher, on average, than its level from a year earlier. The rates of increase in M2 seen so far this year have been closer to the range typically observed in the 2010s and stand in contrast to the first half of the current decade, which saw high double-digit growth rates of M2 followed by a period of negative growth rates. The sizable increase in the public's holdings of real money balances that took place during the pandemic has largely been unwound. In the first quarter of 2026, M2 velocity—the ratio of nominal GDP to the quarterly average of M2—was only slightly below its level in the fourth quarter of 2019.
International Developments
Foreign economic growth slowed in the first half of 2026
Economic activity abroad has been affected recently by U.S. trade policy, the AI boom, and the emergence of the Middle East conflict. Real GDP growth abroad stepped down in the first quarter from its trend pace in the second half of last year, largely reflecting a sharp contraction in Mexico and stagnant activity in Canada, with U.S. sectoral tariffs continuing to weigh on manufacturing in these economies. In most euro-area countries, growth remained lackluster, as uncertainty weighed on investment and exports continued to be weak. By contrast, economic activity in several Asian economies—particularly in Taiwan and South Korea—remained robust, on strong high-tech exports linked to soaring AI-related investment, especially in the U.S. In China, growth picked up to a solid pace, with strong exports and industrial production offsetting weakness in domestic demand.
Recent indicators point to continued subdued growth abroad in the second quarter, with the Middle East conflict and supply disruptions associated with the closure of the Strait of Hormuz weighing on activity through higher energy costs, longer supplier delivery times, and weaker confidence. These effects appear most pronounced in regions reliant on energy imports from the Middle East, particularly lower-income Asian economies. In Europe and Japan, activity indicators, including industrial production and retail sales, have also softened. At the same time, in a few Asian economies with large high-tech sectors, ongoing investment in AI capacity in the U.S. and elsewhere has continued to lift tech production and exports, helping to cushion the headwinds from the Middle East conflict.
Inflation abroad rose notably amid higher energy costs
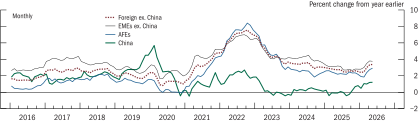
Foreign headline inflation has increased since the start of the Middle East conflict, mainly reflecting the sharp rise in retail energy prices in both advanced foreign economies (AFEs) and emerging market economies (EMEs) (figure 43). Foreign producer prices have also increased notably in recent months, especially for industries exposed to disruptions from the Middle East conflict or benefiting from strong AI-related demand. Conversely, inflation in China has remained low, at around 1 percent, as the weakness in the property sector continues to limit price pressures.
Figure 43. Consumer price inflation in foreign economies
Accessible Version | Return to text
Note: The advanced foreign economy (AFE) aggregate is the average of Canada, the euro area, Japan, and the U.K., weighted by shares of U.S. non-oil goods imports. The emerging market economy (EME) aggregate is the average of Argentina, Brazil, Chile, Colombia, Hong Kong, India, Indonesia, Israel, Malaysia, Mexico, the Philippines, Russia, Saudi Arabia, Singapore, South Korea, Taiwan, Thailand, and Vietnam, weighted by shares of U.S. non-oil goods imports. The foreign aggregate is the import-weighted average of all aforementioned economies. The inflation measure is the Harmonised Index of Consumer Prices for the euro area and the consumer price index for the other economies.
Source: Federal Reserve Board staff calculations; Haver Analytics.
Several foreign central banks raised policy rates or signaled policy tightening amid rising inflationary pressures
At the beginning of the year, market participants generally had expected foreign central banks to keep policy rates on hold or ease them modestly further, reflecting the significant progress in reestablishing price stability. Since the onset of the Middle East conflict, however, policy rate paths implied by financial market pricing indicate that markets expect AFE central banks to raise interest rates (figure 44). Indeed, several central banks, including the Bank of Japan, the European Central Bank, and the Reserve Bank of Australia, have already responded to higher inflation by raising policy rates. Meanwhile, other central banks have emphasized inflation developments and risks in their communications, along with the importance of keeping inflation expectations anchored, signaling that they might raise policy rates despite weaker growth prospects.
Figure 44. 24-month policy expectations for selected advanced foreign economies
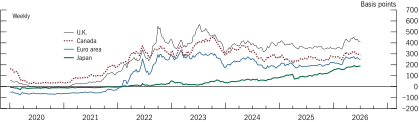
Accessible Version | Return to text
Note: The data are weekly averages of daily 24-month market-implied central bank policy rates and extend through July 2, 2026. The 24-month policy rates are implied by quotes on overnight index swaps tied to the policy rates.
Source: Bloomberg; Federal Reserve Board staff calculations.
Equity prices rose even as sovereign bond yields increased...
Since early 2026, near-dated sovereign yields have risen in many AFEs, as markets anticipated higher policy rates in response to inflationary pressures resulting from the conflict in the Middle East (figure 45). Nonetheless, most major foreign equity price indexes increased briskly, on net, in the first half of 2026, supported by improved corporate earnings, AI optimism, and strong GDP growth in higher-income Asia (figure 46). EMEs have seen notable portfolio capital outflows since the start of the conflict.
Figure 45. Nominal 2-year government bond yields in selected advanced foreign economies
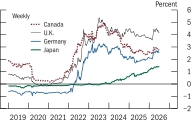
Accessible Version | Return to text
Note: The data are weekly averages of daily benchmark yields and extend through July 2, 2026.
Source: Bloomberg.
Figure 46. Equity indexes for selected foreign economies
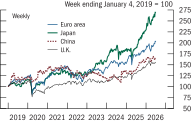
Accessible Version | Return to text
Note: The data are weekly averages of daily data and extend through July 2, 2026.
Source: For the euro area, Dow Jones Euro Stoxx Index; for Japan, Tokyo Stock Price Index; for China, Shanghai Composite Index; for the U.K., FTSE 100 Index; all via Bloomberg. (For Dow Jones Indices licensing information, see the Data Notes page.)
. . . and the exchange value of the dollar also rose modestly
Since the beginning of the year, the broad dollar index—a measure of the exchange value of the dollar against a trade-weighted basket of foreign currencies—increased modestly, on net, despite some volatility amid Middle East developments (figure 47). The dollar remained strong in real terms relative to its historical average.
Figure 47. U.S. dollar exchange rate index
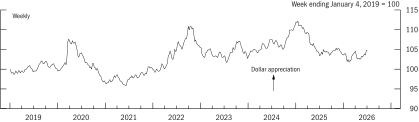
Accessible Version | Return to text
Note: The data, which are in foreign currency units per dollar, are weekly averages of daily values of the broad dollar index and extend through July 2, 2026. As indicated by the arrow, increases in the data reflect U.S. dollar appreciation and decreases reflect U.S. dollar depreciation.
Source: Federal Reserve Board, Statistical Release H.10, "Foreign Exchange Rates."
Footnotes
2. Although the trimmed mean measure is often a better predictor of future headline inflation than is core PCE (an advantage), it can provide misleading signals when the distribution of price changes shifts—a disadvantage that may have contributed to its delayed rise during the inflation surge of 2021. For a discussion of the advantages and disadvantages of the Federal Reserve Bank of Dallas's trimmed mean measure of PCE prices, see Tyler Atkinson, Jim Dolmas, and Rebecca Zarutskie (2026), "Skewness Warrants Caution as Trimmed Mean PCE Inflation Eases," Federal Reserve Bank of Dallas, Dallas Fed Economics (blog), April 16, https://www.dallasfed.org/research/economics/2026/0416. Return to text
3. In recent years, it has often been useful to assess the state of economic activity relative to a pre-pandemic benchmark. Unless otherwise indicated, mentions of "pre-pandemic" or of periods "before the pandemic" generally refer to 2019, the last full year before the onset of the pandemic.
Because energy prices can experience especially large and volatile swings, it is more helpful to focus on food prices than energy prices for longer-term assessments of household well-being. That said, the recent run-up in energy prices has undoubtedly affected low-income households. Return to text
4. In the PCE price index, computer software and accessories are classified as goods. Return to text
5. An exception among the longer-term measures is the University of Michigan Surveys of Consumers, in which the median reading of expected inflation over the next 5 to 10 years climbed from 3.3 percent in February to 3.9 percent in May. This measure, though, fell back to 3.3 percent in June and is well below the high rates that were seen for part of last year. Return to text
6. See, for example, Seth Murray and Ivan Vidangos (2026), "Labor Force Growth, Breakeven Employment, and Potential GDP Growth," FEDS Notes (Washington: Board of Governors of the Federal Reserve System, April 2), https://doi.org/10.17016/2380-7172.4045. Return to text
7. Through a decline in hours worked by federal employees, the shutdown is estimated to have directly reduced GDP growth about 1 percentage point at an annual rate in the fourth quarter of 2025, an effect that was reversed in the first quarter of 2026. Return to text