Minutes of the Federal Open Market Committee
December 11-12, 2012
In conjunction with the December 11-12, 2012, Federal Open Market Committee (FOMC) meeting, meeting participants--the 7 members of the Board of Governors and the 12 presidents of the Federal Reserve Banks, all of whom participate in the deliberations of the FOMC--submitted their assessments of real output growth, the unemployment rate, inflation, and the target federal funds rate for each year from 2012 through 2015 and over the longer run. Each participant's assessment was based on information available at the time of the meeting plus his or her judgment of appropriate monetary policy and assumptions about the factors likely to affect economic outcomes. The longer-run projections represent each participant's judgment of the value to which each variable would be expected to converge, over time, under appropriate monetary policy and in the absence of further shocks to the economy. "Appropriate monetary policy" is defined as the future path of policy that each participant deems most likely to foster outcomes for economic activity and inflation that best satisfy his or her individual interpretation of the Federal Reserve's objectives of maximum employment and stable prices.
Overall, the assessments submitted in December indicated that FOMC participants projected that, under appropriate monetary policy, the pace of economic recovery would gradually pick up over the 2012-15 period and inflation would remain subdued (table 1 and figure 1). Participants anticipated that the growth rate of real gross domestic product (GDP) would increase somewhat in 2013 and again in 2014, and that economic growth in 2014 and 2015 would exceed their estimates of the longer-run sustainable rate of growth, while the unemployment rate would decline gradually through 2015. Participants projected that each year's inflation, as measured by the annual change in the price index for personal consumption expenditures (PCE), would run close to or below the FOMC's longer-run inflation objective of 2 percent.
Table 1. Economic projections of Federal Reserve Board members and Federal Reserve Bank presidents, December 2012
Percent
| Variable | Central tendency1 | Range2 | ||||||||
|---|---|---|---|---|---|---|---|---|---|---|
| 2012 | 2013 | 2014 | 2015 | Longer run | 2012 | 2013 | 2014 | 2015 | Longer run | |
| Change in real GDP | 1.7 to 1.8 | 2.3 to 3.0 | 3.0 to 3.5 | 3.0 to 3.7 | 2.3 to 2.5 | 1.6 to 2.0 | 2.0 to 3.2 | 2.8 to 4.0 | 2.5 to 4.2 | 2.2 to 3.0 |
| September projection | 1.7 to 2.0 | 2.5 to 3.0 | 3.0 to 3.8 | 3.0 to 3.8 | 2.3 to 2.5 | 1.6 to 2.0 | 2.3 to 3.5 | 2.7 to 4.1 | 2.5 to 4.2 | 2.2 to 3.0 |
| Unemployment rate | 7.8 to 7.9 | 7.4 to 7.7 | 6.8 to 7.3 | 6.0 to 6.6 | 5.2 to 6.0 | 7.7 to 8.0 | 6.9 to 7.8 | 6.1 to 7.4 | 5.7 to 6.8 | 5.0 to 6.0 |
| September projection | 8.0 to 8.2 | 7.6 to 7.9 | 6.7 to 7.3 | 6.0 to 6.8 | 5.2 to 6.0 | 8.0 to 8.3 | 7.0 to 8.0 | 6.3 to 7.5 | 5.7 to 6.9 | 5.0 to 6.3 |
| PCE inflation | 1.6 to 1.7 | 1.3 to 2.0 | 1.5 to 2.0 | 1.7 to 2.0 | 2.0 | 1.6 to 1.8 | 1.3 to 2.0 | 1.4 to 2.2 | 1.5 to 2.2 | 2.0 |
| September projection | 1.7 to 1.8 | 1.6 to 2.0 | 1.6 to 2.0 | 1.8 to 2.0 | 2.0 | 1.5 to 1.9 | 1.5 to 2.1 | 1.6 to 2.2 | 1.8 to 2.3 | 2.0 |
| Core PCE inflation3 | 1.6 to 1.7 | 1.6 to 1.9 | 1.6 to 2.0 | 1.8 to 2.0 | 1.6 to 1.8 | 1.5 to 2.0 | 1.5 to 2.0 | 1.7 to 2.2 | ||
| September projection | 1.7 to 1.9 | 1.7 to 2.0 | 1.8 to 2.0 | 1.9 to 2.0 | 1.6 to 2.0 | 1.6 to 2.0 | 1.6 to 2.2 | 1.8 to 2.3 | ||
1. The central tendency excludes the three highest and three lowest projections for each variable in each year. Return to table
2. The range for a variable in a given year consists of all participants' projections, from lowest to highest, for that variable in that year. Return to table
3. Longer-run projections for core PCE inflation are not collected. Return to table
As shown in figure 2, most participants judged that highly accommodative monetary policy was likely to be warranted over the next few years. In particular, 14 participants thought that it would be appropriate for the first increase in the target federal funds rate to occur during 2015 or later. Most participants judged that appropriate monetary policy would include purchasing agency mortgage-backed securities (MBS) and longer-term Treasury securities after the completion of the maturity extension program at the end of 2012.
Figure 1. Central tendencies and ranges of economic projections, 2012-15 and over the longer run*
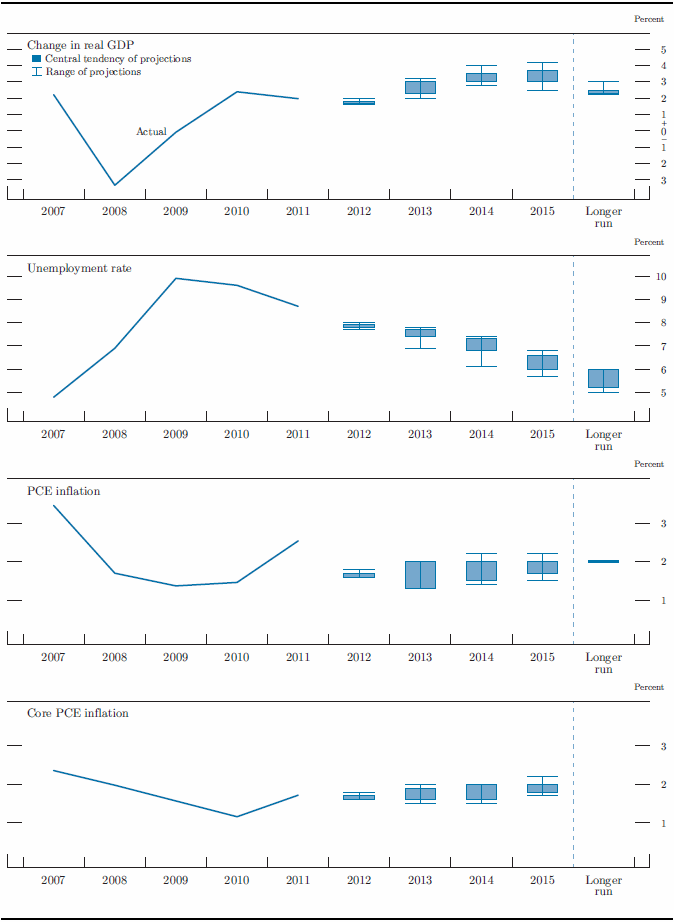
Accessible version of figure 1 | Return to figure 1
As in September, participants judged the uncertainty associated with the outlook for real activity and the unemployment rate to be unusually high compared with historical norms, with the risks weighted mainly toward slower economic growth and a higher unemployment rate. While a number of participants viewed the uncertainty surrounding their projections for inflation to be unusually high, more saw the level of uncertainty to be broadly similar to historical norms; most considered the risks to inflation to be roughly balanced.
Figure 2. Overview of FOMC participants' assessments of appropriate monetary policy, December 2012*
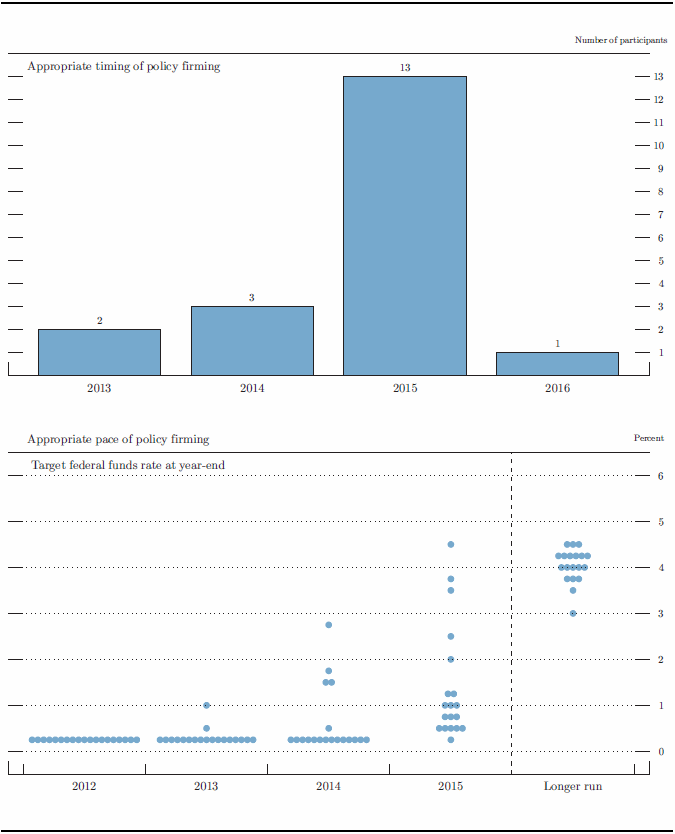
Accessible version of figure 2 | Return to figure 2
The Outlook for Economic Activity
Participants judged that the economy grew at a moderate pace over the second half of 2012 and projected that, conditional on their individual assumptions about appropriate monetary policy, the economy would grow at a somewhat faster pace in 2013 before expanding in 2014 and 2015 at a rate above what participants saw as the longer-run rate of output growth. The central tendency of their projections for the change in real GDP in 2012 was 1.7 to 1.8 percent, slightly lower than in September. A number of participants mentioned that last summer's drought and the effects of Hurricane Sandy likely had held down economic activity in the second half of this year. Many participants also noted that, while conditions in the housing and labor markets appeared to have improved recently, uncertainty about fiscal policy appeared to be holding back business and household spending. Participants' projections for 2013 through 2015 were generally little changed relative to their September projections. The central tendency of participants' projections for real GDP growth in 2013 was 2.3 to 3.0 percent, followed by a central tendency of 3.0 to 3.5 percent for 2014 and one of 3.0 to 3.7 percent for 2015. The central tendency for the longer-run rate of increase of real GDP remained 2.3 to 2.5 percent, unchanged from September. Most participants noted that the high degree of monetary policy accommodation assumed in their projections would help promote the economic recovery over the forecast period; however, they also judged that several factors would likely hold back the pace of economic expansion, including slower growth abroad, a still-weak housing market, the difficult fiscal and financial situation in Europe, and fiscal restraint in the United States.
Participants projected the unemployment rate for the final quarter of 2012 to be close to its average level in October and November, implying a rate somewhat below that projected in September. Participants anticipated a gradual decline in the unemployment rate over the forecast period; even so, they generally thought that the unemployment rate at the end of 2015 would still be well above their individual estimates of its longer-run normal level. The central tendencies of participants' forecasts for the unemployment rate were 7.4 to 7.7 percent at the end of 2013, 6.8 to 7.3 percent at the end of 2014, and 6.0 to 6.6 percent at the end of 2015. The central tendency of participants' estimates of the longer-run normal rate of unemployment that would prevail under appropriate monetary policy and in the absence of further shocks to the economy was 5.2 to 6.0 percent, unchanged from September. Most participants projected that the unemployment rate would converge to their estimates of its longer-run normal rate in five or six years, while a few judged that less time would be needed.
Figures 3.A and 3.B provide details on the diversity of participants' views regarding the likely outcomes for real GDP growth and the unemployment rate over the next three years and over the longer run. The dispersion in these projections reflects differences in participants' assessments of many factors, including appropriate monetary policy and its effects on the economy, the rate of improvement in the housing sector, the spillover effects of the fiscal and financial situation in Europe, the prospective path for U.S. fiscal policy, the extent of structural dislocations in the labor market, the likely evolution of credit and financial market conditions, and longer-term trends in productivity and the labor force. With the data for much of 2012 now in hand, the dispersion of participants' projections of real GDP growth and the unemployment rate this year narrowed compared with their September submissions. Meanwhile, the distribution of participants' forecasts for the change in real GDP in 2013 shifted down a bit, and that for 2014 narrowed slightly. However, the range of projections for real GDP growth in 2015 was little changed from September. The distributions of the unemployment rate projections at the end of 2012, 2013, and 2014 all shifted lower, while the range of projections for the unemployment rate for 2015, at 5.7 to 6.8 percent, remained close to its September level. The dispersion of estimates for the longer-run rate of output growth stayed fairly narrow, with all but one between 2.2 and 2.5 percent. The range of participants' estimates of the longer-run rate of unemployment, at 5.0 to 6.0 percent, narrowed relative to September. This range reflected different judgments among participants about several factors, including the outlook for labor force participation and the structure of the labor market.
Figure 3.A. Distribution of participants' projections for the change in real GDP, 2012-15 and over the longer run*
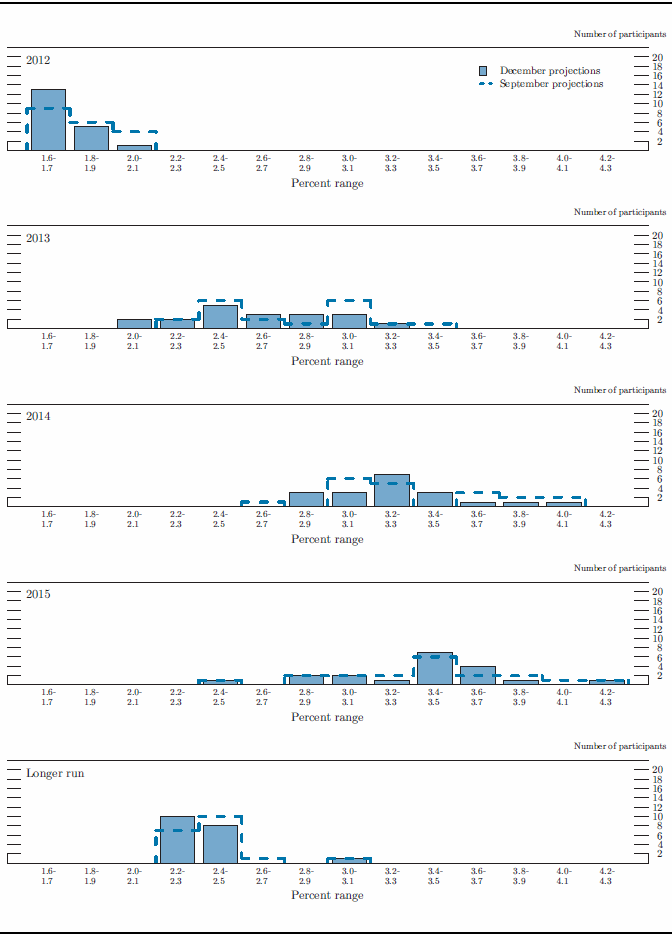
Accessible version of figure 3.A | Return to figure 3.A
The Outlook for Inflation
Participants' views on the broad outlook for inflation under appropriate monetary policy were little changed from September. Most anticipated that inflation for 2012 as a whole would be close to 1.6 percent, somewhat lower than projected in September. A number of participants remarked that recent inflation readings had come in below their expectations. Almost all of the participants judged that both headline and core inflation would remain subdued over the 2013-15 period, running at rates equal to or below the FOMC's longer-run objective of 2 percent. Specifically, the central tendency of participants' projections for inflation, as measured by the PCE price index, moved down to 1.3 to 2.0 percent for 2013 and was little changed for 2014 and 2015 at 1.5 to 2.0 percent and 1.7 to 2.0 percent, respectively. The central tendencies of the forecasts for core inflation were broadly similar to those for the headline measure for 2013 through 2015. In discussing factors likely to sustain low inflation, several participants cited stable inflation expectations and expectations for continued sizable resource slack.
Figure 3.B. Distribution of participants' projections for the unemployment rate, 2012–15 and over the longer run*
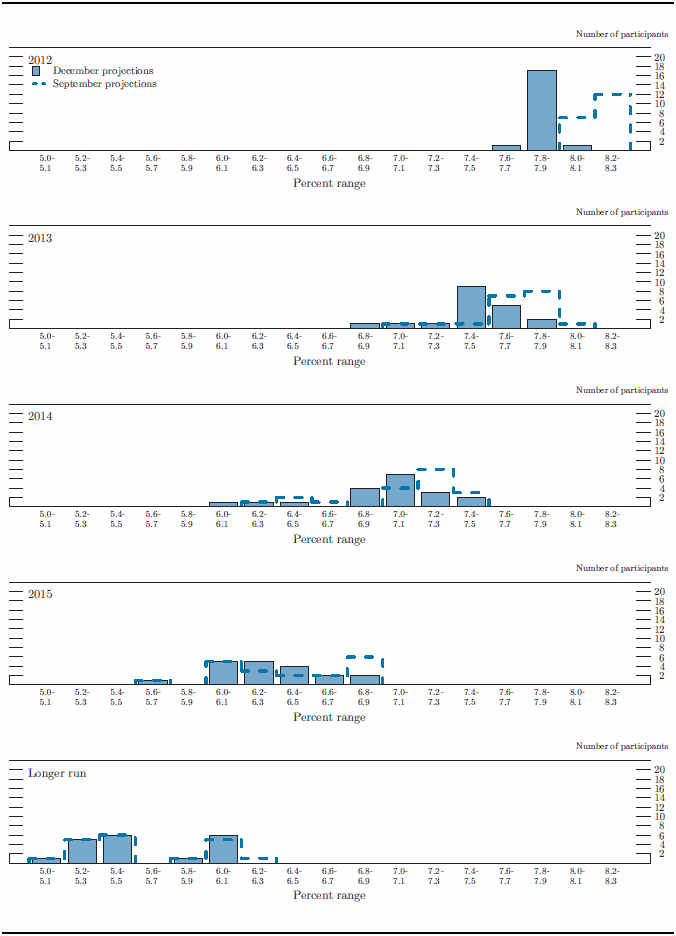
Accessible version of figure 3.B | Return to figure 3.B
Figures 3.C and 3.D provide information about the diversity of participants' views about the outlook for inflation. The range of participants' projections for headline inflation for 2012 narrowed from 1.5 to 1.9 percent in September to 1.6 to 1.8 percent in December; nearly all participants' projections in December were at 1.6 percent or 1.7 percent, broadly in line with recent inflation readings. The distributions of participants' projections for headline inflation in 2013 and 2014 shifted lower compared with the corresponding distributions for September, while the range of projections for core inflation narrowed slightly for both years. The distributions for core and overall inflation in 2015 were concentrated near the Committee's longer-run inflation objective of 2 percent, although somewhat less so than in September.
Figure 3.C. Distribution of participants' projections for PCE inflation, 2012-15 and over the longer run*
Accessible version of figure 3.C | Return to figure 3.C
Appropriate Monetary Policy
As indicated in figure 2, most participants judged that exceptionally low levels of the federal funds rate would remain appropriate for several more years. In particular, 13 participants thought that the first increase in the target federal funds rate would not be warranted until 2015, and 1 judged that policy firming would likely not be appropriate until 2016 (upper panel). The 13 participants who expected that the target federal funds rate would not move above its effective lower bound until 2015 thought the federal funds rate would be 1-1/4 percent or lower at the end of that year, while the 1 participant who expected that policy firming would commence in 2016 saw the federal funds rate target at 50 basis points at the end of that year. Five participants judged that an earlier increase in the federal funds rate, in 2013 or 2014, would be most consistent with the Committee's statutory mandate. Those participants judged that the appropriate value for the federal funds rate would range from 1/2 to 2-3/4 percent at the end of 2014 and from 2 to 4-1/2 percent at the end of 2015.
Among the participants who saw a later tightening of policy, a majority indicated that they believed it was appropriate to maintain the current level of the federal funds rate until the unemployment rate is less than or equal to 6-1/2 percent. In contrast, a majority of those who favored an earlier tightening of policy pointed to concerns about inflation as a primary reason for expecting that it would be appropriate to tighten policy sooner. Participants were about evenly split between those who judged the appropriate path for the federal funds rate to be unchanged relative to September and those who saw the appropriate path as lower.
Figure 3.D. Distribution of participants' projections for core PCE inflation, 2012-15*
Accessible version of figure 3.D | Return to figure 3.D
Nearly all participants saw the appropriate target for the federal funds rate at the end of 2015 as still well below its expected longer-run value. Estimates of the longer-run target federal funds rate ranged from 3 to 4-1/2 percent, reflecting the Committee's inflation objective of 2 percent and participants' judgments about the longer-run equilibrium level of the real federal funds rate.
Participants also provided information on their views regarding the appropriate path of the Federal Reserve's balance sheet. Most participants thought it was appropriate for the Committee to continue purchasing MBS and longer-term Treasury securities after completing the maturity extension program at the end of this year. In their projections, taking into account the likely benefits and costs of purchases as well as the expected evolution of the outlook, these participants were approximately evenly divided between those who judged that it would likely be appropriate for the Committee to complete its asset purchases sometime around the middle of 2013 and those who judged that it would likely be appropriate for the asset purchases to continue beyond that date. In contrast, several participants believed the Committee would best foster its dual objectives by ending its purchases of Treasury securities or all of its asset purchases at the end of this year when the maturity extension program was completed.
Key factors informing participants' views of the economic outlook and the appropriate setting for monetary policy include their judgments regarding labor market conditions that would be consistent with maximum employment, the extent to which employment currently deviated from maximum employment, the extent to which projected inflation over the medium term deviated from the Committee's longer-term objective of 2 percent, and participants' projections of the likely time horizon necessary to return employment and inflation to mandate-consistent levels. Many participants mentioned economic thresholds based on the unemployment rate and the inflation outlook that were consistent with their judgments of when it would be appropriate to consider beginning to raise the federal funds rate. A couple of participants noted that their assessments of the appropriate path for the federal funds rate took into account the likelihood that the neutral level of the federal funds rate was somewhat below its historical norm. There was some concern expressed that a protracted period of very accommodative monetary policy could lead to imbalances in the financial system. It was also noted that because the appropriate stance of monetary policy is conditional on the evolution of real activity and inflation over time, assessments of the appropriate future path of the federal funds rate and the balance sheet could change if economic conditions were to evolve in an unexpected manner.
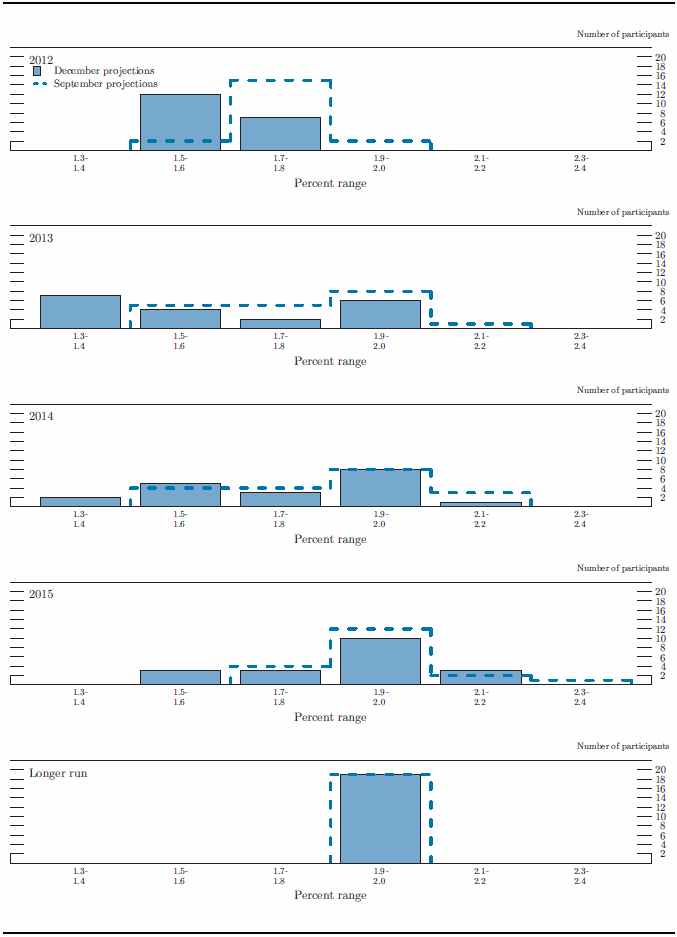
Figure 3.E details the distribution of participants' judgments regarding the appropriate level of the target federal funds rate at the end of each calendar year from 2012 to 2015 and over the longer run. As previously noted, most participants judged that economic conditions would warrant maintaining the current low level of the federal funds rate until 2015. Views on the appropriate level of the federal funds rate by the end of 2015 varied, with 12 participants seeing the appropriate level of the federal funds rate as 1 percent or lower and 4 of them seeing the appropriate level as 2-1/2 percent or higher. Generally, the participants who judged that a longer period of very accommodative monetary policy would be appropriate were those who projected that a sizable gap between the unemployment rate and the longer-run normal level of the unemployment rate would persist until 2015 or later. In contrast, the majority of the 5 participants who judged that policy firming should begin in 2013 or 2014 indicated that the Committee would need to act relatively soon in order to keep inflation near the FOMC's longer-run objective of 2 percent and to prevent a rise in inflation expectations.
Figure 3.E. Distribution of participants' projections for the target federal funds rate, 2012-15 and over the longer run*
Accessible version of figure 3.E | Return to figure 3.E
Uncertainty and Risks
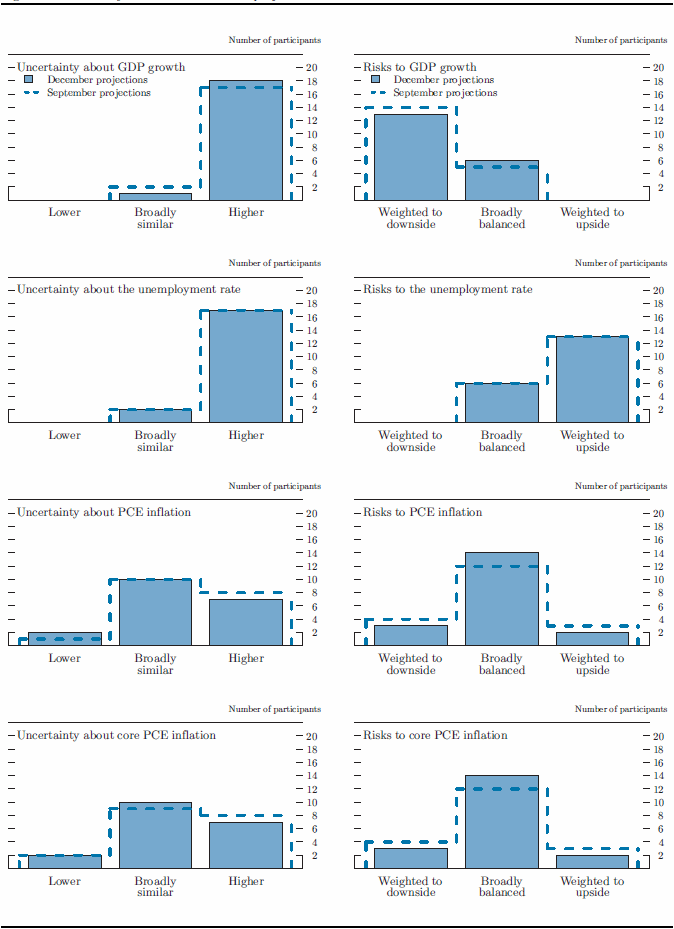
Nearly all of the participants judged their current levels of uncertainty about real GDP growth and unemployment to be higher than was the norm during the previous 20 years (figure 4).1 Seven participants judged that the levels of uncertainty associated with their forecasts of total PCE inflation were higher as well, while another 10 participants viewed uncertainty about inflation as broadly similar to historical norms. The main factors cited as contributing to the elevated uncertainty about economic outcomes were the difficulties involved in predicting fiscal policy in the United States, the continuing potential for European developments to threaten financial stability, and the possibility of a general slowdown in global economic growth. As in September, participants noted the challenges associated with forecasting the path of the U.S. economic recovery following a financial crisis and recession that differed markedly from recent historical experience. A number of participants also commented that in the aftermath of the financial crisis, they were more uncertain about the level of potential output and its rate of growth. It was noted that some of the uncertainty about potential output arose from the risk that a continuation of elevated levels of long-term unemployment might impair the skills of the affected individuals or cause some of them to drop out of the labor force, thereby reducing potential output in the medium term.
Table 2. Average historical projection error ranges
Percentage points
| Variable | 2012 | 2013 | 2014 | 2015 |
|---|---|---|---|---|
| Change in real GDP1 | ±0.6 | ±1.4 | ±1.7 | ±1.7 |
| Unemployment rate1 | ±0.2 | ±0.9 | ±1.5 | ±1.9 |
| Total consumer prices2 | ±0.5 | ±0.9 | ±1.1 | ±1.0 |
Note: Error ranges shown are measured as plus or minus the root mean squared error of projections for 1992 through 2011 that were released in the summer by various private and government forecasters. As described in the box "Forecast Uncertainty," under certain assumptions, there is about a 70 percent probability that actual outcomes for real GDP, unemployment, and consumer prices will be in ranges implied by the average size of projection errors made in the past. Further information is in David Reifschneider and Peter Tulip (2007), "Gauging the Uncertainty of the Economic Outlook from Historical Forecasting Errors," Finance and Economics Discussion Series 2007-60 (Washington: Board of Governors of the Federal Reserve System, November).
1. Definitions of variables are in the general note to table 1. Return to table
2. Measure is the overall consumer price index, the price measure that has been most widely used in government and private economic forecasts. Projection is percent change, fourth quarter of the previous year to the fourth quarter of the year indicated. Return to table
A majority of participants reported that they saw the risks to their forecasts of real GDP growth as weighted toward the downside and, accordingly, the risks to their projections of the unemployment rate as tilted to the upside. The most frequently identified sources of risk were U.S. fiscal policy, which many participants thought had the potential to slow economic activity significantly over the near term, and the situation in Europe.
Most participants continued to judge the risks to their projections for inflation as broadly balanced, with several highlighting the recent stability of longer-term inflation expectations. However, three participants saw the risks to inflation as tilted to the downside, reflecting, for example, risks of disinflation that could arise from adverse shocks to the economy that policy would have limited scope to offset. A couple of participants saw the risks to inflation as weighted to the upside in light of concerns about U.S. fiscal imbalances, the current highly accommodative stance of monetary policy, and uncertainty about the Committee's ability to shift to a less accommodative policy stance when it becomes appropriate to do so.
Figure 4. Uncertainty and risks in economic projections*
Accessible version of figure 4 | Return to figure 4
The economic projections provided by the members of the Board of Governors and the presidents of the Federal Reserve Banks inform discussions of monetary policy among policymakers and can aid public understanding of the basis for policy actions. Considerable uncertainty attends these projections, however. The economic and statistical models and relationships used to help produce economic forecasts are necessarily imperfect descriptions of the real world, and the future path of the economy can be affected by myriad unforeseen developments and events. Thus, in setting the stance of monetary policy, participants consider not only what appears to be the most likely economic outcome as embodied in their projections, but also the range of alternative possibilities, the likelihood of their occurring, and the potential costs to the economy should they occur.
Table 2 summarizes the average historical accuracy of a range of forecasts, including those reported in past Monetary Policy Reports and those prepared by the Federal Reserve Board's staff in advance of meetings of the Federal Open Market Committee. The projection error ranges shown in the table illustrate the considerable uncertainty associated with economic forecasts. For example, suppose a participant projects that real gross domestic product (GDP) and total consumer prices will rise steadily at annual rates of, respectively, 3 percent and 2 percent. If the uncertainty attending those projections is similar to that experienced in the past and the risks around the projections are broadly balanced, the numbers reported in table 2 would imply a probability of about 70 percent that actual GDP would expand within a range of 2.4 to 3.6 percent in the current year, 1.6 to 4.4 percent in the second year, and 1.3 to 4.7 percent in the third and fourth years. The corresponding 70 percent confidence intervals for overall inflation would be 1.5 to 2.5 percent in the current year, 1.1 to 2.9 percent in the second year, 0.9 to 3.1 percent in the third year, and 1.0 to 3.0 percent in the fourth year.
Because current conditions may differ from those that prevailed, on average, over history, participants provide judgments as to whether the uncertainty attached to their projections of each variable is greater than, smaller than, or broadly similar to typical levels of forecast uncertainty in the past, as shown in table 2. Participants also provide judgments as to whether the risks to their projections are weighted to the upside, are weighted to the downside, or are broadly balanced. That is, participants judge whether each variable is more likely to be above or below their projections of the most likely outcome. These judgments about the uncertainty and the risks attending each participant's projections are distinct from the diversity of participants' views about the most likely outcomes. Forecast uncertainty is concerned with the risks associated with a particular projection rather than with divergences across a number of different projections.
As with real activity and inflation, the outlook for the future path of the federal funds rate is subject to considerable uncertainty. This uncertainty arises primarily because each participant's assessment of the appropriate stance of monetary policy depends importantly on the evolution of real activity and inflation over time. If economic conditions evolve in an unexpected manner, then assessments of the appropriate setting of the federal funds rate would change from that point forward.