Minutes of the Federal Open Market Committee
March 18-19, 2014
In conjunction with the March 18-19, 2014, Federal Open Market Committee (FOMC) meeting, meeting participants--the 4 members of the Board of Governors and the 12 presidents of the Federal Reserve Banks, all of whom participated in the deliberations--submitted their assessments of real output growth, the unemployment rate, inflation, and the target federal funds rate for each year from 2014 through 2016 and over the longer run. Each participant's assessment was based on information available at the time of the meeting plus his or her judgment of appropriate monetary policy and assumptions about the factors likely to affect economic outcomes. The longer-run projections represent each participant's judgment of the value to which each variable would be expected to converge, over time, under appropriate monetary policy and in the absence of further shocks to the economy. "Appropriate monetary policy" is defined as the future path of policy that each participant deems most likely to foster outcomes for economic activity and inflation that best satisfy his or her individual interpretation of the Federal Reserve's objectives of maximum employment and stable prices.
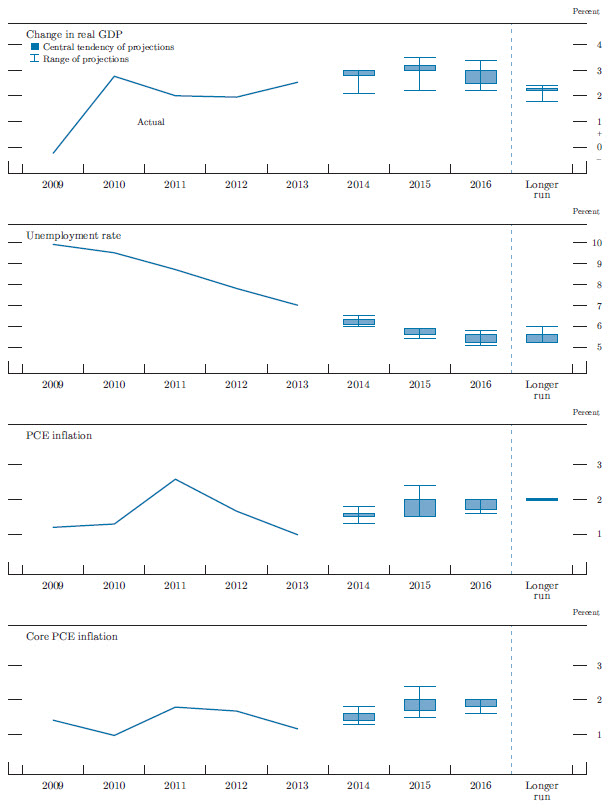
Overall, FOMC participants expected that, under appropriate monetary policy, economic growth would pick up this year and next, before moving down a bit but remaining above its longer-run rate in 2016, and that the unemployment rate would decline gradually toward its longer-run normal level over the projection period (table 1 and figure 1). Almost all of the participants projected that inflation, as measured by the annual change in the price index for personal consumption expenditures (PCE), would rise steadily to a level at or slightly below the Committee's 2 percent objective in 2016.
Table 1. Economic projections of Federal Reserve Board members and Federal Reserve Bank presidents, March 2014
Percent
| Variable | Central tendency1 | Range2 | ||||||
|---|---|---|---|---|---|---|---|---|
| 2014 | 2015 | 2016 | Longer run | 2014 | 2015 | 2016 | Longer run | |
| Change in real GDP | 2.8 to 3.0 | 3.0 to 3.2 | 2.5 to 3.0 | 2.2 to 2.3 | 2.1 to 3.0 | 2.2 to 3.5 | 2.2 to 3.4 | 1.8 to 2.4 |
| December projection | 2.8 to 3.2 | 3.0 to 3.4 | 2.5 to 3.2 | 2.2 to 2.4 | 2.2 to 3.3 | 2.2 to 3.6 | 2.1 to 3.5 | 1.8 to 2.5 |
| Unemployment rate | 6.1 to 6.3 | 5.6 to 5.9 | 5.2 to 5.6 | 5.2 to 5.6 | 6.0 to 6.5 | 5.4 to 5.9 | 5.1 to 5.8 | 5.2 to 6.0 |
| December projection | 6.3 to 6.6 | 5.8 to 6.1 | 5.3 to 5.8 | 5.2 to 5.8 | 6.2 to 6.7 | 5.5 to 6.2 | 5.0 to 6.0 | 5.2 to 6.0 |
| PCE inflation | 1.5 to 1.6 | 1.5 to 2.0 | 1.7 to 2.0 | 2.0 | 1.3 to 1.8 | 1.5 to 2.4 | 1.6 to 2.0 | 2.0 |
| December projection | 1.4 to 1.6 | 1.5 to 2.0 | 1.7 to 2.0 | 2.0 | 1.3 to 1.8 | 1.4 to 2.3 | 1.6 to 2.2 | 2.0 |
| Core PCE inflation3 | 1.4 to 1.6 | 1.7 to 2.0 | 1.8 to 2.0 | 1.3 to 1.8 | 1.5 to 2.4 | 1.6 to 2.0 | ||
| December projection | 1.4 to 1.6 | 1.6 to 2.0 | 1.8 to 2.0 | 1.3 to 1.8 | 1.5 to 2.3 | 1.6 to 2.2 | ||
Note: Projections of change in real gross domestic product (GDP) and projections for both measures of inflation are from the fourth quarter of the previous year to the fourth quarter of the year indicated. PCE inflation and core PCE inflation are the percentage rates of change in, respectively, the price index for personal consumption expenditures (PCE) and the price index for PCE excluding food and energy. Projections for the unemployment rate are for the average civilian unemployment rate in the fourth quarter of the year indicated. Each participant’s projections are based on his or her assessment of appropriate monetary policy. Longer-run projections represent each participant's assessment of the rate to which each variable would be expected to converge under appropriate monetary policy and in the absence of further shocks to the economy. The December projections were made in conjunction with the meeting of the Federal Open Market Committee on December 17-18, 2013.
1. The central tendency excludes the three highest and three lowest projections for each variable in each year. Return to table
2. The range for a variable in a given year includes all participants' projections, from lowest to highest, for that variable in that year. Return to table
3. Longer-run projections for core PCE inflation are not collected. Return to table
Figure 1. Central tendencies and ranges of economic projections, 2014-16 and over the longer run*
Accessible version of figure 1 | Return to figure 1
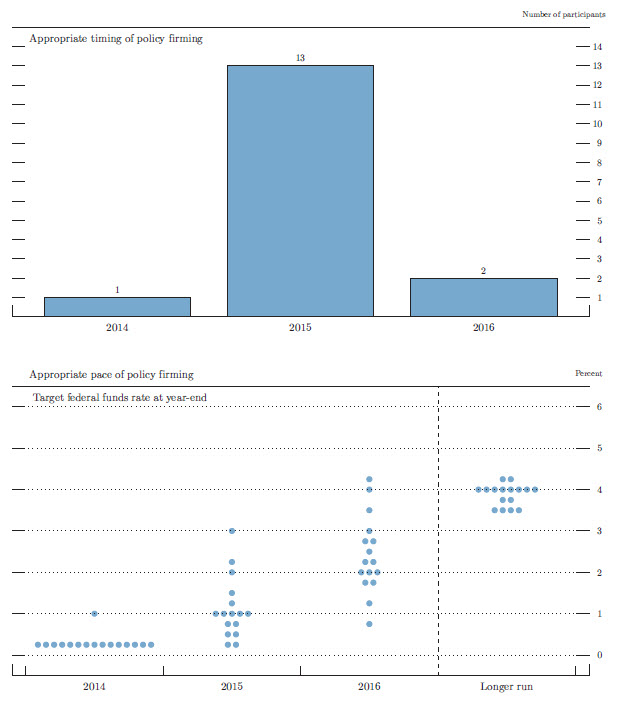
Most participants expected that highly accommodative monetary policy would remain warranted over the next few years to foster progress toward the Federal Reserve's longer-run objectives. As shown in figure 2, all but one of the participants projected that it would be appropriate to wait until 2015 or later before beginning to increase the federal funds rate, and a large majority projected that it would then be appropriate to raise the target federal funds rate fairly gradually. Almost all participants viewed appropriate policy as broadly consistent with continued gradual slowing in the pace of the Committee's purchases of longer-term securities and the completion of the program in the second half of this year.
Figure 2. Overview of FOMC participants' assessments of appropriate monetary policy*
Accessible version of figure 2 | Return to figure 2
Most participants saw the uncertainty associated with their outlooks for economic growth and the unemployment rate as similar to that of the past 20 years, and a majority saw the uncertainty associated with their projections for inflation as similar to that of the past 20 years. In addition, most participants considered the risks to the outlook for real gross domestic product (GDP), the unemployment rate, and inflation to be broadly balanced, although some saw the risks to their inflation forecasts as tilted to the downside.
The Outlook for Economic Activity
Participants generally projected that, conditional on their individual assumptions about appropriate monetary policy, real GDP growth would pick up gradually this year and next to a pace somewhat exceeding their estimates of the longer-run normal rate of output growth. Subsequently, in 2016, real GDP growth was projected to begin to move back toward its longer-run rate. Most participants revised down a bit their projections of real GDP growth for 2014, compared with their projections in December 2013, and the top end of the central tendencies for output growth in each year and over the longer run moved down slightly. Nonetheless, participants pointed to a number of factors that they expected would contribute to a pickup in economic growth this year, such as an easing of the headwinds that have been weighing on growth, including diminished restraint from fiscal policy; rising household net worth and highly accommodative monetary policy also were expected to contribute. In addition, many attributed some of the softness in recent economic data to the transitory effects of unusually severe winter weather. The central tendencies of participants' projections for real GDP growth were 2.8 to 3.0 percent in 2014, 3.0 to 3.2 percent in 2015, and 2.5 to 3.0 percent in 2016. The central tendency for the longer-run normal rate of growth of real GDP was 2.2 to 2.3 percent.
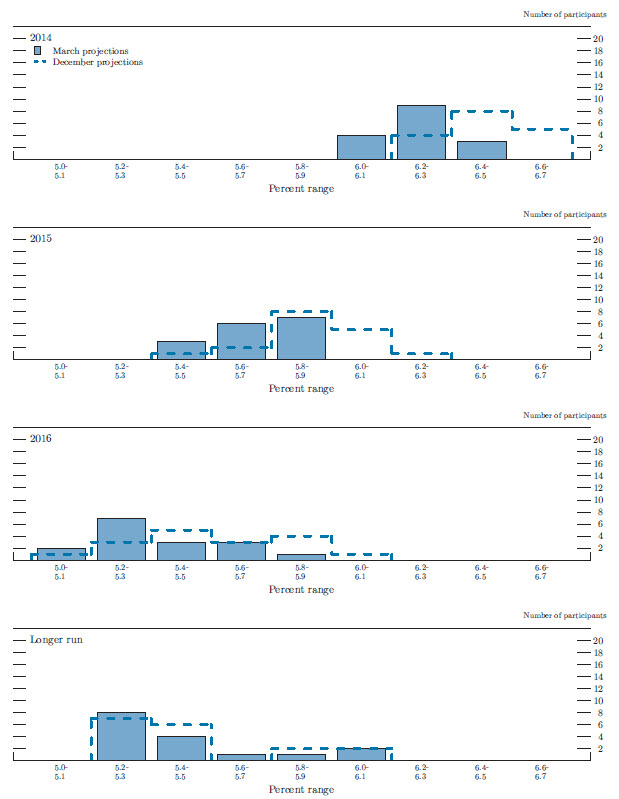
Participants anticipated a gradual decline in the unemployment rate over the projection period. The central tendencies of participants' forecasts for the unemployment rate in the fourth quarter of each year were 6.1 to 6.3 percent in 2014, 5.6 to 5.9 percent in 2015, and 5.2 to 5.6 percent in 2016. Nearly all participants revised down their projected paths for the unemployment rate relative to their December projections, with some pointing to the decline in the unemployment rate in recent months. The central tendency of participants' estimates of the longer-run normal rate of unemployment that would prevail under appropriate monetary policy and in the absence of further shocks to the economy also moved lower, to 5.2 to 5.6 percent. A majority of participants projected that the unemployment rate would be close to their individual estimates of its longer-run level at the end of 2016.
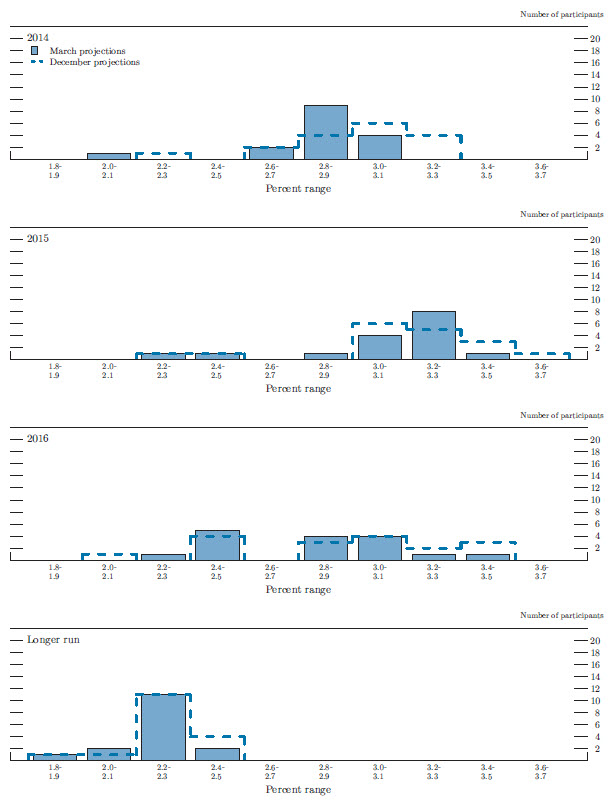
Figures 3.A and 3.B show that participants continued to hold a range of views regarding the likely outcomes for real GDP growth and the unemployment rate over the next two years. The diversity of views reflected their individual assessments of the rate at which the headwinds that have been holding back the pace of the economic recovery would abate, the anticipated path for foreign economic activity, the trajectory for growth in household net worth, and the appropriate path of monetary policy. Relative to December, the dispersions of participants' projections for real GDP growth and the unemployment rate over the period from 2014 to 2016 narrowed slightly.
Figure 3.A. Distribution of participants' projections for the change in real GDP, 2014-16 and over the longer run*
Accessible version of figure 3.A | Return to figure 3.A
Figure 3.B. Distribution of participants' projections for the unemployment rate, 2014-16 and over the longer run*
Accessible version of figure 3.B | Return to figure 3.B
The Outlook for Inflation
Participants' views on the broad outlook for inflation under the assumption of appropriate monetary policy were nearly unchanged, on balance, from those in their December projections. All participants anticipated that, on average, both headline and core inflation would rise gradually over the next few years, and a large majority of participants expected headline inflation to be at or slightly below the Committee's 2 percent objective in 2016. Specifically, the central tendencies for PCE inflation were 1.5 to 1.6 percent in 2014, 1.5 to 2.0 percent in 2015, and 1.7 to 2.0 percent in 2016. The central tendencies of the forecasts for core inflation were broadly similar to those for the headline measure. A number of participants viewed the combination of stable inflation expectations and steadily diminishing resource slack as likely to contribute to a gradual rise of inflation back toward the Committee's longer-run objective.
Figures 3.C and 3.D provide information on the diversity of participants' views about the outlook for inflation. The ranges of participants' projections for overall inflation were little changed relative to December. The forecasts for PCE inflation in 2016 were at or below the Committee's longer-run objective. Similar to the projections for headline inflation, the projections for core inflation in 2016 were also concentrated near 2 percent.
Figure 3.C. Distribution of participants' projections for PCE inflation, 2014-16 and over the longer run*
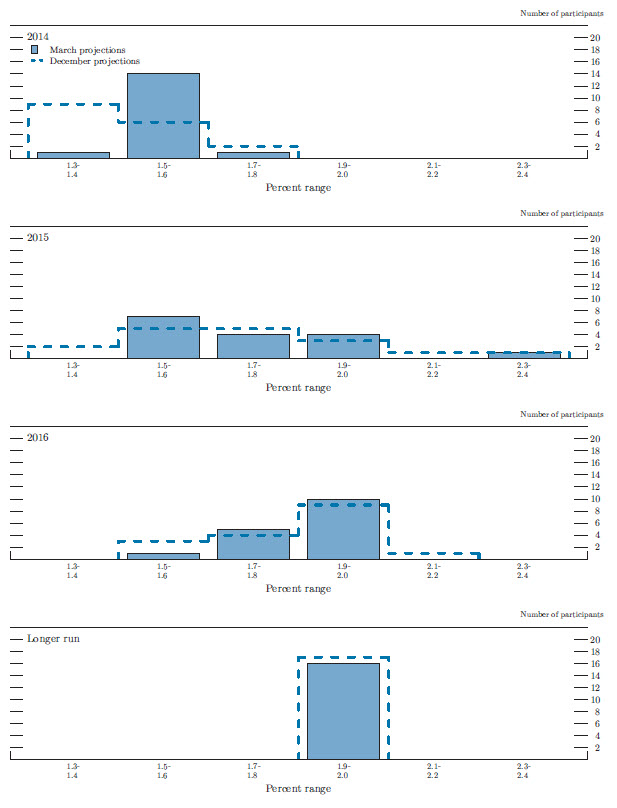
Accessible version of figure 3.C | Return to figure 3.C
Figure 3.D. Distribution of participants' projections for core PCE inflation, 2014-16*
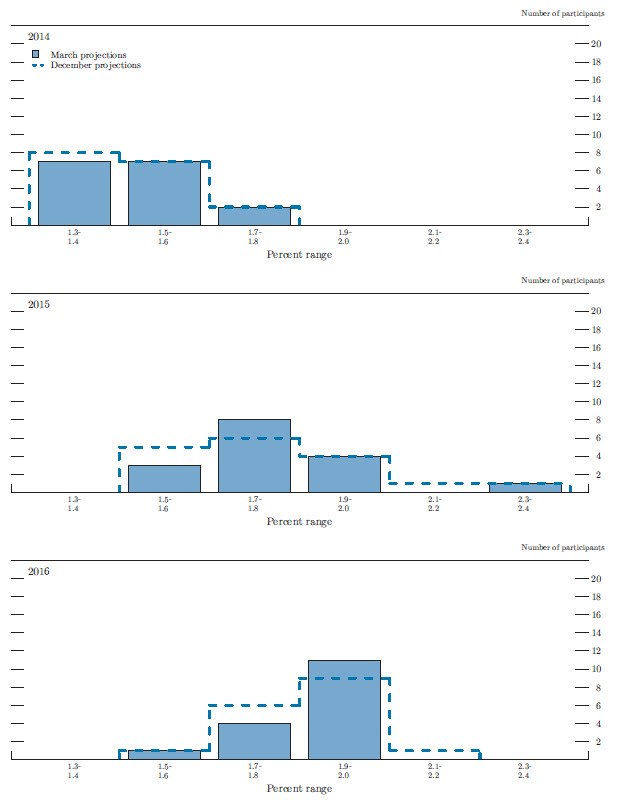
Accessible version of figure 3.D | Return to figure 3.D
Appropriate Monetary Policy
As indicated in figure 2, most participants judged that very low levels of the federal funds rate would remain appropriate for the next few years. In particular, 13 participants thought that the first increase in the target federal funds rate would not be warranted until sometime in 2015, and two judged that policy firming would likely not be appropriate until 2016. Only one participant thought that an increase in the federal funds rate would be appropriate in 2014.
All participants but one projected that the unemployment rate would be below 6 percent at the end of the year in which they currently anticipate that it will become appropriate to raise the federal funds rate above its effective lower bound. Moreover, all but one projected that inflation would be at or below the Committee's longer-run objective at that time. Most participants projected that the unemployment rate would remain above their estimates of its longer-run normal level at the end of the year in which they saw the federal funds rate increasing from its effective lower bound.
Figure 3.E provides the distribution of participants' judgments regarding the appropriate level of the target federal funds rate at the end of each calendar year from 2014 to 2016 and over the longer run. As noted earlier, almost all participants judged that economic conditions would warrant maintaining the current exceptionally low level of the federal funds rate until 2015. The median value of the rate at the end of 2015 and 2016 increased 25 and 50 basis points, respectively, since December, while the mean values increased 7 and 25 basis points, respectively. The dispersion of projections for the value of the federal funds rate in each year narrowed slightly. Almost all participants expected that the federal funds rate at the end of 2016 would still be below their individual assessments of its longer-run level, with many pointing to subdued inflation pressures, below-mandate inflation, the still-noticeable effects of headwinds, or the need to maintain low rates to support the recovery as reasons to keep the federal funds rate low at that time. Estimates of the longer-run target for the federal funds rate ranged from 3-1/2 to about 4-1/4 percent, reflecting the Committee's inflation objective of 2 percent and participants' individual judgments about the appropriate longer-run level of the real federal funds rate in the absence of further shocks to the economy.
Figure 3.E. Distribution of participants' projections for the target federal funds rate, 2014-16 and over the longer run*
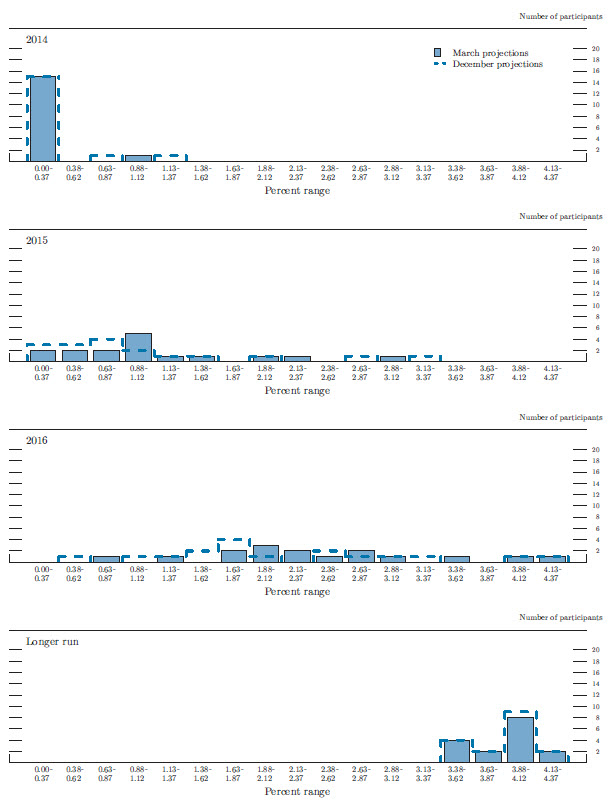
Accessible version of figure 3.E | Return to figure 3.E
Participants also described their views regarding the appropriate path of the Federal Reserve's balance sheet. Conditional on their respective economic outlooks, almost all participants judged that it would be appropriate to continue to reduce the pace of the Committee's purchases of longer-term securities in measured steps and to conclude purchases in the second half of this year. Two participants projected a more rapid reduction in the pace of purchases and an earlier end to the asset purchase program.
Participants' views of the appropriate path for monetary policy were informed by their judgments about the state of the economy, including the values of the unemployment rate and other labor market indicators that would be consistent with maximum employment, the extent to which the economy was currently falling short of maximum employment, the prospects for inflation to reach the Committee's longer-term objective of 2 percent, and the balance of risks around the outlook. A couple of participants also mentioned using various monetary policy rules to guide their thinking on the appropriate path for the federal funds rate.
Uncertainty and Risks
Nearly all participants continued to judge the levels of uncertainty about their projections for real GDP growth and the unemployment rate as broadly similar to the norm during the previous 20 years (figure 4).1 As in December, most participants continued to judge the risks to real GDP growth and the unemployment rate to be broadly balanced. Two participants viewed risks to output growth as weighted to the downside, reflecting their concerns about possible geopolitical developments and the strength of external demand.
Table 2. Average historical projection error ranges
Percentage points
| Variable | 2014 | 2015 | 2016 |
|---|---|---|---|
| Change in real GDP1 | ±1.6 | ±2.1 | ±2.0 |
| Unemployment rate1 | ±0.6 | ±1.2 | ±1.7 |
| Total consumer prices2 | ±0.9 | ±1.0 | ±1.1 |
Note: Error ranges shown are measured as plus or minus the root mean squared error of projections for 1994 through 2013 that were released in the spring by various private and government forecasters. As described in the box "Forecast Uncertainty," under certain assumptions, there is about a 70 percent probability that actual outcomes for real GDP, unemployment, and consumer prices will be in ranges implied by the average size of projection errors made in the past. For more information, see David Reifschneider and Peter Tulip (2007), "Gauging the Uncertainty of the Economic Outlook from Historical Forecasting Errors," Finance and Economics Discussion Series 2007-60 (Washington: Board of Governors of the Federal Reserve System, November); and Board of Governors of the Federal Reserve System, Division of Research and Statistics (2014), "Updated Historical Forecast Errors (PDF)," memorandum, April 9.
1. Definitions of variables are in the general note to table 1. Return to table
2. Measure is the overall consumer price index, the price measure that has been most widely used in government and private economic forecasts. Projection is percent change, fourth quarter of the previous year to the fourth quarter of the year indicated. Return to table
Almost all participants saw the level of uncertainty and the balance of risks around their forecasts for overall PCE inflation and core inflation as little changed from December. The majority of participants continued to judge the levels of uncertainty associated with their forecasts for the two inflation measures to be broadly similar to historical norms and the risks to those projections to be broadly balanced. Five participants, however, saw the risks to their inflation forecasts as tilted to the downside, reflecting, for example, the possibility that the current low levels of inflation could prove more persistent than anticipated as well as elevated global risks to the outlook. Conversely, one participant cited upside risks to inflation stemming from uncertainty about the timing and efficacy of the Committee's withdrawal of accommodation.
Figure 4. Uncertainty and risks in economic projections*
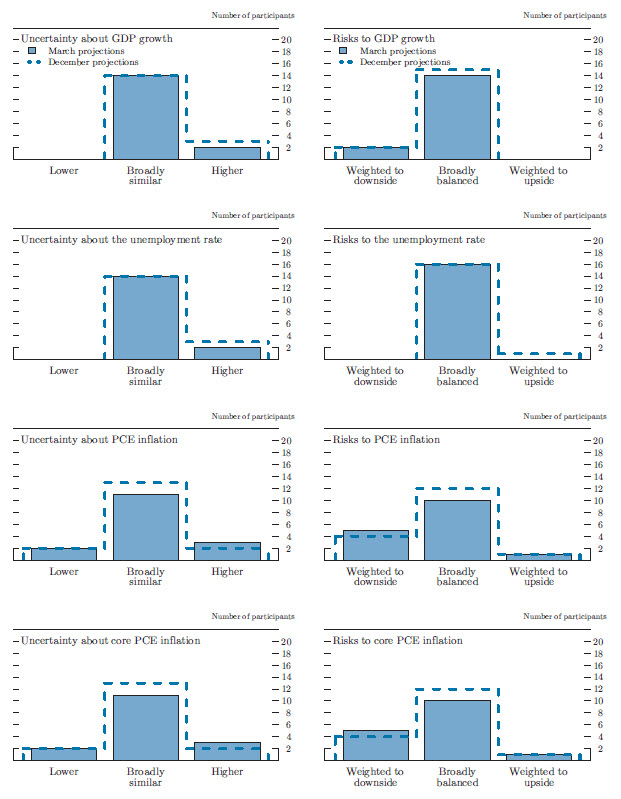
Accessible version of figure 4 | Return to figure 4
The economic projections provided by the members of the Board of Governors and the presidents of the Federal Reserve Banks inform discussions of monetary policy among policymakers and can aid public understanding of the basis for policy actions. Consider-able uncertainty attends these projections, however. The economic and statistical models and relationships used to help produce economic forecasts are necessarily imperfect descriptions of the real world, and the future path of the economy can be affected by myriad unforeseen developments and events. Thus, in setting the stance of monetary policy, participants consider not only what appears to be the most likely economic outcome as embodied in their projections, but also the range of alternative possibilities, the likelihood of their occurring, and the potential costs to the economy should they occur.
Table 2 summarizes the average historical accuracy of a range of forecasts, including those reported in past Monetary Policy Reports and those prepared by the Federal Reserve Board's staff in advance of meetings of the Federal Open Market Committee. The projection error ranges shown in the table illustrate the considerable uncertainty associated with economic forecasts. For example, suppose a participant projects that real gross domestic product (GDP) and total consumer prices will rise steadily at annual rates of, respectively, 3 percent and 2 percent. If the uncertainty attending those projections is similar to that experienced in the past and the risks around the projections are broadly balanced, the numbers reported in table 2 would imply a probability of about 70 percent that actual GDP would expand within a range of 1.4 to 4.6 percent in the current year, 0.9 to 5.1 percent in the second year, and 1.0 to 5.0 percent in the third year. The corresponding 70 percent confidence intervals for overall inflation would be 1.1 to 2.9 percent in the current year, 1.0 to 3.0 percent in the second year, and 0.9 to 3.1 percent in the third year.
Because current conditions may differ from those that prevailed, on average, over history, participants provide judgments as to whether the uncertainty attached to their projections of each variable is greater than, smaller than, or broadly similar to typical levels of forecast uncertainty in the past, as shown in table 2. Participants also provide judgments as to whether the risks to their projections are weighted to the upside, are weighted to the downside, or are broadly balanced. That is, participants judge whether each variable is more likely to be above or below their projections of the most likely outcome. These judgments about the uncertainty and the risks attending each participant’s projections are distinct from the diversity of participants' views about the most likely outcomes. Forecast uncertainty is concerned with the risks associated with a particular projection rather than with divergences across a number of different projections.
As with real activity and inflation, the outlook for the future path of the federal funds rate is subject to considerable uncertainty. This uncertainty arises primarily because each participants assessment of the appropriate stance of monetary policy depends importantly on the evolution of real activity and inflation over time. If economic conditions evolve in an unexpected manner, then assessments of the appropriate setting of the federal funds rate would change from that point forward.