Minutes of the Federal Open Market Committee
September 15-16, 2020
In conjunction with the Federal Open Market Committee (FOMC) meeting held on September 15–16, 2020, meeting participants submitted their projections of the most likely outcomes for real gross domestic product (GDP) growth, the unemployment rate, and inflation for each year from 2020 to 2023 and over the longer run. Each participant's projections were based on information available at the time of the meeting, together with her or his assessment of appropriate monetary policy—including a path for the federal funds rate and its longer-run value—and assumptions about other factors likely to affect economic outcomes. The longer-run projections represent each participant's assessment of the value to which each variable would be expected to converge, over time, under appropriate monetary policy and in the absence of further shocks to the economy.1 "Appropriate monetary policy" is defined as the future path of policy that each participant deems most likely to foster outcomes for economic activity and inflation that best satisfy his or her individual interpretation of the statutory mandate to promote maximum employment and price stability.
The current projections for real activity, the labor market, and inflation were notably stronger than the projections in the June 2020 Summary of Economic Projections (SEP) for the overlapping years from 2020 to 2022. Participants revised up their economic outlook in light of the stronger-than-expected rebound in economic activity over recent months, although they noted that they remained attentive to the effects of the COVID-19 pandemic and the measures taken to contain it. Table 1 and figure 1 provide summary statistics for the projections. Almost all participants projected that real GDP will contract in 2020, with the median participant seeing a milder contraction relative to the median projection in the June SEP. Additionally, almost all participants projected that real GDP would grow faster than their estimates of its longer-run normal growth rate from 2021 to 2023. All participants projected that the unemployment rate in the final quarter of 2020 would be notably lower than they had projected in June and that the unemployment rate would decline gradually during the forecast period. Most participants expected that a full economic recovery would take some time, and many projected that the unemployment rate in the final quarter of 2023 would be slightly below its estimated longer-run level. A vast majority of participants projected that total inflation, as measured by the four-quarter percent change in the price index for personal consumption expenditures (PCE), would be at or below the FOMC's 2 percent longer-run inflation objective throughout the forecast period. Projections for core PCE price inflation, which excludes consumer food and energy prices, generally followed a similar trajectory.
Table 1. Economic projections of Federal Reserve Board members and Federal Reserve Bank presidents, under their individual assumptions of projected appropriate monetary policy, September 2020
Percent
| Variable | Median1 | Central Tendency2 | Range3 | ||||||||||||
|---|---|---|---|---|---|---|---|---|---|---|---|---|---|---|---|
| 2020 | 2021 | 2022 | 2023 | Longer run | 2020 | 2021 | 2022 | 2023 | Longer run | 2020 | 2021 | 2022 | 2023 | Longer run | |
| Change in real GDP | -3.7 | 4.0 | 3.0 | 2.5 | 1.9 | -4.0–-3.0 | 3.6–4.7 | 2.5–3.3 | 2.4–3.0 | 1.7–2.0 | -5.5–1.0 | 0.0–5.5 | 2.0–4.5 | 2.0–4.0 | 1.6–2.2 |
| June projection | -6.5 | 5.0 | 3.5 | 1.8 | -7.6–-5.5 | 4.5–6.0 | 3.0–4.5 | 1.7–2.0 | -10.0–-4.2 | -1.0–7.0 | 2.0–6.0 | 1.6–2.2 | |||
| Unemployment rate | 7.6 | 5.5 | 4.6 | 4.0 | 4.1 | 7.0–8.0 | 5.0–6.2 | 4.0–5.0 | 3.5–4.4 | 3.9–4.3 | 6.5–8.0 | 4.0–8.0 | 3.5–7.5 | 3.5–6.0 | 3.5–4.7 |
| June projection | 9.3 | 6.5 | 5.5 | 4.1 | 9.0–10.0 | 5.9–7.5 | 4.8–6.1 | 4.0–4.3 | 7.0–14.0 | 4.5–12.0 | 4.0–8.0 | 3.5–4.7 | |||
| PCE inflation | 1.2 | 1.7 | 1.8 | 2.0 | 2.0 | 1.1–1.3 | 1.6–1.9 | 1.7–1.9 | 1.9–2.0 | 2.0 | 1.0–1.5 | 1.3–2.4 | 1.5–2.2 | 1.7–2.1 | 2.0 |
| June projection | .8 | 1.6 | 1.7 | 2.0 | 0.6–1.0 | 1.4–1.7 | 1.6–1.8 | 2.0 | 0.5–1.2 | 1.1–2.0 | 1.4–2.2 | 2.0 | |||
| Core PCE inflation4 | 1.5 | 1.7 | 1.8 | 2.0 | 1.3–1.5 | 1.6–1.8 | 1.7–1.9 | 1.9–2.0 | 1.2–1.6 | 1.5–2.4 | 1.6–2.2 | 1.7–2.1 | |||
| June projection | 1.0 | 1.5 | 1.7 | 0.9–1.1 | 1.4–1.7 | 1.6–1.8 | 0.7–1.3 | 1.2–2.0 | 1.2–2.2 | ||||||
| Memo: Projected appropriate policy path | |||||||||||||||
| Federal funds rate | .1 | .1 | .1 | .1 | 2.5 | 0.1 | 0.1 | 0.1 | 0.1–0.4 | 2.3–2.5 | 0.1 | 0.1 | 0.1–0.6 | 0.1–1.4 | 2.0–3.0 |
| June projection | .1 | .1 | .1 | 2.5 | 0.1 | 0.1 | 0.1 | 2.3–2.5 | 0.1 | 0.1 | 0.1–1.1 | 2.0–3.0 | |||
Note: Projections of change in real gross domestic product (GDP) and projections for both measures of inflation are percent changes from the fourth quarter of the previous year to the fourth quarter of the year indicated. PCE inflation and core PCE inflation are the percentage rates of change in, respectively, the price index for personal consumption expenditures (PCE) and the price index for PCE excluding food and energy. Projections for the unemployment rate are for the average civilian unemployment rate in the fourth quarter of the year indicated. Each participant's projections are based on his or her assessment of appropriate monetary policy. Longer-run projections represent each participant's assessment of the rate to which each variable would be expected to converge under appropriate monetary policy and in the absence of further shocks to the economy. The projections for the federal funds rate are the value of the midpoint of the projected appropriate target range for the federal funds rate or the projected appropriate target level for the federal funds rate at the end of the specified calendar year or over the longer run. The June projections were made in conjunction with the meeting of the Federal Open Market Committee on June 9–10, 2020. One participant did not submit longer-run projections for the change in real GDP, the unemployment rate, or the federal funds rate in conjunction with the June 9–10, 2020, meeting, and one participant did not submit such projections in conjunction with the September 15–16, 2020, meeting.
1. For each period, the median is the middle projection when the projections are arranged from lowest to highest. When the number of projections is even, the median is the average of the two middle projections. Return to table
2. The central tendency excludes the three highest and three lowest projections for each variable in each year. Return to table
3. The range for a variable in a given year includes all participants' projections, from lowest to highest, for that variable in that year. Return to table
4. Longer-run projections for core PCE inflation are not collected. Return to table
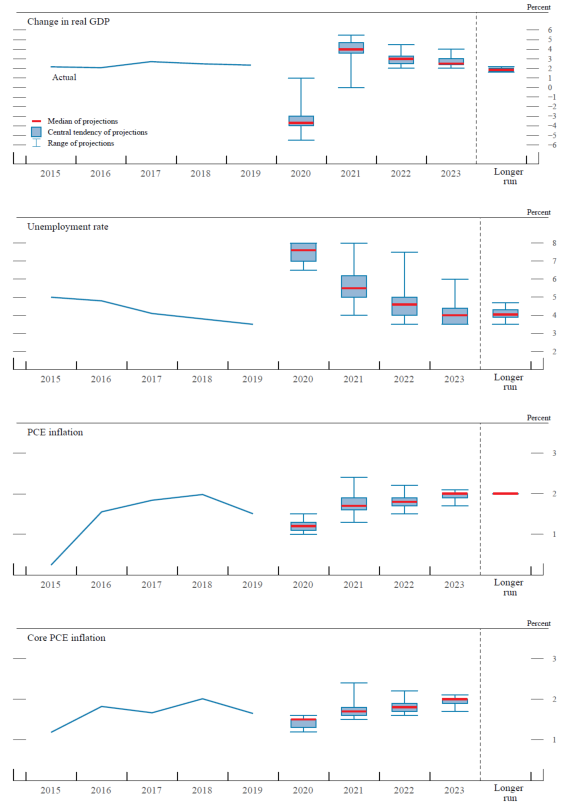
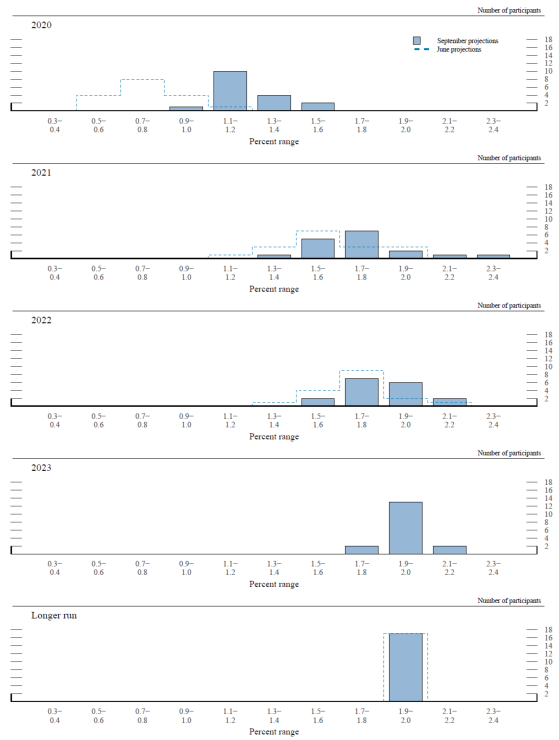
Figure 1. Medians, central tendencies, and ranges of economic projections, 2020–23 and over the longer run
Accessible version of figure 1 | Return to figure 1
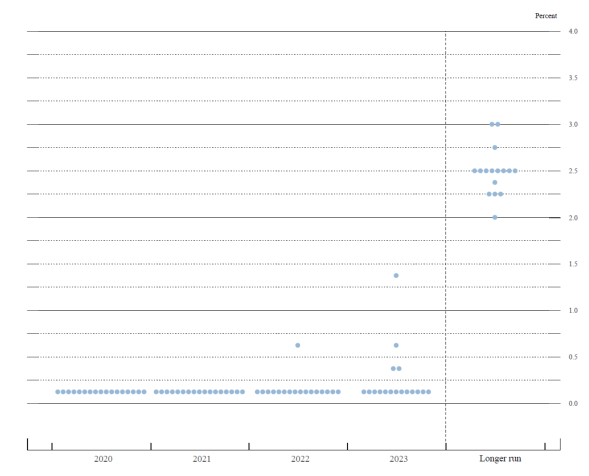
As shown in figure 2, most participants indicated that their expectations regarding the evolution of the economy, relative to the Committee's maximum- employment and price-stability objectives, would likely warrant keeping the federal funds rate at its current level through at least the end of 2023. The median of participants' assessments of the longer-run level for the federal funds rate was unchanged from its value in the June SEP.
Figure 2. FOMC participants' assessments of appropriate monetary policy: Midpoint of target range or target level for the federal funds rate
Accessible version of figure 2 | Return to figure 2
Amid uncertainty about the course of the pandemic and its effects on the economy, all participants continued to regard the uncertainties surrounding the economic outlook as higher than the average over the past 20 years. In addition, a substantial majority of participants assessed the risks to their outlook for real GDP growth as weighted to the downside and the risks to their unemployment rate projections as weighted to the upside. The risks to inflation projections were judged as weighted to the downside by a substantial majority of participants.
The Outlook for Real GDP Growth and the Unemployment Rate
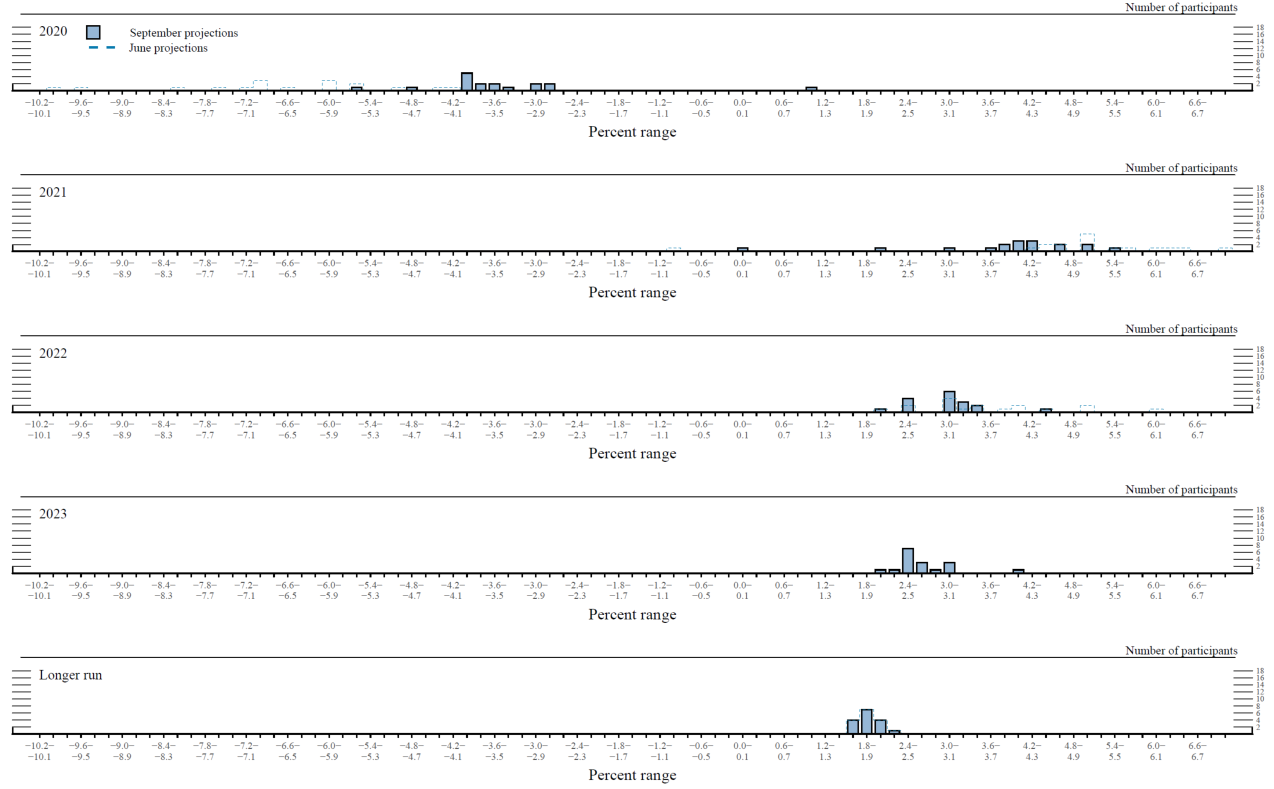
As shown in figure 3.A, almost all participants continued to project that real GDP would decline in 2020, with the median projection anticipating a decrease of 3.7 percent. Nevertheless, these projections were substantially stronger than those from the June SEP, when the median participant expected real GDP to contract 6.5 percent. These revisions, in part, reflect the stronger-than-expected incoming data since June. Almost all participants expected that the rate of real GDP growth from 2021 to 2023 would be above their estimates of its longer-run pace, with the median projections being 4.0 percent, 3.0 percent, and 2.5 percent in these years, respectively. The distribution of estimates of real GDP growth in the longer run was little changed from the June SEP, although the median projection ticked up to 1.9 percent.
Figure 3.A. Distribution of participants' projections for the change in real GDP, 2020–23 and over the longer run
Accessible version of figure 3.A | Return to figure 3.A
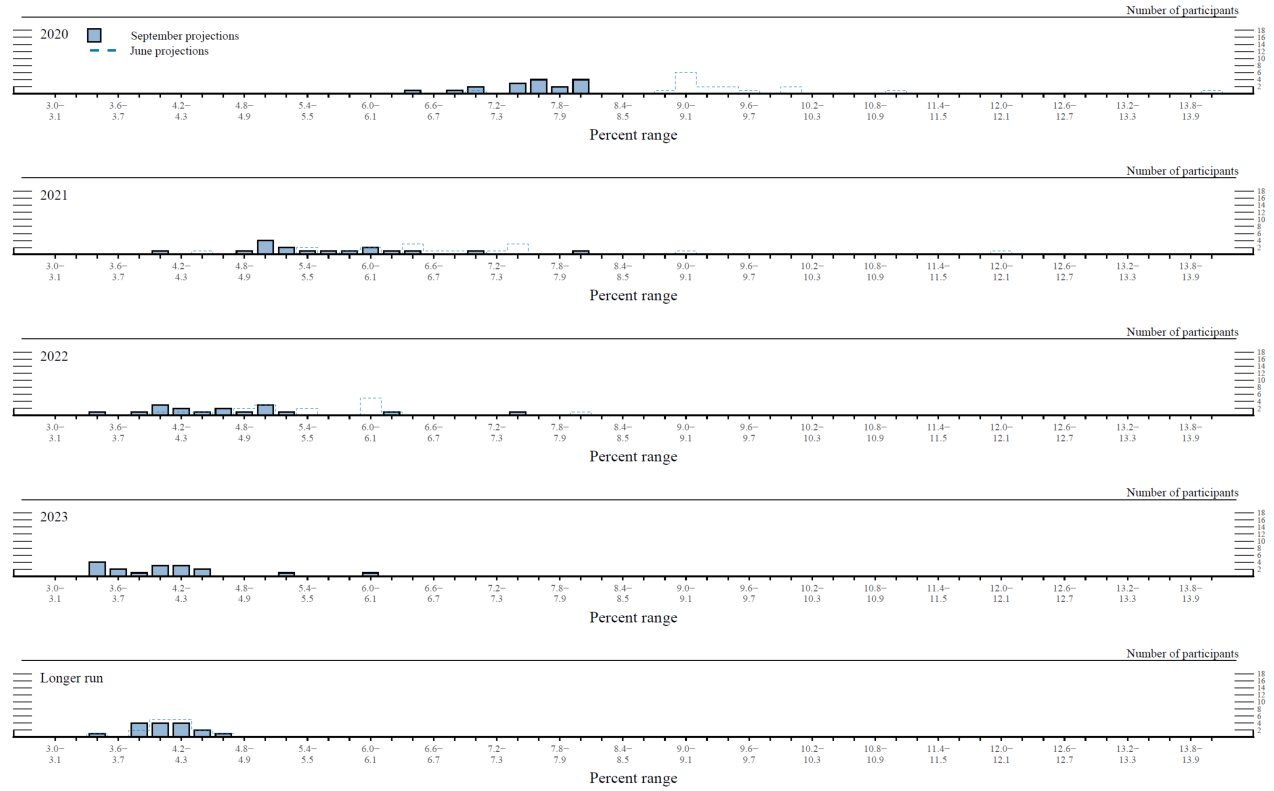
Reflecting better-than-expected incoming data since June, participants revised down their projections for the unemployment rate considerably through 2022, the forecast period in the June SEP (figure 3.B). The projections for the unemployment rate in the final quarter of this year ranged from 6.5 to 8.0 percent, with a median of 7.6 percent, and the ranges for projections from 2020 to 2022 all narrowed considerably since June. The median projected levels of the unemployment rate in the final quarters of 2021 and 2022—at 5.5 percent and 4.6 percent, respectively—were above the median estimate of the longer-run normal rate of unemployment of 4.1 percent. However, the median projection of the unemployment rate in the final quarter of 2023, at 4.0 percent, was slightly below the median estimate of its longer-run value.
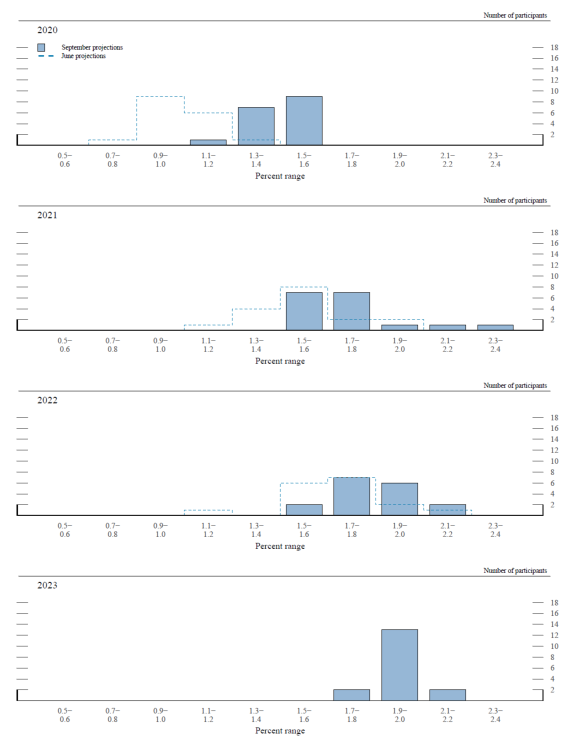
Figure 3.B. Distribution of participants' projections for the unemployment rate, 2020–23 and over the longer run
Accessible version of figure 3.B | Return to figure 3.B
The distribution of estimates for the longer-run unemployment rate was unchanged from the June SEP. Many participants indicated that they were still assessing whether the sharp contraction in economic activity during the first half of this year was likely to leave a lasting imprint on the labor market or the productive capacity of the economy.
The Outlook for Inflation
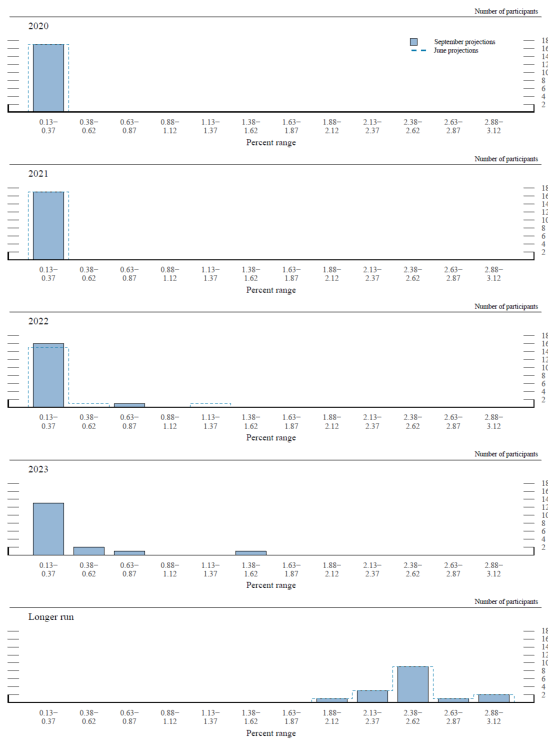
As shown in figures 3.C and 3.D, almost all participants revised up their projections for inflation in 2020 relative to their June projections, with the median projections for total and core inflation at 1.2 percent and 1.5 percent, respectively. Most participants expected inflation to rise over the next three years, although about half of them expected PCE price inflation to still fall short of the Committee's longer-run 2 percent inflation objective by the end of the forecast horizon. A few participants projected inflation to move above 2 percent before returning to 2 percent by 2023. A few participants expected inflation to move above its longer-run level in 2023, and several participants mentioned that they would expect inflation to rise above 2 percent in the years after.
Figure 3.C. Distribution of participants' projections for PCE inflation, 2020–23 and over the longer run
Accessible version of figure 3.C | Return to figure 3.C
Figure 3.D. Distribution of participants' projections for core PCE inflation, 2020–23
Accessible version of figure 3.D | Return to figure 3.D
Appropriate Monetary Policy
As shown in figure 3.E, most participants projected that it would be appropriate to maintain the target range for the federal funds rate at 0 to 1/4 percent through at least the end of 2023. Most participants noted that their assessment of appropriate monetary policy took into account the new Statement on Longer-Run Goals and Monetary Policy Strategy. In particular, because inflation has been running persistently below 2 percent, participants mentioned that they linked their assessment of the appropriate path of the federal funds rate to their assessment of shortfalls of employment from the Committee's maximum-employment objective and to a moderate rise in inflation above 2 percent to help anchor inflation expectations at the Committee's 2 percent longer-run goal. The median of participants' estimates of the longer-run level of the federal funds rate was unchanged from June at 2.50 percent.
Figure 3.E. Distribution of participants' judgments of the midpoint of the appropriate target range for the federal funds rate or the appropriate target level for the federal funds rate, 2020–23 and over the longer run
Accessible version of figure 3.E | Return to figure 3.E
Uncertainty and Risks
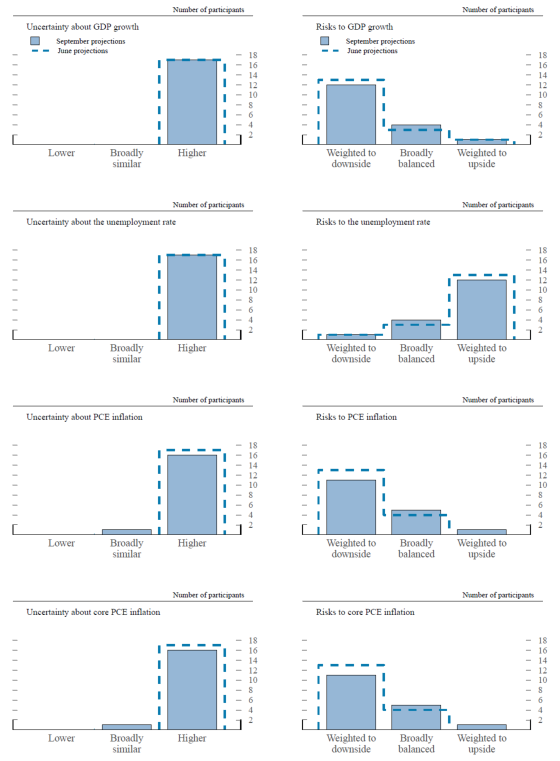
In assessing the appropriate path for monetary policy, FOMC participants take account of the range of possible economic outcomes, the likelihood of those outcomes, and the potential benefits and costs should they occur. As shown in the panels on the left side of figure 4, almost all participants continued to view the current uncertainty surrounding each of the four economic variables—real GDP growth, the unemployment rate, total PCE inflation, and core PCE inflation—as being greater than the average over the past 20 years.2
A substantial majority of participants judged the risks to their projections for real GDP growth as weighted to the downside and the risks to their unemployment rate projections as weighted to the upside (figure 4). A substantial majority of participants viewed the risks to their inflation projections as weighted to the downside.
Figure 4. Uncertainty and risks in economic projections
Accessible version of figure 4 | Return to figure 4
In discussing the uncertainty and risks surrounding their economic projections, the course of the pandemic continued to be mentioned as a key source of uncertainty. The possibility of another wave of contagion and delays in developing a vaccine were seen as potential downside risks to the economic outlook. As for upside risks, participants mentioned the possibility of faster-than-anticipated progress in dealing with the disease and better-targeted measures in responding to the virus. Participants also pointed to a number of other risks, including the extent and timing of additional fiscal support, the magnitude of supply-side disruptions associated with postponements of in-class school openings and small business closings, the likelihood of elevated levels of business bankruptcies, and credit quality problems that could potentially curtail lending. Several participants also expressed concerns about global geopolitical developments and related tensions as well as prolonged recessionary dynamics such as labor market scarring or inflation persistently undershooting the Committee's longer-run goal.
Participants' assessments of the appropriate future path of the federal funds rate are also subject to considerable uncertainty. Because the Committee adjusts monetary policy in response to actual and prospective developments over time in key economic variables—such as real GDP growth, the unemployment rate, and inflation—uncertainty surrounding the projected path for the federal funds rate importantly reflects the uncertainties about the paths for these economic variables, along with other factors. As with the macroeconomic variables, the forecast uncertainty surrounding the appropriate path of the federal funds rate is substantial.
The economic projections provided by the members of the Board of Governors and the presidents of the Federal Reserve Banks inform discussions of monetary policy among policymakers and can aid public understanding of the basis for policy actions. Considerable uncertainty attends these projections, however. The economic and statistical models and relationships used to help produce economic forecasts are necessarily imperfect descriptions of the real world, and the future path of the economy can be affected by myriad unforeseen developments and events. Thus, in setting the stance of monetary policy, participants consider not only what appears to be the most likely economic outcome as embodied in their projections, but also the range of alternative possibilities, the likelihood of their occurring, and the potential costs to the economy should they occur.
Table 2 summarizes the average historical accuracy of a range of forecasts, including those reported in past Monetary Policy Reports and those prepared by the Federal Reserve Board's staff in advance of meetings of the Federal Open Market Committee. The projection error ranges shown in the table illustrate the considerable uncertainty associated with economic forecasts. For example, suppose a participant projects that real gross domestic product (GDP) and total consumer prices will rise steadily at annual rates of, respectively, 3 percent and 2 percent. If the uncertainty attending those projections is similar to that experienced in the past and the risks around the projections are broadly balanced, the numbers reported in table 2 would imply a probability of about 70 percent that actual GDP would expand within a range of 1.9 to 4.1 percent in the current year, 1.3 to 4.7 percent in the second year, 1.2 to 4.8 percent in the third year, and 1.1 to 4.9 percent in the fourth year. The corresponding 70 percent confidence intervals for overall inflation would be 1.2 to 2.8 percent in the current year, 1.0 to 3.0 percent in the second year, 0.9 to 3.1 percent in the third year, and 1.0 to 3.0 percent in the fourth year.
Table 2. Average historical projection error ranges
Percentage points
| Variable | 2020 | 2021 | 2022 | 2023 |
|---|---|---|---|---|
| Change in real GDP1 | ±1.1 | ±1.7 | ±1.8 | ±1.9 |
| Unemployment rate1 | ±0.3 | ±1.1 | ±1.6 | ±1.9 |
| Total consumer prices2 | ±0.8 | ±1.0 | ±1.1 | ±1.0 |
| Short-term interest rates3 | ±0.5 | ±1.7 | ±2.3 | ±2.7 |
Note: Error ranges shown are measured as plus or minus the root mean squared error of projections for 2000 through 2019 that were released in the fall by various private and government forecasters. As described in the box "Forecast Uncertainty," under certain assumptions, there is about a 70 percent probability that actual outcomes for real GDP, unemployment, consumer prices, and the federal funds rate will be in ranges implied by the average size of projection errors made in the past. For more information, see David Reifschneider and Peter Tulip (2017), "Gauging the Uncertainty of the Economic Outlook Using Historical Forecasting Errors: The Federal Reserve's Approach," Finance and Economics Discussion Series 2017-020 (Washington: Board of Governors of the Federal Reserve System, February), https://dx.doi.org/10.17016/FEDS.2017.020.
1. Definitions of variables are in the general note to table 1. Return to table
2. Measure is the overall consumer price index, the price measure that has been most widely used in government and private economic forecasts. Projections are percent changes on a fourth quarter to fourth quarter basis. Return to table
3. For Federal Reserve staff forecasts, measure is the federal funds rate. For other forecasts, measure is the rate on 3-month Treasury bills. Projection errors are calculated using average levels, in percent, in the fourth quarter. Return to table
Because current conditions may differ from those that prevailed, on average, over history, participants provide judgments as to whether the uncertainty attached to their projections of each economic variable is greater than, smaller than, or broadly similar to typical levels of forecast uncertainty seen in the past 20 years, as presented in table 2.
That is, participants judge whether each economic variable is more likely to be above or below their projections of the most likely outcome. These judgments about the uncertainty and the risks attending each participant's projections are distinct from the diversity of participants' views about the most likely outcomes. Forecast uncertainty is concerned with the risks associated with a particular projection rather than with divergences across a number of different projections. As with real activity and inflation, the outlook for the future path of the federal funds rate is subject to considerable uncertainty. This uncertainty arises primarily because each participant's assessment of the appropriate stance of monetary policy depends importantly on the evolution of real activity and inflation over time. If economic conditions evolve in an unexpected manner, then assessments of the appropriate setting of the federal funds rate would change from that point forward. The final line in table 2 shows the error ranges for forecasts of short-term interest rates. They suggest that the historical confidence intervals associated with projections of the federal funds rate are quite wide. It should be noted, however, that these confidence intervals are not strictly consistent with the projections for the federal funds rate, as these projections are not forecasts of the most likely quarterly outcomes but rather are projections of participants' individual assessments of appropriate monetary policy and are on an end-of-year basis. However, the forecast errors should provide a sense of the uncertainty around the future path of the federal funds rate generated by the uncertainty about the macroeconomic variables as well as additional adjustments to monetary policy that would be appropriate to offset the effects of shocks to the economy.
1. One participant did not submit longer-run projections for real GDP growth, the unemployment rate, or the federal funds rate. Return to text
2. As a reference, table 2 provides estimates of the forecast uncertainty for the change in real GDP, the unemployment rate, and total consumer price inflation over the period from 2000 through 2019. At the end of this summary, the box "Forecast Uncertainty" discusses the sources and interpretation of uncertainty in the economic forecasts and explains the approach used to assess the uncertainty and risks attending participants' projections.
Previous SEP addendums to the FOMC minutes contained figures showing the median projections along with confidence intervals based on historical forecast errors. As the level of uncertainty about the economic outlook is currently judged to be higher than its historical average because of uncertainty about the course of the coronavirus and its effects on the economy, these "fan charts" have been omitted from this addendum. Return to text