March 26, 2012
Recent Developments in the Labor Market
Chairman Ben S. Bernanke
At the National Association for Business Economics Annual Conference, Arlington, Virginia
My remarks today will focus on recent and prospective developments in the labor market. We have seen some positive signs on the jobs front recently, including a pickup in monthly payroll gains and a notable decline in the unemployment rate. That is good news. At the same time, some key questions are unresolved. For example, the better jobs numbers seem somewhat out of sync with the overall pace of economic expansion. What explains this apparent discrepancy and what implications does it have for the future course of the labor market and the economy?
Importantly, despite the recent improvement, the job market remains far from normal; for example, the number of people working and total hours worked are still significantly below pre-crisis peaks, while the unemployment rate remains well above what most economists judge to be its long-run sustainable level. Of particular concern is the large number of people who have been unemployed for more than six months. Long-term unemployment is particularly costly to those directly affected, of course. But in addition, because of its negative effects on workers' skills and attachment to the labor force, long-term unemployment may ultimately reduce the productive capacity of our economy. The debate about how best to address long-term unemployment raises another important question: Is the current high level of long-term unemployment primarily the result of cyclical factors, such as insufficient aggregate demand, or of structural changes, such as a worsening mismatch between workers' skills and employers' requirements? If cyclical factors predominate, then policies that support a broader economic recovery should be effective in addressing long-term unemployment as well; if the causes are structural, then other policy tools will be needed. I will argue today that, while both cyclical and structural forces have doubtless contributed to the increase in long-term unemployment, the continued weakness in aggregate demand is likely the predominant factor. Consequently, the Federal Reserve's accommodative monetary policies, by providing support for demand and for the recovery, should help, over time, to reduce long-term unemployment as well.
Recent Labor Market Developments
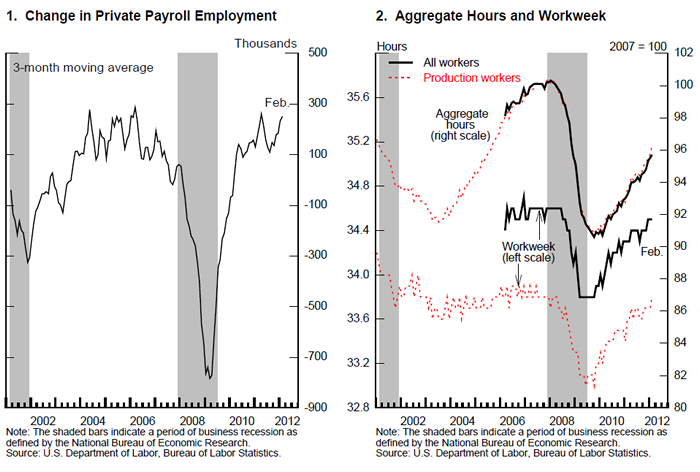
As background for my discussion, let me provide a brief review of recent job market indicators. As this audience is well aware, job creation has picked up recently. Private payroll employment (figure 1) increased by nearly 250,000 jobs per month, on average, in the three months ending in February, and by about 190,000 jobs per month, on average, over the past 12 months. At the same time, layoffs in the public sector appear to be moderating. Together with a lengthening of the average workweek, these employment gains have contributed to a significant increase in aggregate hours worked (figure 2).
The increase in hours worked is encouraging, because the decline in hours during the recent recession was extraordinary. From the peak of this series in December 2007 to its trough in February 2010, aggregate hours on the job by production workers fell by a remarkable 9-1/2 percent; by comparison, production-worker hours declined by "only" 5-3/4 percent during the severe 1981-82 recession. Currently, hours worked are still about 4 percent below the pre-recession peak--a clear improvement from where we were two years ago, but still far from where we would like to be.
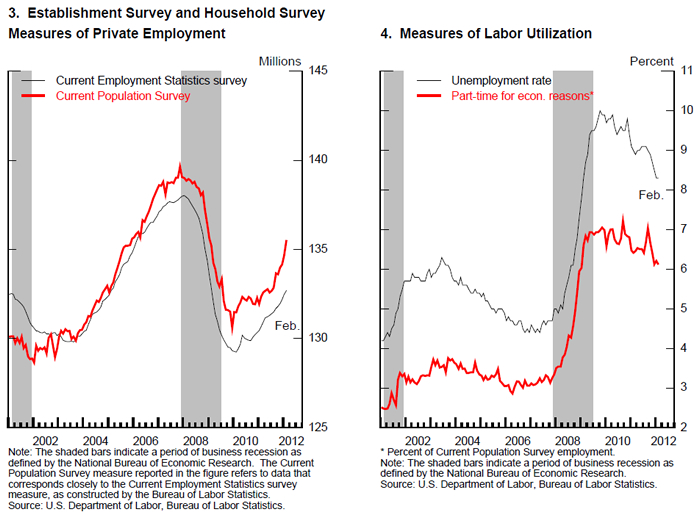
The government estimates payroll employment--the number of jobs--from a survey of businesses--the establishment survey. A monthly survey of about 60,000 households, which provides the data needed to construct the national unemployment rate, offers an alternative estimate of the number of jobs. Employment as estimated from the household survey, adjusted to correspond as closely as possible to the concept of employment measured in the establishment survey (figure 3), also shows an improvement in the labor market--indeed, by somewhat more than in the establishment survey. I should note, however, that month-to-month changes in this measure are much more volatile than the employment measure from the establishment survey, which is why the Federal Reserve puts more weight on the establishment survey for the purposes of short-term forecasting.
The positive signs from the labor market have shown through to measures of labor utilization: After hovering around 9 percent for much of last year, the unemployment rate (figure 4) has moved down since September to 8.3 percent in February, and the share of employment represented by people working part time for economic reasons, an indicator of underutilization, has declined modestly.
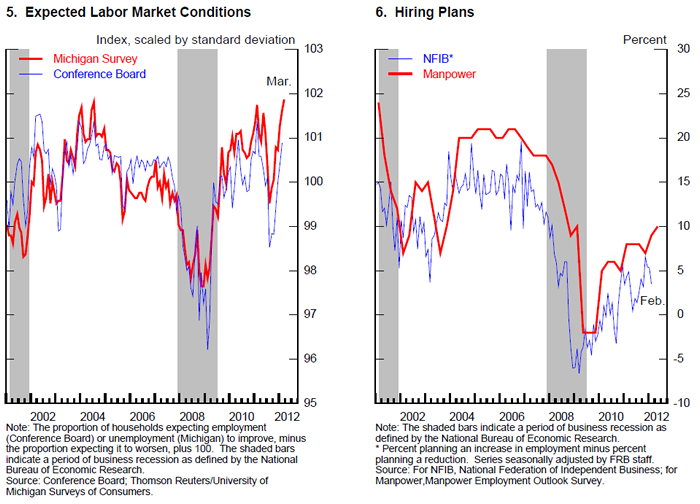
Surveys of households and firms about their attitudes and expectations offer yet another window on job market developments. Since the summer, household expectations for labor market conditions over the next year have gotten brighter (figure 5), unwinding a deterioration registered earlier last year. Business hiring plans have also shown modest gains (figure 6). Other indicators, such as new claims for unemployment insurance and measures of the breadth of hiring across industries, also point to better labor market conditions.
Notwithstanding these welcome recent signs, the job market remains quite weak relative to historical norms, as I've already noted. After nearly two years of job gains, private payroll employment remains more than 5 million jobs below its previous peak; the jobs shortfall is even larger, of course, when increases in the size of the labor force are taken into account. And the unemployment rate in February was still roughly 3 percentage points above its average over the 20 years preceding the recession. Moreover, a significant portion of the improvement in the labor market has reflected a decline in layoffs rather than an increase in hiring.
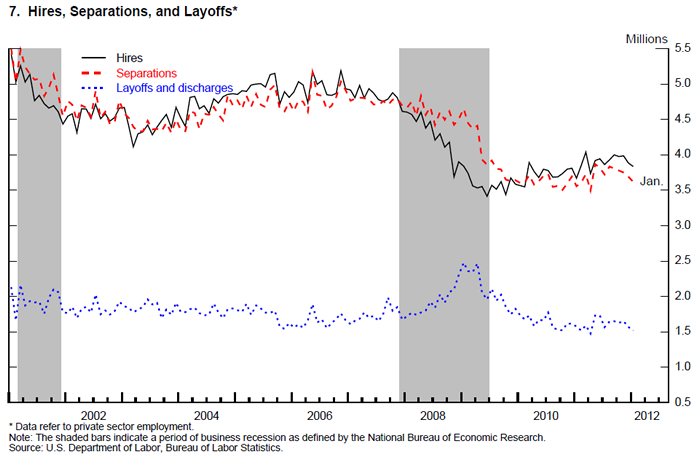
This last observation is illustrated by the data on gross job flows (figure 7). The monthly increase in payroll employment, which commands so much public attention, is a net change. It equals the number of hires during the month less the number of separations (including layoffs, quits, and other separations). In any given month, a large number of workers are being hired or are leaving their current jobs, illustrating the dynamism of the U.S. labor market. For example, between 2001 and 2007, private employers hired nearly 5 million people, on average, each month. Total separations, on average, were only slightly smaller. Taking the difference between gross hires and separations, the net monthly change in payrolls during this period was, on average, less than 100,000 jobs per month--a small figure compared to the gross flows.
The recent history of these flows suggests that further improvement in the labor market will likely need to come from a shift to a more robust pace of hiring. As figure 7 shows, the declines in aggregate payrolls during the recession stemmed from both a reduction in hiring and a large increase in layoffs. In contrast, the increase in employment since the end of 2009 has been due to a significant decline in layoffs but only a moderate improvement in hiring. To achieve a more rapid recovery in the job market, hiring rates will need to return to more normal levels.
The Change in Unemployment and Economic Growth: A Puzzle?
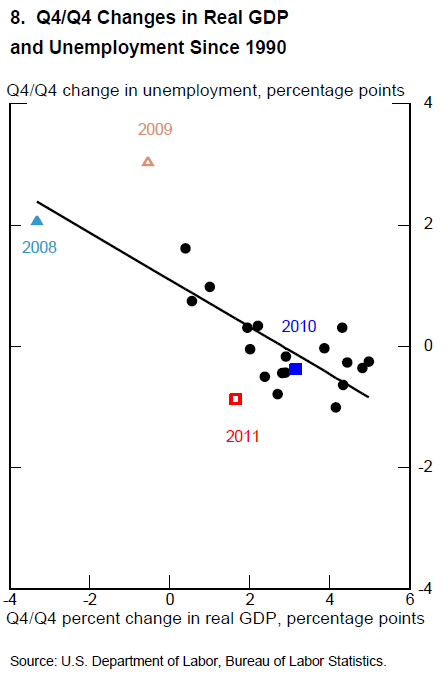
What will lead to more hiring and, consequently, further declines in unemployment? The short answer is more-rapid economic growth. Indeed, the improvement in the labor market over the past year--especially the decline in the unemployment rate‑‑has been faster than might have been expected, given that the economy during that time appears to have grown at a relatively modest pace. About 50 years ago, the economist and presidential adviser Arthur Okun identified a rule of thumb that has come to be known as Okun's law. That rule of thumb describes the observed relationship between changes in the unemployment rate and the growth rate of real gross domestic product (GDP). Okun noted that, because of ongoing increases in the size of the labor force and in the level of productivity, real GDP growth close to the rate of growth of its potential is normally required just to hold the unemployment rate steady. To reduce the unemployment rate, therefore, the economy must grow at a pace above its potential. More specifically, according to currently accepted versions of Okun's law, to achieve a 1 percentage point decline in the unemployment rate in the course of a year, real GDP must grow approximately 2 percentage points faster than the rate of growth of potential GDP over that period. So, for illustration, if the potential rate of GDP growth is 2 percent, Okun's law says that GDP must grow at about a 4 percent rate for one year to achieve a 1 percentage point reduction in the rate of unemployment.
In light of this historical regularity, the combination of relatively modest GDP growth with the more substantial improvement in the labor market over the past year is something of a puzzle. Resolving this puzzle could give us important insight into how the economy is likely to evolve. To illustrate the tension, consider the relationship between the recent changes in the unemployment rate and in real GDP relative to the predictions of Okun's law (figure 8). As illustrated by the position of the square labeled "2011" relative to the Okun's law relationship, represented by the line, the decline in the unemployment rate over the course of 2011 was greater than would seem consistent with GDP growth over that period. Indeed, with last year's real GDP growth below 2 percent, less than what most economists would estimate to be the U.S. economy's potential rate of growth, one might have expected little change in the unemployment rate last year or even a slight increase. What is this confluence of the significant decline in the unemployment rate and the modest recent increase in real GDP telling us about the state of the economy, and how will the Okun's law puzzle be resolved?
The apparent failure of Okun's law could reflect, in part, statistical noise. For example, it may be that future data revisions will show that real GDP grew more quickly over the past year than currently estimated. However, although it is certainly possible that revised data will ultimately explain part of the puzzle, at this point we have no specific evidence suggesting that such a revision might be in the offing. For example, gross domestic income, an alternative measure of economic activity constructed using source data that are mostly different from the data used in estimating GDP, provides some check on the information provided by the better-known GDP measure. However, gross domestic income is currently estimated to have increased less quickly than GDP in recent quarters and so does not point to an explanation of the drop in the unemployment rate.
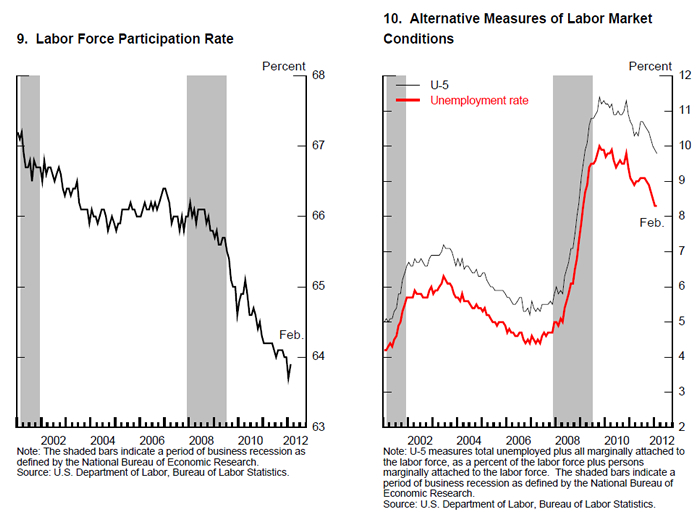
Another logical possibility is that the decline in the unemployment rate could be overstating the improvement in the job market. For example, potential workers could be giving up on looking for work to an unusual extent. Because a person has to be either working or looking for work to be counted as part of the labor force, an increase in the number of people too discouraged to continue their search for work would reduce the unemployment rate, all else being equal--but not for a positive reason. A story centered on potential workers dropping out of the labor force might seem in line with the low level of the labor force participation rate (figure 9). But other data cast doubt on that idea. For example, a broad measure of labor underutilization that includes people only marginally attached to the labor force has declined about in line with the unemployment rate since late 2010 (figure 10).1 On balance, an assessment of a broad range of indicators suggests that a substantial portion of the decline in the unemployment rate does reflect genuine improvement in labor market conditions.
Yet another interpretation of the recent improvement is that it represents a catch-up from outsized job losses during and just after the recession. In 2008 and 2009, the decline in payrolls and the associated jump in unemployment were extraordinary. In particular, using the Okun's law metric, the run-up in the unemployment rate in 2009 appears "too large" relative even to the substantial decline in real GDP that occurred. This point can be seen by returning to figure 8, which shows the Okun's law relationship. The open triangle labeled "2009" in the upper left of the figure shows an increase in the unemployment rate in that year well above the one implied by the contraction in real GDP and Okun's law. In other words, employers reduced their workforces at an unusually rapid rate near the business cycle trough--perhaps because they feared an even more severe contraction to come or, with credit availability sharply curtailed, they were trying to conserve available cash.
The diagram suggests that what we may be seeing now is the flip side of the fear-driven layoffs that occurred during the worst part of the recession, as firms have become sufficiently confident to move their workforces into closer alignment with the expected demand for their products. Such a dynamic would explain the position of the square labeled "2011" in that figure being far below the line representing Okun's law. Of course, Okun's law is a noisy relationship, and we don't really know if the better-than-expected labor market performance of 2011 has largely offset the worse-than-expected performance in 2009. However, to the extent that the decline in the unemployment rate since last summer has brought unemployment back more into line with the level of aggregate demand, then further significant improvements in unemployment will likely require faster economic growth than we experienced during the past year. It will be especially important to evaluate incoming information to assess whether the recovery is picking up as improvements in the labor market feed through to consumer and business confidence; or, conversely, whether the headwinds that have impeded the recovery to date continue to restrain the pace at which the labor market and economic activity normalize.
The Challenge of Long-term Unemployment
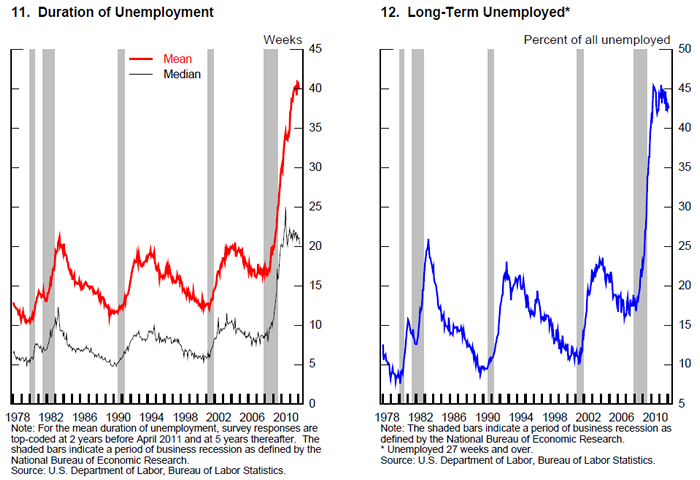
Discussions of the labor market at this juncture necessarily have a "glass half-empty or half-full" tone. Recent improvements are encouraging, but, as I have noted, in an absolute sense, the job market is still far from normal by many measures, and millions of families continue to suffer the day-to-day hardships associated with not being able to find suitable employment. Although most spells of unemployment are disruptive or costly, the persistently high rate of long-term unemployment we have seen over the past three years or so is especially concerning. In this episode, both the median and average durations of unemployment have reached levels far outside the range of experience since World War II (figure 11). And the share of unemployment that represents spells lasting more than six months has been higher than 40 percent since December 2009 (figure 12). By way of comparison, the share of unemployment that was long term in nature never exceeded 25 percent or so in the severe 1981-82 recession.
Those who have experienced unemployment know the burdens that it creates, and a growing academic literature documents some dimensions of those burdens. For example, research has shown that workers who lose previously stable jobs experience sharp declines in earnings that may last for many years, even after they find new work.2 Surveys indicate that more than one-half of the households experiencing long unemployment spells since the onset of the recent recession withdrew money from savings and retirement accounts to cover expenses, one-half borrowed money from family and friends, and one-third struggled to meet housing expenses.3 Unemployment also takes a toll on people's health and may have long-term consequences for the families of the unemployed as well. For example, studies suggest that unemployed people suffer from a higher incidence of stress‐related health problems such as depression, stroke, and heart disease, and they may have a lower life expectancy.4 The children of the unemployed achieve less in school and appear to have reduced long-term earnings prospects.5
In addition, unemployment--especially long-term unemployment--imposes important economic costs on everyone, not just the unemployed themselves. Elevated unemployment strains public finances because of both lost tax revenue and the payment of increased unemployment benefits and other income support to affected families. People unemployed for a long time have historically found jobs less easily than those experiencing shorter spells of unemployment, perhaps because their skills erode, they lose relationships within the workforce, or they acquire a stigma that deters firms from hiring them. Loss of skills and lower rates of employment reduce the economy's overall productive capacity over the longer term. In the shorter term, because the process of matching the long-term unemployed to jobs typically takes more time, the currently high level of long-term unemployment might in itself be a reason that further progress in reducing the unemployment rate, and thus in achieving a more complete recovery, could be slow.6
A pessimistic view is that a large share of the unemployment we are seeing, particularly the longer-term unemployment, is structural in nature, reflecting factors such as inadequate skills or mismatches between the types of skills that workers have and the skills that employers demand. If this view is correct, then high levels of long-term unemployment could persist for quite a while, even after the economy has more fully recovered. And it appears true that over the past two decades or so, structural factors have been responsible for some increase in long-term unemployment. For example, because an older worker who loses a job typically takes longer to find a new job than does a younger worker in the same situation, the aging of the baby boom generation has probably contributed to a gradual rise in long-term unemployment. Factors such as globalization, technological change, and the loss of lower-skill manufacturing jobs have likely reduced the employability and earnings potential of some groups of workers. To the extent that higher rates of unemployment, especially long-term unemployment, result from structural factors, the scope for countercyclical policies to reduce unemployment would be impaired, and the benefits of a more complete economic recovery for many workers who are unemployed or discouraged would be more limited.
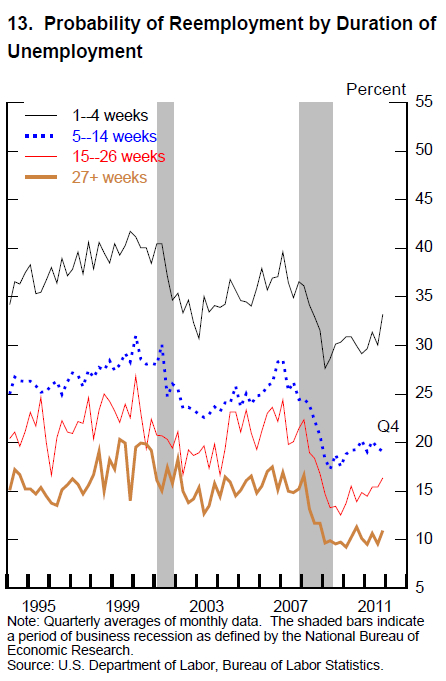
However, although structural shifts are no doubt important in the longer term, my reading of the research is that, at most, a modest portion of the recent sharp increase in long-term unemployment is due to persistent structural factors.7 Consider, for example, rates of job finding by those unemployed for varying amounts of time (figure 13). Unsurprisingly, the rate at which the long-term unemployed find work is lower than that of those who have been unemployed for only a short time; on average over the period from 1994 to 2007, a bit more than one-third of those already unemployed for one to four weeks found employment within the next month. In contrast, over that same period, only about one-sixth of those already unemployed for more than 27 weeks managed to find a job within a month.
If the recent increase in long-term unemployment were being driven by structural factors rather than, say, the severity of the recession, then the job-finding rates of the long-term unemployed should have fallen sharply relative to those out of work for only a few weeks. But that's not what we're seeing. Rather, as figure 13 shows, the job finding rates of the more recently unemployed and the long-term unemployed all fell over the recession in roughly the same proportion, and they remain low.8 This pattern is consistent with cyclical factors accounting for the bulk of the recent increase in long-term unemployment. Similarly, the fact that labor demand appears weak in most industries and locations is suggestive of a general shortfall of aggregate demand rather a worsening mismatch of skills and jobs. Counterexamples like the energy boom in the upper Midwest, where there may be some mismatch in the geographic location of suitably skilled workers or an overall shortage of potential workers with relevant skills, might best be interpreted as the exceptions that prove the rule; a mismatch story would suggest that strong labor demand would be appearing in more sectors or geographical areas by now.
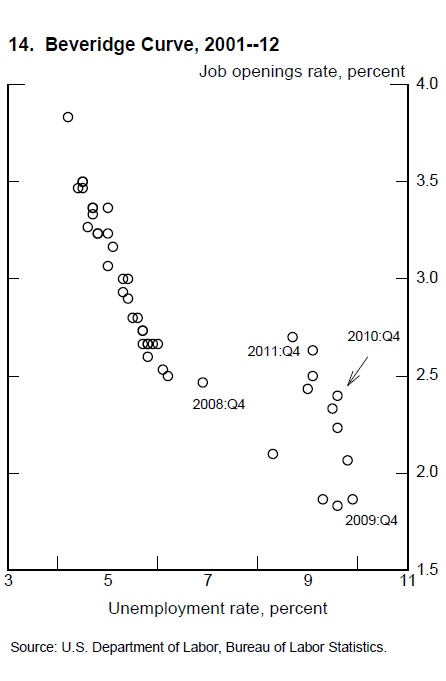
An empirical relationship that economists have long used to interpret developments in the labor market is known as the Beveridge curve (figure 14). That curve--named after the British economist William Beveridge--compares unemployment (the number of workers looking for employers) to job vacancies (the number of workers that employers are seeking). In good times, when the unemployment rate is low, businesses are growing and workers are harder to find, so job vacancies tend to be high. Similarly, in bad times, unemployment is high and few jobs are available (vacancies are low). Thus, the Beveridge curve, the relationship between unemployment and vacancies, is downward sloping.
On the usual interpretation, a recession is a period in which the economy is moving down along the Beveridge curve; as output and the demand for labor fall, job vacancies decline and unemployment rises. In contrast, changes in the structural determinants of unemployment are thought to be reflected in shifts of the Beveridge curve to the left or right. For example, suppose that, because of changes in technology or in the mix of industries and jobs, the mismatch between the skills of the unemployed and the needs of employers worsens. Then, for a given number of job openings, the number of the unemployed who are qualified for those jobs is smaller and the unemployment rate is higher than it would have been before the mismatch problem worsened. Graphically, an increase in a skills mismatch would be reflected in a shift of the Beveridge curve up and to the right.
From figure 14, we can see some outward shift in the relationship between job vacancies and unemployment, consistent with some increase in structural unemployment since the onset of the recession. However, a more in-depth analysis of the evidence suggests that the apparent shift in the relationship between vacancies and unemployment is neither unusual for a recession nor likely to be persistent. Research has found that during and immediately after the serious recessions of 1973 to 1975 and 1981 to 1982, the Beveridge curve also shifted outward, but in both cases it shifted back inward during the recovery. This temporary outward shift during a deep recession may be the result of a particularly sharp increase in layoffs, which raises unemployment quickly, even as vacancies adjust more slowly. Another possible explanation for a temporary shift in the Beveridge curve is extended and emergency unemployment insurance, which induces unemployed workers who might otherwise consider leaving the labor force to continue searching for work. Or employers may be more selective in hiring when their need for workers is not pressing and take more time to fill vacancies in an effort to find especially qualified hires. In any case, the data appear consistent with the shift in the vacancy-unemployment relationship in recent years having been relatively modest and likely to reverse, at least in part, as the economy recovers further. When historical experience is taken into account, these patterns do not support the view that structural factors are a major cause of the increase in unemployment during the most recent recession.9
Conclusion
To sum up: A wide range of indicators suggests that the job market has been improving, which is a welcome development indeed. Still, conditions remain far from normal, as shown, for example, by the high level of long-term unemployment and the fact that jobs and hours worked remain well below pre-crisis peaks, even without adjusting for growth in the labor force. Moreover, we cannot yet be sure that the recent pace of improvement in the labor market will be sustained. Notably, an examination of recent deviations from Okun's law suggests that the recent decline in the unemployment rate may reflect, at least in part, a reversal of the unusually large layoffs that occurred during late 2008 and over 2009. To the extent that this reversal has been completed, further significant improvements in the unemployment rate will likely require a more-rapid expansion of production and demand from consumers and businesses, a process that can be supported by continued accommodative policies.
I also discussed long-term unemployment today, arguing that cyclical rather than structural factors are likely the primary source of its substantial increase during the recession. If this assessment is correct, then accommodative policies to support the economic recovery will help address this problem as well. We must watch long-term unemployment especially carefully, however. Even if the primary cause of high long-term unemployment is insufficient aggregate demand, if progress in reducing unemployment is too slow, the long-term unemployed will see their skills and labor force attachment atrophy further, possibly converting a cyclical problem into a structural one.
If this hypothesis is wrong and structural factors are in fact explaining much of the increase in long-term unemployment, then the scope for countercyclical policies to address this problem will be more limited. Even if that proves to be the case, however, we should not conclude that nothing can be done. If structural factors are the predominant explanation for the increase in long-term unemployment, it will become even more important to take the steps needed to ensure that workers are able to obtain the skills needed to meet the demands of our rapidly changing economy.
1. The broader measure of labor underutilization referenced here is the U-5 measure of unemployment, constructed by the Bureau of Labor Statistics. Return to text
2. For example, see Till von Wachter, Jae Song, and Joyce Manchester (2009), "Long-Term Earnings Losses Due to Mass Layoffs during the 1982 Recession: An Analysis Using U.S. Administrative Data from 1974 to 2004," unpublished paper, Columbia University, April. Return to text
3. See Paul Taylor, Rich Morin, Rakesh Kochhar, Kim Parker, Wendy Wang, Daniel Dockterman, Rebecca Hinze-Pifer, and Soledad Espinoza (2010), "The Impact of Long-Term Unemployment: Lost Income, Lost Friends--and Loss of Self-Respect" (Washington: Pew Research Center, July 22). Return to text
4. For example, see Frances McKee-Ryan, Zhaoli Song, Connie R. Wanberg, and Angelo J. Kinicki (2005), "Psychological and Physical Well-Being during Unemployment: A Meta-Analytic Study," Journal of Applied Psychology, vol. 90 (January), pp. 53-76; and Sarah A. Burgard, Jennie E. Brand, and James S. House (2007), "Toward a Better Estimation of the Effect of Job Loss on Health," Journal of Health and Social Behavior, vol. 48 (4), pp. 369-84. On life expectancy, see David J. Roelfs, Eran Shor, Karina W. Dawson, and Joseph E. Schwartz (2011), "Losing Life and Livelihood: A Systematic Review and Meta-analysis of Unemployment and All-Cause Mortality," Social Science and Medicine, vol. 72 (March), pp. 840-54. Return to text
5. See Ann Huff Stevens and Jessamyn Schaller (2011), "Short-Run Effects of Parental Job Loss on Children's Academic Achievement," Economics of Education Review, vol. 30 (April), pp. 289-99; Ariel Kalil and Patrick Wightman (2011), "Parental Job Loss and Children's Educational Attainment in Black and White Middle-Class Families," Social Science Quarterly, vol. 92 (March), pp. 57-78; and Philip Oreopoulos, Marianne Page, and Ann Huff Stevens (2008), "The Intergenerational Effects of Worker Displacement," Journal of Labor Economics, vol. 26 (July), pp. 455-83. Return to text
6. For a discussion of this effect, see Daniel Aaronson, Bhashkar Mazumder, and Shani Schechter (2010), "What Is behind the Rise in Long-Term Unemployment?" Federal Reserve Bank of Chicago, Economic Perspectives, vol. 34 (2), pp. 28-51. Return to text
7. For some discussion of this effect, see Organisation for Economic Co-operation and Development (2011), OECD Employment Outlook 2011 ; and Aaronson and others, "What Is behind the Rise in Long-Term Unemployment?" (see note 6). Return to text
8. For an earlier analysis along these lines, see Michael W. L. Elsby, Bart Hobijn, and Aysegül Sahin (2010), "The Labor Market in the Great Recession," Brookings Papers on Economic Activity (Spring), pp. 1-69. Return to text
9. For a discussion of shifts in the Beveridge curve during previous recessions, see John Lindner and Murat Tasci (2010), "Has the Beveridge Curve Shifted?" Federal Reserve Bank of Cleveland, Economic Trends, August; and Robert Valletta and Katherine Kuang (2010), "Is Structural Unemployment on the Rise?" Federal Reserve Bank of San Francisco, FRBSF Economic Letter, 2010-34, November 8. For research examining the specific role of mismatch, see Regis Barnichon and Andrew Figura (2010), "What Drives Movements in the Unemployment Rate? A Decomposition of the Beveridge Curve (PDF)," Finance and Economics Discussion Series 2010-48 (Washington: Board of Governors of the Federal Reserve System, August); and Aysegül Sahin, Joseph Song, Giorgio Topa, and Giovanni L. Violante (2011), "Measuring Mismatch in the U.S. Labor Market," unpublished paper, Federal Reserve Bank of New York, July. Other factors affecting the Beveridge curve include the role of extended unemployment benefits and potential effects of lags between vacancies and hiring; on the effects of unemployment benefits, see Robert Valletta and Katherine Kuang (2010), "Extended Unemployment and UI Benefits," Federal Reserve Bank of San Francisco, FRBSF Economic Letter, 2010-12, April 19; on the lag between job vacancies and hiring, see Steven J. Davis, R. Jason Faberman, and John C. Haltiwanger (2010), "The Establishment-Level Behavior of Vacancies and Hiring," NBER Working Paper Series 16265 (Cambridge, Mass.: National Bureau of Economic Research, August), www.nber.org/papers/w16265. Return to text