December 07, 2018
Assessing Financial Stability over the Cycle
Governor Lael Brainard
At the Peterson Institute for International Economics, Washington, D.C.
Financial stability is integral to achieving the Federal Reserve's objectives of full employment and price stability. We need only look back a decade to see the dramatic damage from financial vulnerabilities that increase unchecked: Millions of Americans lost their livelihoods and their homes, business losses and failures rose, and the government had to provide extraordinary support to the system. Since then, financial sector resilience has strengthened, and household balance sheets have been repaired over the course of a lengthy recovery. Today employment is strong, inflation is around target, and incomes are growing.1
If we learned anything from this experience, it is that we must be especially vigilant to safeguard the resilience of our financial system in good times when vulnerabilities may be building. That is why the Federal Reserve actively monitors the potential vulnerabilities to the financial system. Last week, for the first time, we released our assessment in the Financial Stability Report.2 Today I will offer a brief summary of the outlook, highlight areas where I see financial imbalances building, and touch on the implications for policy.
Sustaining the Expansion
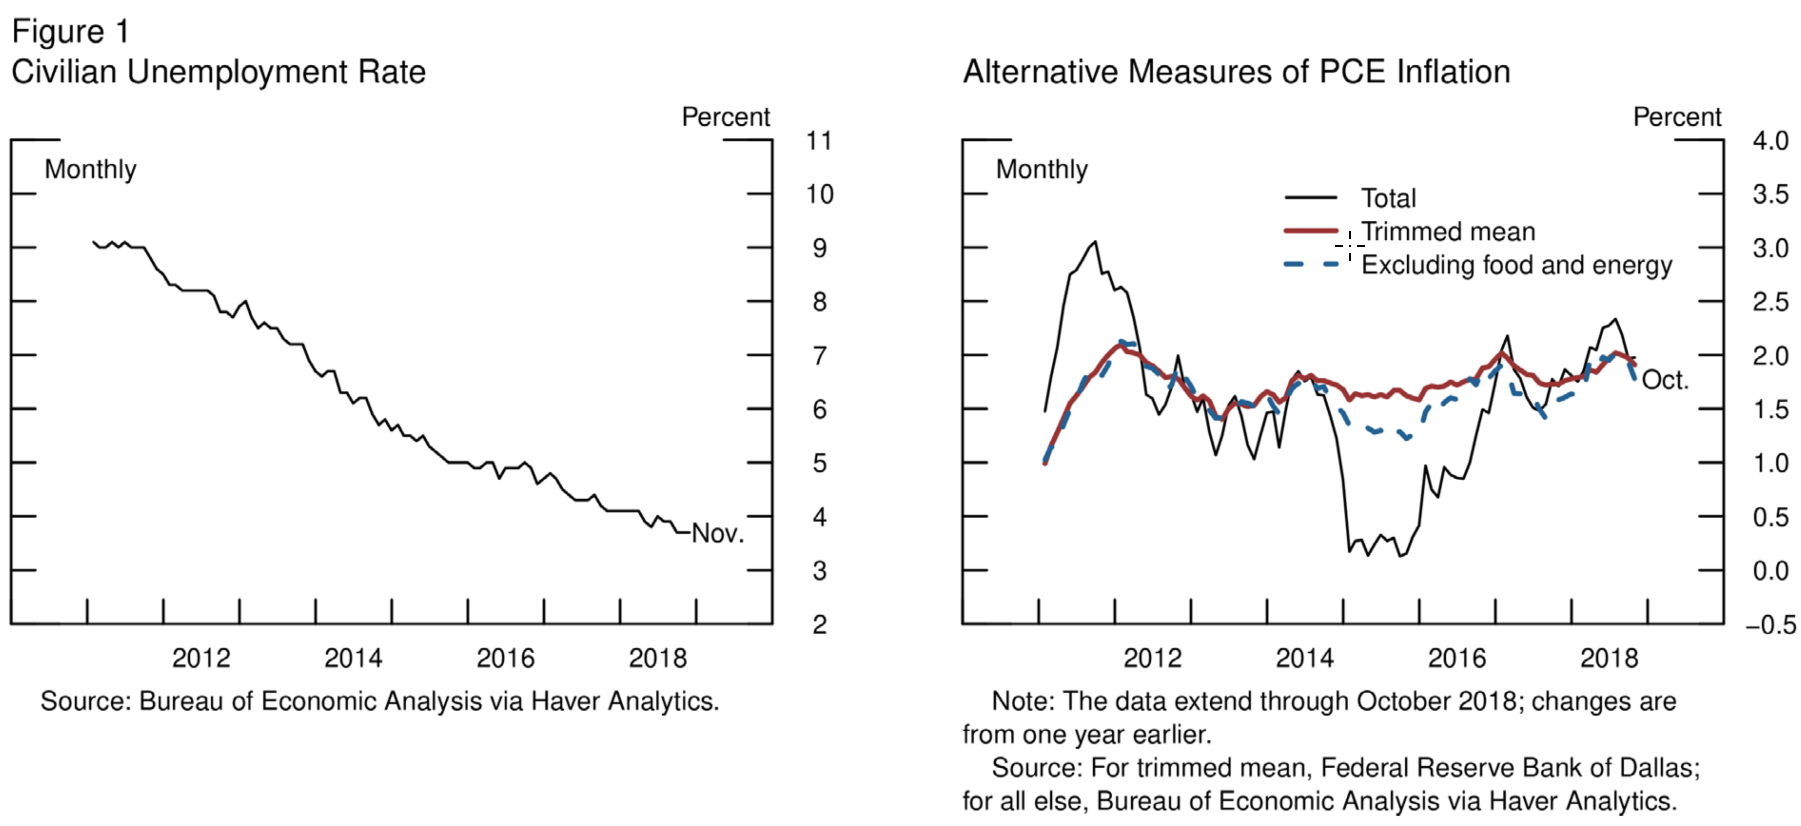
Domestic economic momentum has been strong, as evidenced by the labor market. With the November data, monthly payroll gains have averaged 170,000 over the past 3 months, well above the pace necessary to absorb new entrants into the labor force. The share of the prime-age population (people ages 25 to 54) that is working is closing in on its pre-crisis level. By most measures, wages have accelerated over the past year and are now growing around 3 percent, the highest level since the crisis. These are welcome developments.
While the most recent reading on core personal consumption expenditures, or PCE, inflation ticked down, indicators of underlying trend inflation remain encouraging overall, providing little signal of an outbreak of inflation to the upside, on the one hand, and reassurance that underlying trend inflation may be close to our target of 2 percent, on the other (figure 1).
The economy has grown 3 percent over the past year, and there are good reasons to expect growth to remain solid next year, supported by the strong underlying momentum in domestic demand. Consumer spending looks to be robust going into the fourth quarter, and ongoing gains in income and employment provide positive fundamentals. In addition, business investment should be solid, even with recent declines in oil prices. Sizable fiscal stimulus has provided an important boost to demand this year and will likely contribute somewhat further next year, given the usual lags in outlays and in the effects of tax cuts on business and household spending.
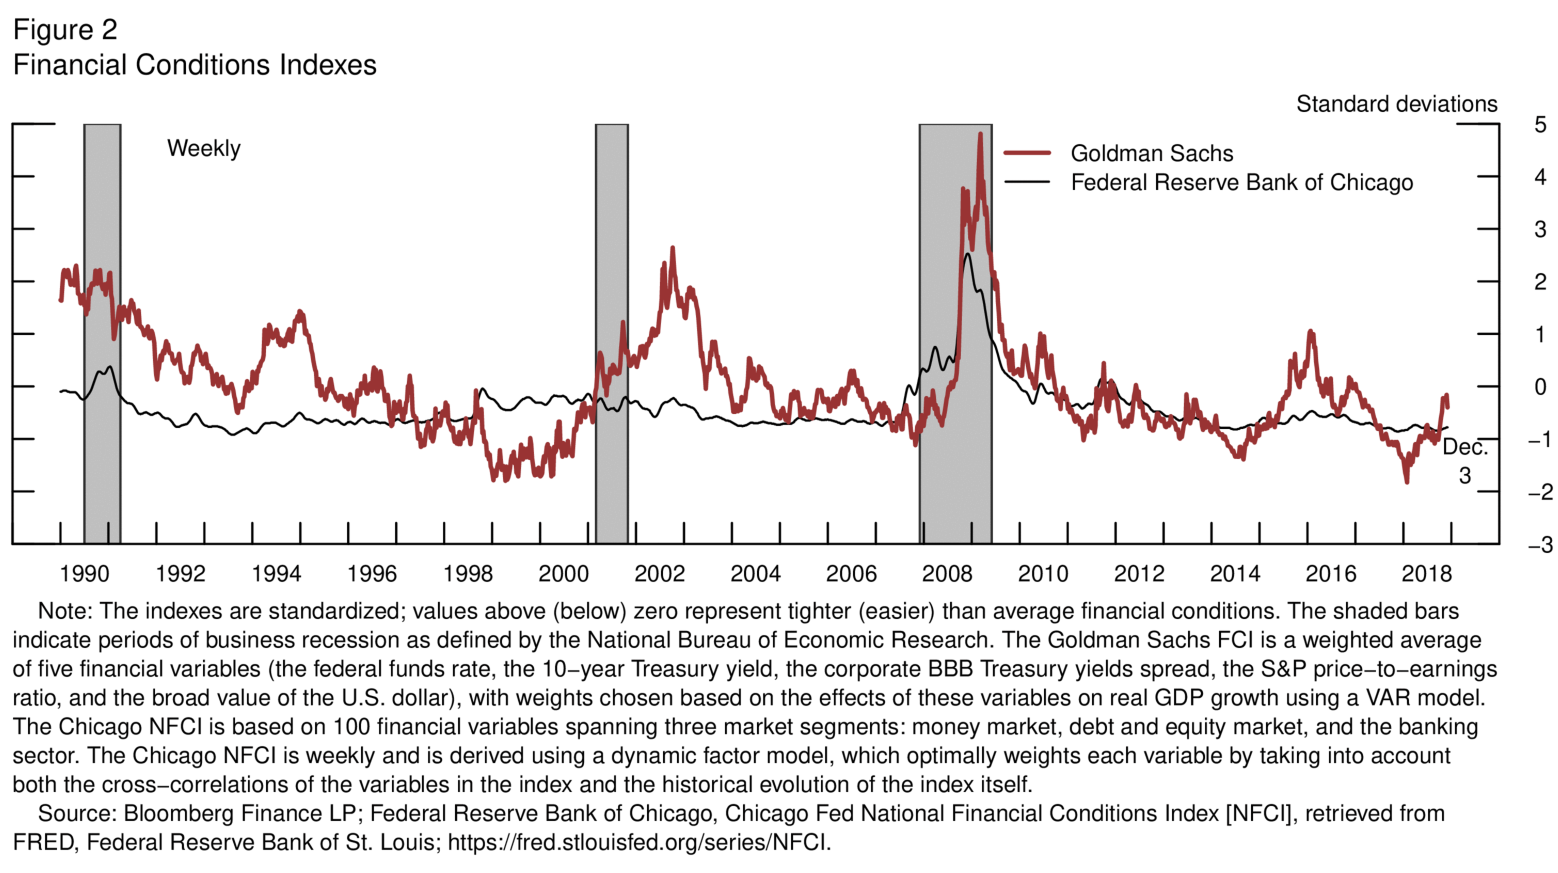
The most likely path for the economy is positive, although some tailwinds that have provided a boost are fading, and we may face some crosscurrents. The global growth that provided a strong tailwind going into this year has moderated. The earlier strong growth in Europe and Japan appears to be softening toward trend. China is shifting to an accommodative policy stance to contend with a challenging trade environment and lagged effects from its earlier tightening. Here at home, the impetus to growth from fiscal policy is likely to fade going into 2020. And after being exceptionally accommodative, financial conditions have tightened in recent months. Financial conditions are still supportive of growth by many measures (figure 2), but less so than last year.
There are risks on both sides of the economy's likely path. In Europe, there are risks associated with deliberations over Italy's fiscal and debt trajectory and the United Kingdom's deliberations on the Brexit deal. Here at home, we hear from businesses that the uncertainty associated with trade policy and the implications for supply chains may weigh on business capital spending. Although it is reasonable to expect fiscal spending to be extended around current levels in real terms after the Bipartisan Budget Act expires, we cannot rule out that fiscal policy could become a headwind in 2020.
The risks are two-sided. Business contacts report difficulties finding qualified workers and increased costs associated with inputs, tariffs, and transportation, along with somewhat greater ability to pass through those increases to consumer prices. Despite this, however, inflation remains muted overall. At 3.7 percent, the unemployment rate is at its lowest level in 49 years, and payrolls have been growing well above the pace that is consistent with labor market stabilization. Historically, the few periods when resource utilization has been similarly tight have seen elevated risks of either accelerating inflation or financial imbalances.
Our goal now is to sustain the expansion by maintaining the economy around full employment and inflation around target. The gradual path of increases in the federal funds rate has served us well by giving us time to assess the effects of policy as we have proceeded. That approach remains appropriate in the near term, although the policy path increasingly will depend on how the outlook evolves.
Assessing Vulnerabilities over the Cycle
The last several times resource utilization approached levels similar to today, signs of overheating showed up in financial-sector imbalances rather than in accelerating inflation. In contrast to the past, the Federal Reserve now has a systematic forward-looking approach to identifying increases in financial vulnerabilities. This monitoring is the focus of regular Federal Reserve Board and Federal Open Market Committee discussions. Last week, the Board released its first Financial Stability Report to help inform the public and promote transparency and accountability as we carry out our financial stability responsibilities.
While there has been substantial progress on reducing household debt burdens and increasing the resilience of the banking system, the Federal Reserve's assessment suggests that financial vulnerabilities associated with corporate debt are building against a backdrop of elevated risk appetite. Let me briefly review these developments in turn.
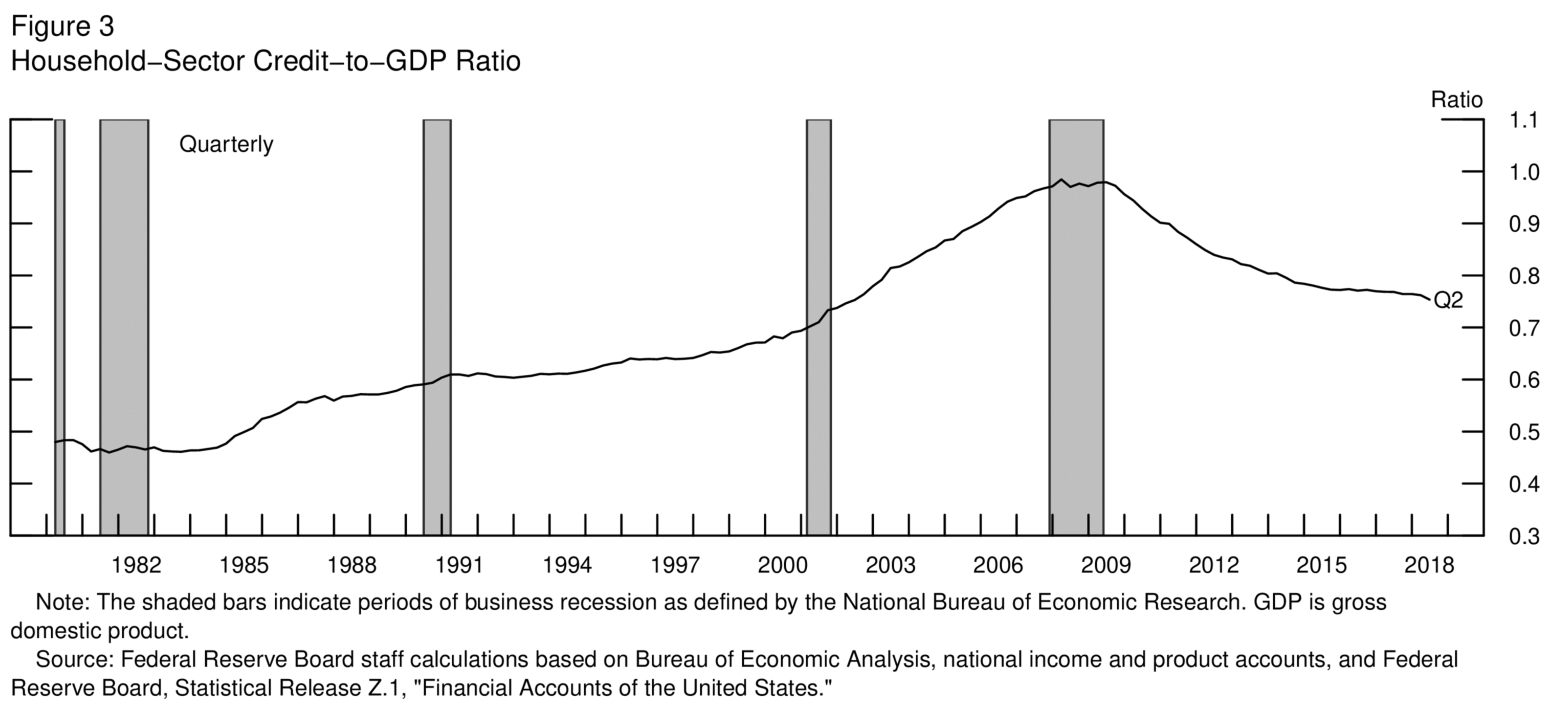
In contrast to the years preceding the crisis, when household borrowing was growing at a pace far above that of gross domestic product (GDP), it has since come down and is now growing more slowly than the economy overall (figure 3). Moreover, while much of the increase before the crisis reflected borrowing that proved unsustainable, more recent borrowing has been concentrated among households with strong credit profiles.
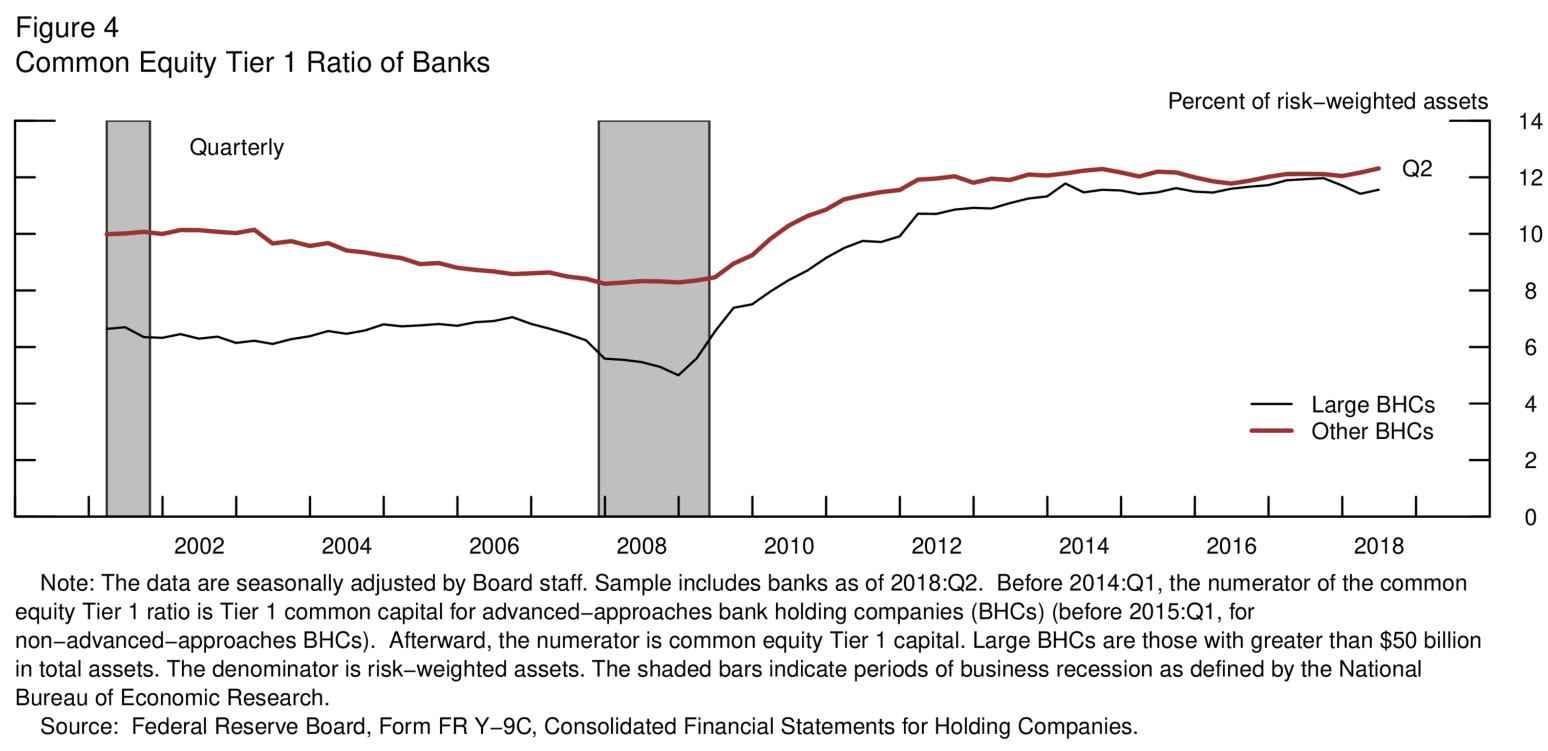
The regulated financial sector is also more resilient, owing to far-reaching reforms as well as favorable conditions. Large banks have increased both the size and quality of their capital buffers: The ratio of common equity to risk-weighted assets at large banks has increased by half relative to the pre-crisis average. It is now close to levels seen at smaller banks, although the risk-weighted capital ratio at large banks has moved down somewhat over the past year (figure 4). In addition, insurers appear generally well capitalized; broker-dealers, including those not affiliated with large bank holding companies, have reduced their leverage; and the outstanding values of funding vehicles that embed significant leverage, such as certain securitized products, are much lower. In contrast, there has been some evidence of rising use of leverage by hedge funds over the past year and a half.
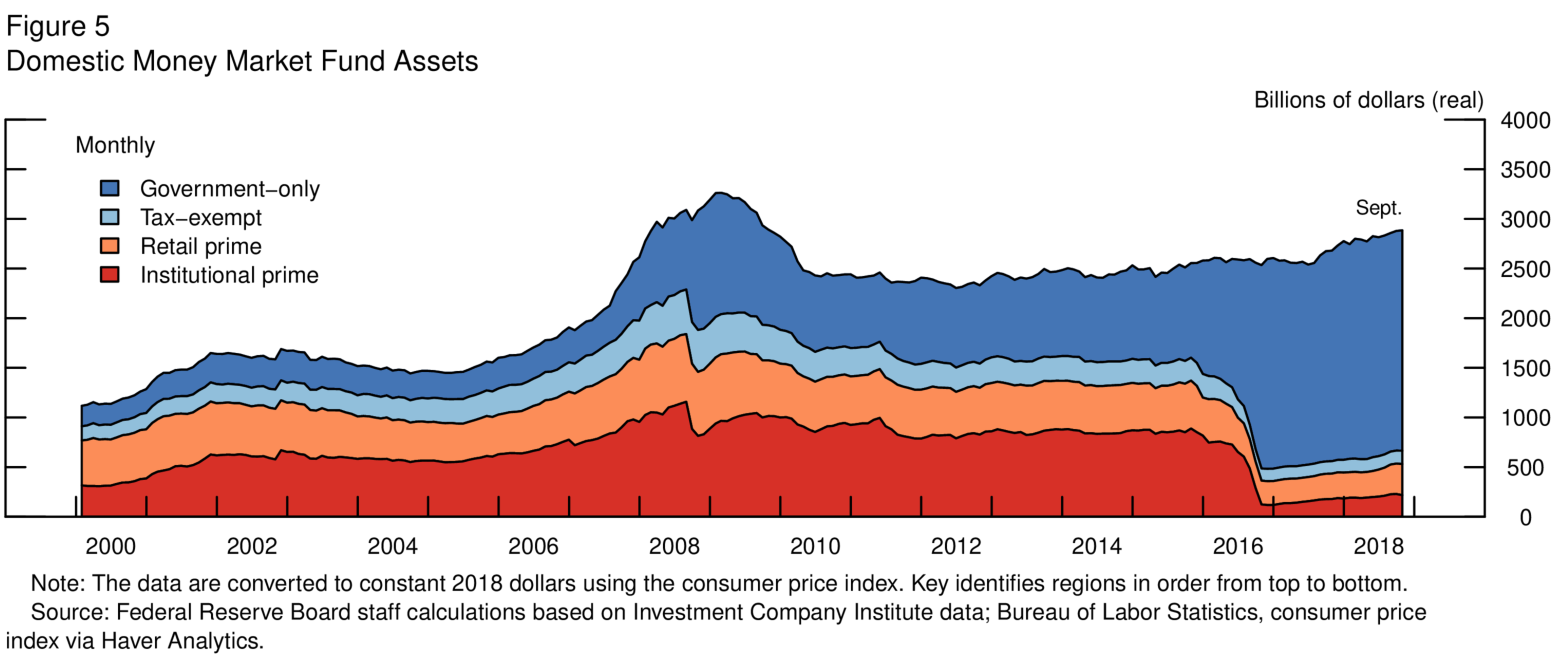
Financial reform has reduced funding risks associated with banks and money market funds. Large banks subject to liquidity regulation rely less on unstable short-term wholesale funding and have thicker liquidity buffers. As a result of money market reforms, investors have migrated toward government-only funds, which pose low run risk, and away from prime institutional funds, which proved highly susceptible to runs during the crisis and required extraordinary government support (figure 5).
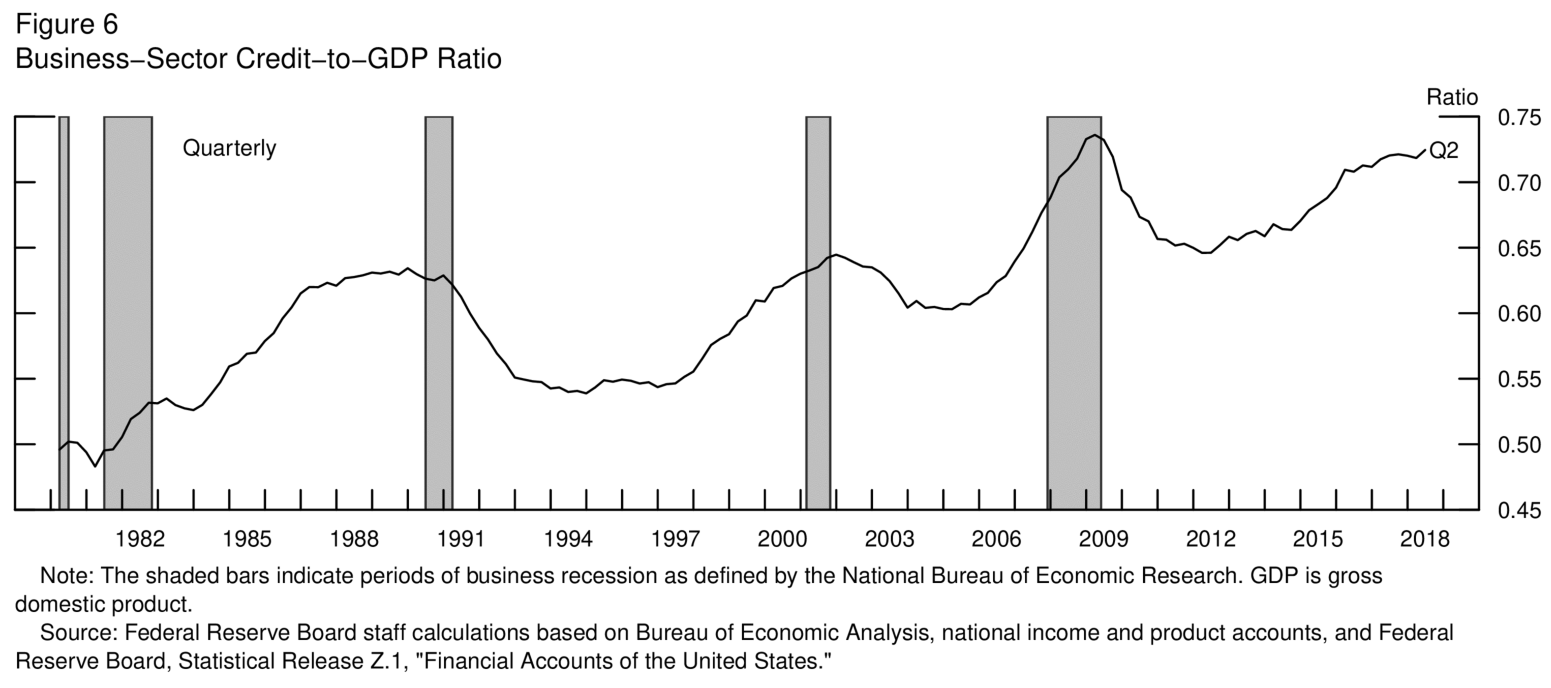
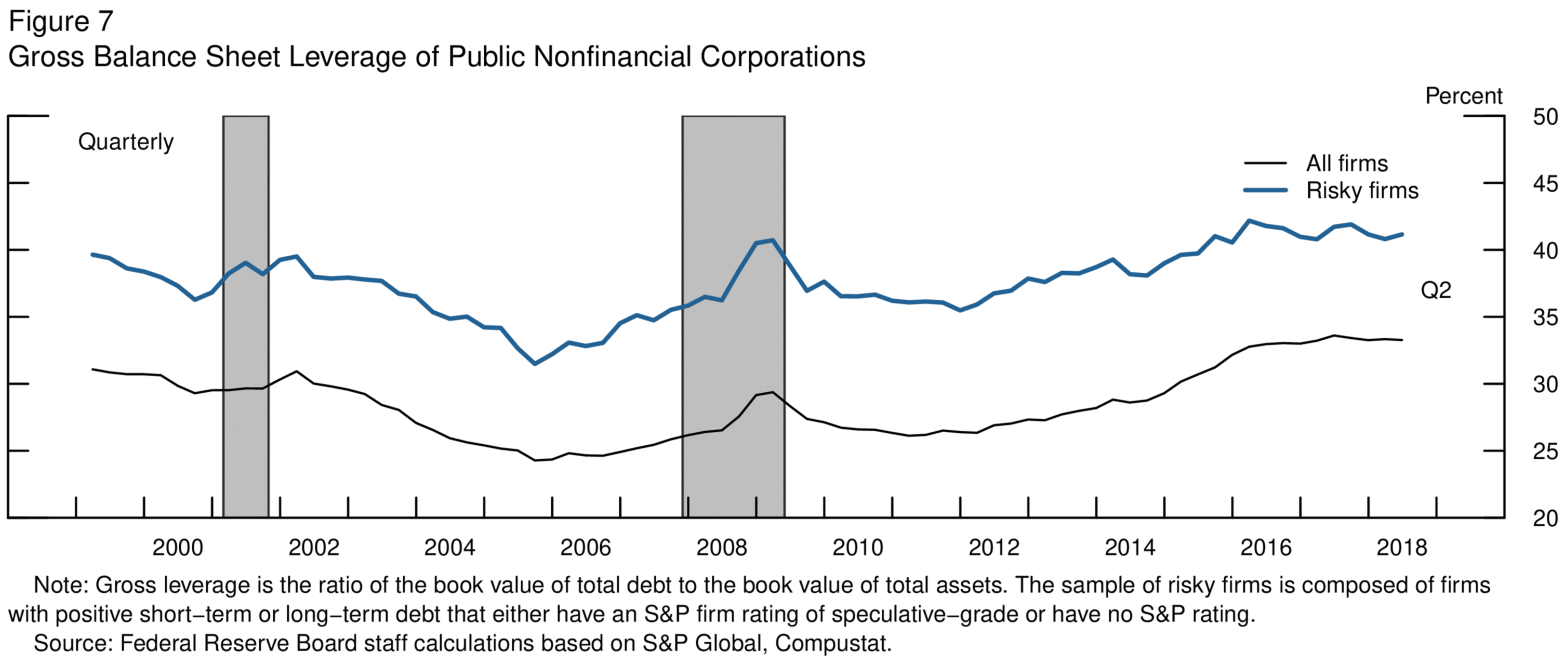
In contrast, we are seeing elevated vulnerabilities in the nonfinancial business sector.3 Business borrowing has risen more rapidly than GDP for much of the current expansion and now sits near its historical peak (figure 6). The run-up in corporate debt has brought the ratio of debt to assets close to its highest level in two decades on an overall basis, and this is also true for speculative-grade and unrated firms (figure 7). And whereas previously, mostly high-earning firms with relatively low leverage were taking on additional debt, analysis of detailed balance sheet information indicates that, over the past year, firms with high leverage, high interest expense ratios, and low earnings and cash holdings have been increasing their debt loads the most. Historically, high leverage has been linked to elevated financial distress and retrenchment by businesses in economic downturns.
Regarding corporate bonds outstanding, recent years have witnessed little change in the relative shares of investment-grade bonds and high-yield bonds. Credit quality has deteriorated within the investment-grade segment, where the share of bonds rated at the lowest investment-grade level has reached near-record levels. As of mid-2018, around 35 percent of corporate bonds outstanding were at the lowest end of the investment-grade segment, which amounts to about $2-1/4 trillion. In comparison, the share of high-yield bonds outstanding that are rated "deep junk" has stayed flat at about one-third from 2015 to 2018, well below the financial crisis peak of 45 percent.
In an economic downturn, widespread downgrades of these low-rated investment-grade bonds to speculative-grade ratings could induce some investors to sell them rapidly--for instance, because lower-rated bonds have higher regulatory capital requirements or because bond funds have limits on the share of non-investment-grade bonds they hold. This concern may be higher now than in the past, since total assets under management in bond mutual funds have more than doubled in the past decade to about $2.3 trillion this year. These funds now hold about one-tenth of the corporate bond market, and the redemption behavior of investors in these funds during a market correction is unclear. Bond sales could lead to large changes in bond prices and overall financial conditions if technological, market, or regulatory factors contribute to strains on market liquidity--a possibility that has been relatively untested over the course of the expansion.
Further down the credit quality ladder, there has been sizable growth in leveraged lending, accompanied by a notable deterioration in underwriting standards. Net issuance of debt to risky borrowers, which had stopped growing in late 2016, rebounded over the past year. Leveraged loans outstanding rose about 12 percent over the past 12 months and now stand around $1 trillion overall.4
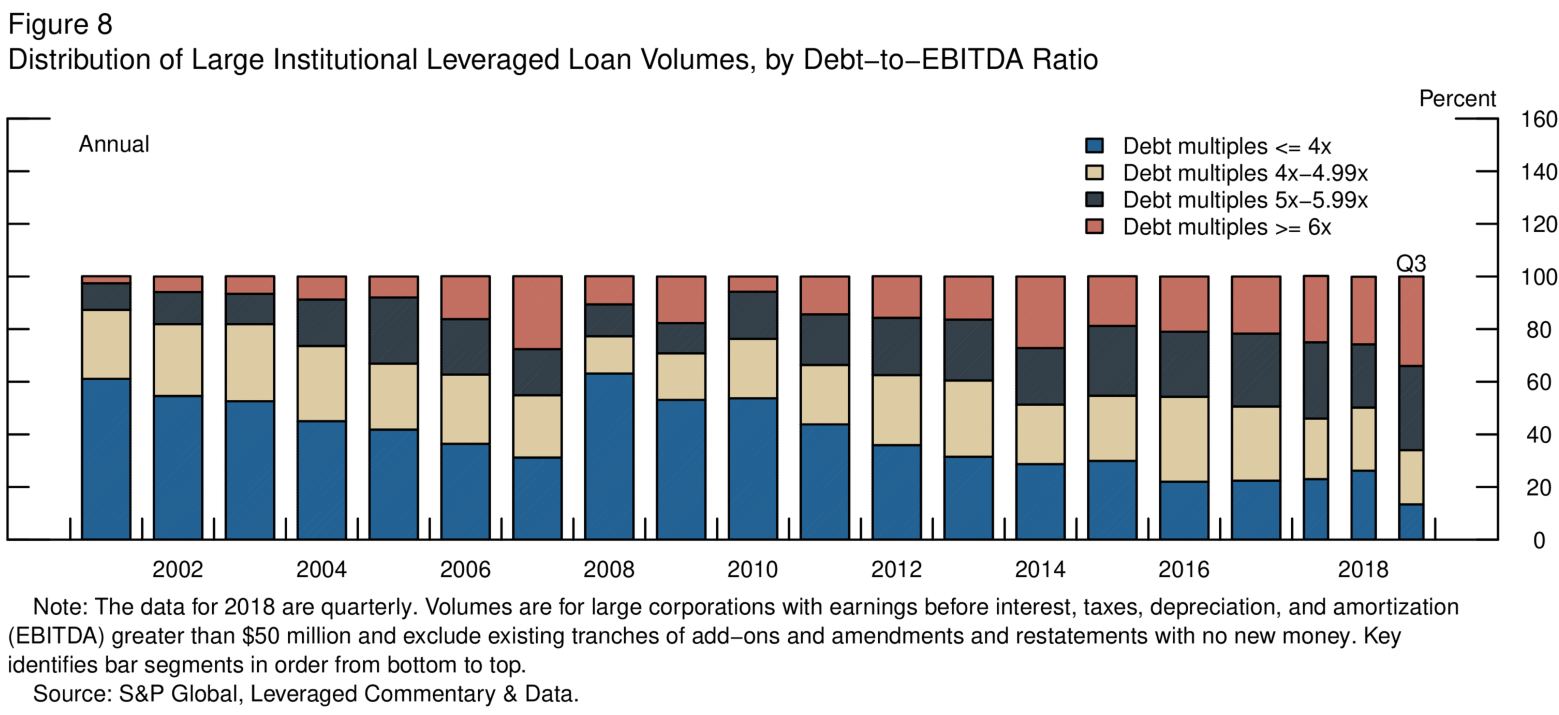
While leveraged loans have traditionally had important investor protections, loan covenants for new leveraged loans have weakened dramatically. Covenant-lite, or cov-lite, transactions now represent roughly 80 percent of the entire leveraged lending market--up from less than 30 percent a decade ago, when they were associated primarily with stronger borrowers. Deals increasingly involve features that increase opacity and risk, such as less subordinated debt; "EBITDA (earnings before interest, taxes, depreciation, and amortization) add backs," which could inflate the projected capacity of the borrowers to repay their loans; and "incremental facilities," which allow additional borrowing that is of equal seniority with the existing bank loan.5 The share of newly issued large loans to corporations with high leverage (debt to EBITDA ratios above 6) now exceeds previous peak levels observed in 2007 and 2014 (figure 8). Previously, much of this deterioration in underwriting appeared to be concentrated among nonbank lenders, but this year has witnessed a deterioration in underwriting at the largest banks. The widening adoption of practices that make risk harder to measure suggests a heightened focus on industry risk-management practices is warranted.6
A substantial share of the leveraged loans are packaged in collateralized loan obligations (CLOs). Gross issuance of CLOs hit $71 billion in the first half of 2018. This pace represents an increase of about one-third compared with the same period in the previous year.7
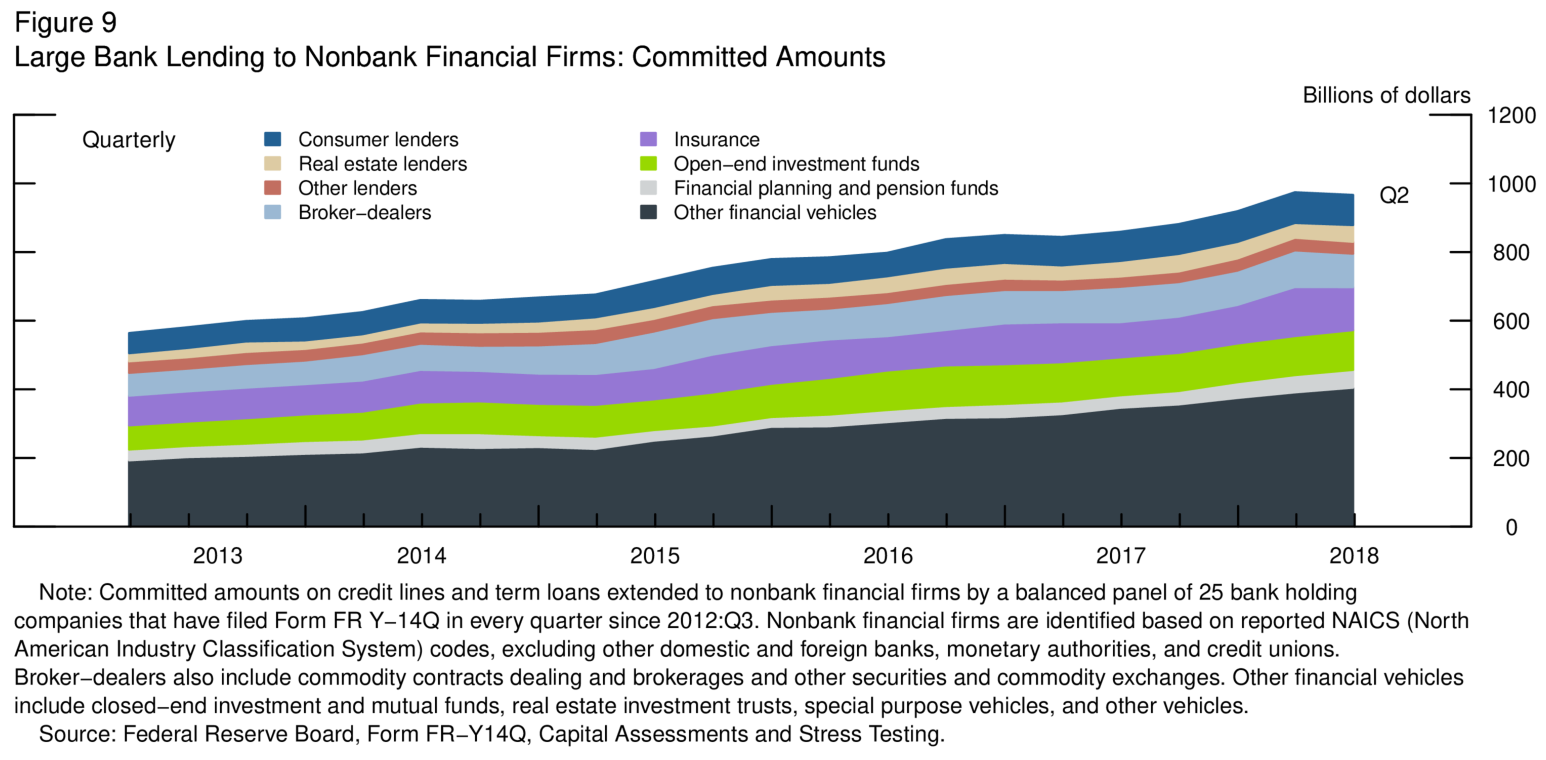
Many large banks are engaged in the origination of leveraged loans with an intent to distribute, often to CLOs. The originate-to-distribute model exposes banks to pipeline risk--the risk that some originated loans may be difficult to distribute if market conditions deteriorate. Although banks have improved pipeline management over the past decade, risk-management practices may have weakened somewhat recently in the face of strong investor demand. The direct exposures of the banking system, in the form of loan portfolios and warehousing exposures, can be tracked. But there are also indirect exposures, including through bank investments in CLOs on the order of $90 billion, that bear vigilance. More broadly, bank lines to the nonbank financial sector have increased notably (figure 9).
Loan funds have also become increasingly important in the leveraged loan market and are estimated to purchase about one-fifth of newly originated leveraged loans. If prices were to move sharply lower, a rush to redeem shares by open-ended mutual fund investors could lead to large sales of their relatively illiquid holdings, further exacerbating price declines and run incentives.
To date, the default rate on leveraged loans has been at the low end of its historical range, and corporate credit conditions have been favorable, with low interest expenses and low expected default rates. However, if spreads rise sharply or economic conditions deteriorate significantly, we could see downgrades, refinancing challenges, rising delinquencies and defaults, and losses to investors.
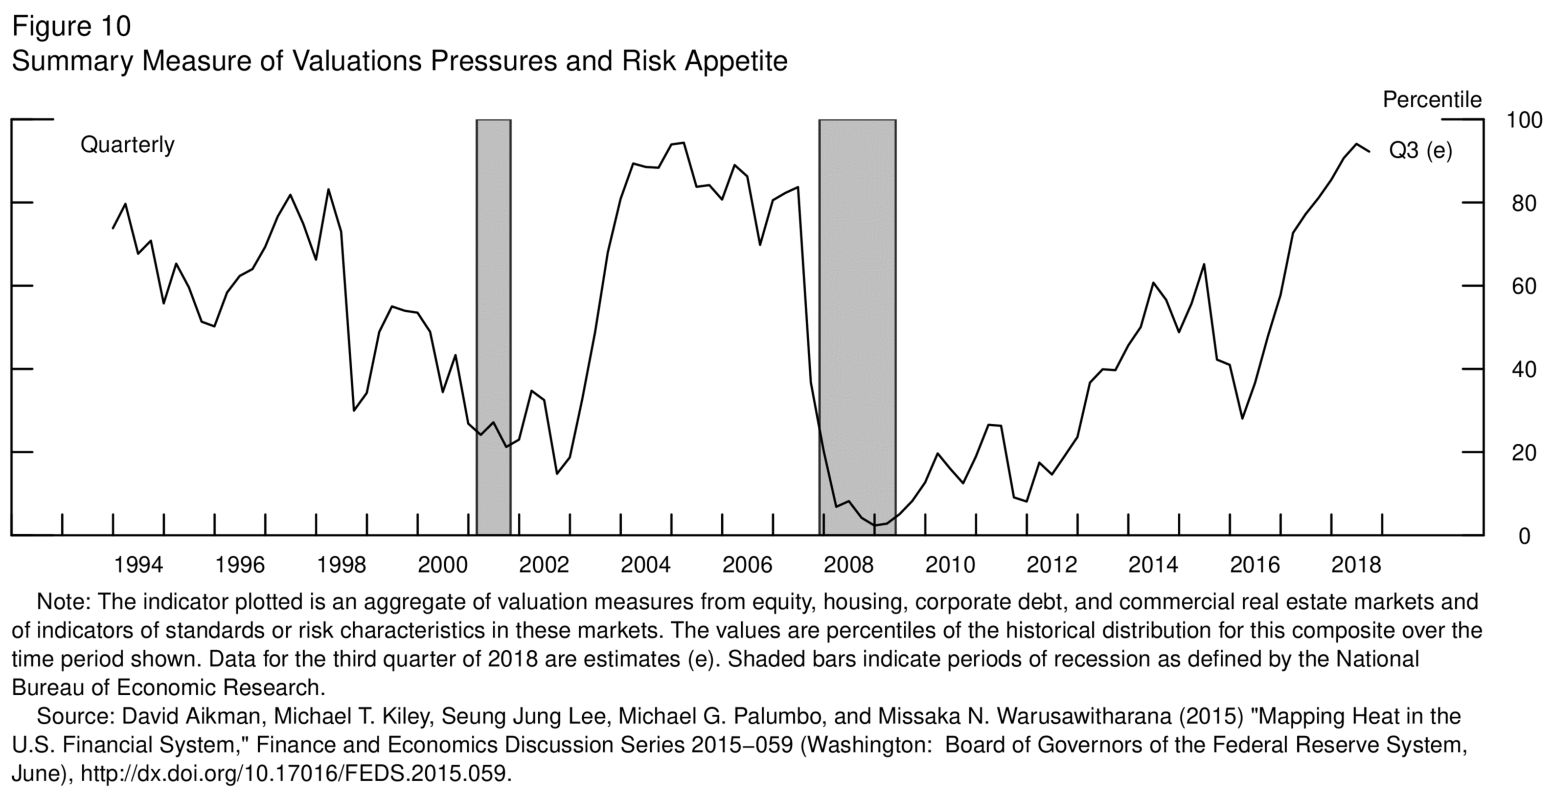
It is thus particularly notable that the run-up in business debt occurred against a backdrop of generally elevated valuations (figure 10). Even with the recent volatility in equity markets and the recent widening of corporate bond spreads, a range of asset prices remain high relative to historical benchmarks. In particular, yields on high-yield corporate bonds relative to Treasury securities remain somewhat narrow on a historical basis despite recent increases. Similarly, although they have moved up in recent months, spreads on leveraged loans remain in the low end of their range since the financial crisis, which is notable given the evidence of weakening protections. Finally, capitalization rates on commercial real estate properties, which measure annual income relative to prices for recently transacted properties, have been low relative to Treasury yields.
The generally high appetite for risk that we saw over the past two years makes the equity, corporate debt, and other asset markets more vulnerable to swings in market sentiment. In addition to generating losses for investors, declines in valuations could make it more challenging for firms to obtain or extend financing--especially among risky, indebted firms--which in turn could be amplified by the high levels of risky corporate debt.
Calibrating Policy over the Cycle
The assessment of financial vulnerabilities that I have outlined naturally raises the following question for policymakers: What is the appropriate risk tolerance? It goes without saying we must take all appropriate steps to prevent another Great Financial Crisis from causing the greatest contraction in global economic activity since the Great Depression. But it is also worth remembering that financial imbalances played a key role in each of the past three U.S. downturns--the risky investments and maturity mismatches associated with the savings and loan crisis and junk bond collapse; the tech boom and bust; and, most dramatically, the subprime crisis. This suggests policy might seek to moderate financial vulnerabilities when they are likely to materially exacerbate an economic downturn, leading to deeper declines in output and higher levels of unemployment.
Each of the past three U.S. recessions featured important financial imbalances, although they differed in important ways. Both economic theory and econometric evidence point to the risk that excesses in corporate debt markets could similarly amplify adverse shocks and contribute to job losses.8 The economics are straightforward. Over-indebted businesses may face payment strains when earnings fall unexpectedly, and they may respond by pulling back on employment and investment. The slowdown in activity lowers investor demand for risky assets, thereby raising spreads and depressing valuations. In turn, business losses accumulate, and delinquencies and defaults rise, reducing the willingness or the ability of banks to lend. This dynamic feeds on itself, potentially amplifying moderate adverse shocks into more serious financial strains or a recession.9
Given the risks to the financial system and economy from this potential adverse feedback loop, a strong case can be made that the financial system's buffers should be fortified when the economy is strong. Reinforcing capital buffers during the strong part of the cycle means that banks will have a cushion to absorb losses and remain sound during a subsequent downturn. Thicker capital buffers help bolster the confidence of market participants when conditions deteriorate, helping prevent the downward spiral from a loss of confidence. And during the downturn, that extra buffer can be released to enable banks to continue lending and help mitigate its severity. History suggests that we should not expect the market to provide incentives for banks to build the necessary buffers when times are good; the essence of the cycle is that market sentiment become overconfident precisely when risk is actually highest. One of the roles for independent regulatory bodies such as the Federal Reserve is to serve as a counterweight. Moreover, as we saw in the last crisis, it is much costlier to rebuild capital in a downturn when earnings and risk appetite are low than to build buffers in an expansion when earnings are strong.
At the Federal Reserve, the two important tools that can respond somewhat to rising vulnerabilities are the design of stress-test scenarios and the countercyclical capital buffer (CCyB). The annual supervisory stress test examines the resilience of large bank holding companies to a severely adverse scenario, which includes salient risks that can be adjusted over time. In recent years, the scenarios have been designed to explore severe dislocations in corporate credit markets as a salient risk.
Nonetheless, the stress tests have limitations as a countercyclical tool during buoyant periods. For instance, while the severity of the stresses can be varied from year to year to address emerging risks to some degree, it is difficult to introduce entirely new scenarios each year to target specific sectoral risks without introducing excessive complexity.10 And while the stress tests and proposed stress capital buffer are designed to calibrate capital buffers for the riskiness of an institution's particular assets and exposures, the capital buffer does not vary systematically to counter the cyclicality that arises through elevated asset valuations and other channels.11 The limited ability of the stress tests to increase loss-absorbing capacity during buoyant economic times is illustrated in the results from recent years, where scenarios have involved increasingly severe recessions and strains in corporate debt markets but generally lower declines in capital ratios. More broadly, capital ratios at the largest banks have been flat and, more recently, modestly lower.
In contrast, the first goal of the CCyB is to directly build resilience at large bank holding companies when there is an elevated risk of above-normal losses, which often follow periods of credit growth or rapid asset price appreciation. The second goal of the CCyB is to promote a more sustainable supply of credit over the economic cycle. The CCyB is expected to be reduced as credit growth slows in order to support credit supply at times when it might otherwise contract. As a rough rule of thumb, the criteria for implementing the CCyB described in the Board's framework of September 2016 are calibrated so that the CCyB will be above its minimum value of zero about one-third of the time--when financial vulnerabilities are assessed to be in the upper one-third of their historical distribution.12
There are several potential advantages to building additional resilience through the CCyB. First, countercyclical capital requirements are intended to lean against rising risks at a time when the degree of monetary tightening needed to achieve the same goal could be inconsistent with sustaining the expansion. And countercyclical capital requirements build resilience, unlike monetary policy. Second, the banks that are subject to the CCyB could achieve a modest buffer simply by safeguarding the capital they have built up or by reducing payouts moderately. Third, the CCyB is a simple, predictable, and slow-moving tool that applies equally across all large banks. It does not single out shortfalls in particular banks or result in hard-to-predict volatility in individual banks' stressed capital requirements. Finally and critically, the additional capital implied by the CCyB across the system can be released when conditions deteriorate to ensure the ability of large banks to lend into a downturn. A number of countries have raised their CCyB setting above zero, and we can learn from their experiences, which have generally been positive.13
Conclusion
Our job now is to sustain the expansion by maintaining the economy around full employment and inflation near target. Recent history suggests that the business cycle and the financial cycle are increasingly intertwined. If history is any guide, as resource utilization continues to tighten, there is some risk that financial imbalances could grow.
The U.S. financial system is much more resilient than before the crisis, owing importantly to strong financial reforms. Even so, the banking system's core capital and liquidity buffers have yet to be tested through a full cycle. At the same time, the appetite for risk among financial market participants rose notably over 2017 and much of 2018, and corporate borrowing has reached new heights amid rapid growth and deteriorating underwriting standards in riskier segments, such as leveraged lending. The mutual funds that have built up exposure to some of this risky debt have liquidity mismatches that could contribute to market dislocations in stressed conditions. This constellation of vulnerabilities could amplify adverse shocks that might materialize. At a time when cyclical pressures have been building and bank profitability has been strong, it might be prudent to ask large banking organizations to fortify their capital buffers, which could subsequently be released if conditions warrant.
References
Bank of England (2018). Financial Stability Report (PDF). London: BOE, November.
Basel Committee on Banking Supervision (2018). "Countercyclical Capital Buffer (CCyB)," webpage.
Bernanke, Ben, and Mark Gertler (1989). "Agency Costs, Net Worth, and Business Fluctuations," American Economic Review, vol. 79 (March), pp. 14-31.
Board of Governors of the Federal Reserve System (2013). "Federal Reserve Board Issues Final Policy Statement for Developing Scenarios for Future Capital Planning and Stress Testing Exercises," press release, November 7.
-------- (2016). "Regulatory Capital Rules: The Federal Reserve Board's Framework for Implementing the U.S. Basel III Countercyclical Capital Buffer (PDF)," final policy statement, September 8.
-------- (2018). Financial Stability Report (PDF). Washington: Board of Governors, November.
Brainard, Lael (2014). "The Federal Reserve's Financial Stability Agenda," speech delivered at the Hutchins Center on Fiscal and Monetary Policy, Brookings Institution, Washington, December 3.
-------- (2018a). "An Update on the Federal Reserve's Financial Stability Agenda," speech delivered at the Center for Global Economy and Business, Stern School of Business, New York University, New York, April 3.
-------- (2018b). "Safeguarding Financial Resilience through the Cycle," speech delivered at the Global Finance Forum, Washington, April 19.
López-Salido, David, Jeremy C. Stein, and Egon Zakrajšek (2017). "Credit-Market Sentiment and the Business Cycle," Quarterly Journal of Economics, vol. 132 (August), pp. 1373‑1426.
Office of the Comptroller of the Currency, National Risk Committee (2018). Semiannual Risk Perspective (PDF). Washington: OCC, Fall.
Vermilyea, Todd (2018). "Perspectives on Leveraged Lending," speech delivered at the Loan Syndications and Trading Association 23rd Annual Conference, New York, October 24, https://cdn.ymaws.com/www.iib.org/resource/resmgr/weekly_bulletin/10-24fedspeech_leveraged_len.pdf.
1. I am grateful to Michael Kiley and Namirembe Mukasa for their assistance in preparing this text. These remarks represent my own views, which do not necessarily represent those of the Federal Reserve Board or the Federal Open Market Committee. Return to text
2. See Board of Governors (2018). Return to text
3. In addition to the discussion of vulnerabilities presented in the Board's Financial Stability Report, the increase in risks associated with nonfinancial corporate borrowing is highlighted in the fall 2018 report Semiannual Risk Perspective, produced by the Office of the Comptroller of the Currency. See Office of the Comptroller (2018). Return to text
4. Estimates vary. The estimate of about $1 trillion in the Board's Financial Stability Report excludes lending to financial companies and generally excludes loan commitments by banks. The S&P Global Leveraged Loan Index is around $1.3 trillion. The estimate of $2.2 trillion in the Bank of England's Financial Stability Report is for the global market, including bank loans. Return to text
5. An "add back" is an unusual, discretionary, or nonrecurring expense that is added back to earnings with the intent of normalizing EBITDA. Examples include legal expenses, insurance costs, or owner-related expenses. Return to text
6. For a recent discussion of developments informed by the Federal Reserve's supervisory work, particularly through its review of the Shared National Credit program, see Vermilyea (2018). Return to text
7. For a recent comparison of the subprime mortgage market and the global market for leveraged loans, see Bank of England (2018). Return to text
8. For example, López-Salido, Stein, and Zakrajšek (2017) present empirical evidence linking corporate debt excesses to contractions in U.S. economic activity and review related research. Return to text
9. The broad contours of this dynamic are laid out theoretically in the literature on the financial accelerator. The classic reference is Bernanke and Gertler (1989). Return to text
10. For a discussion of the Federal Reserve's framework for designing scenarios, see Board of Governors (2013). Return to text
11. See Brainard (2014). Return to text
12. See Board of Governors (2016) and Brainard (2018a and 2018b). Return to text
13. Basel Committee (2018) reports the setting of the CCyB across countries. Return to text