September 07, 2022
Bringing Inflation Down
Vice Chair Lael Brainard
At the Clearing House and Bank Policy Institute 2022 Annual Conference, New York, New York
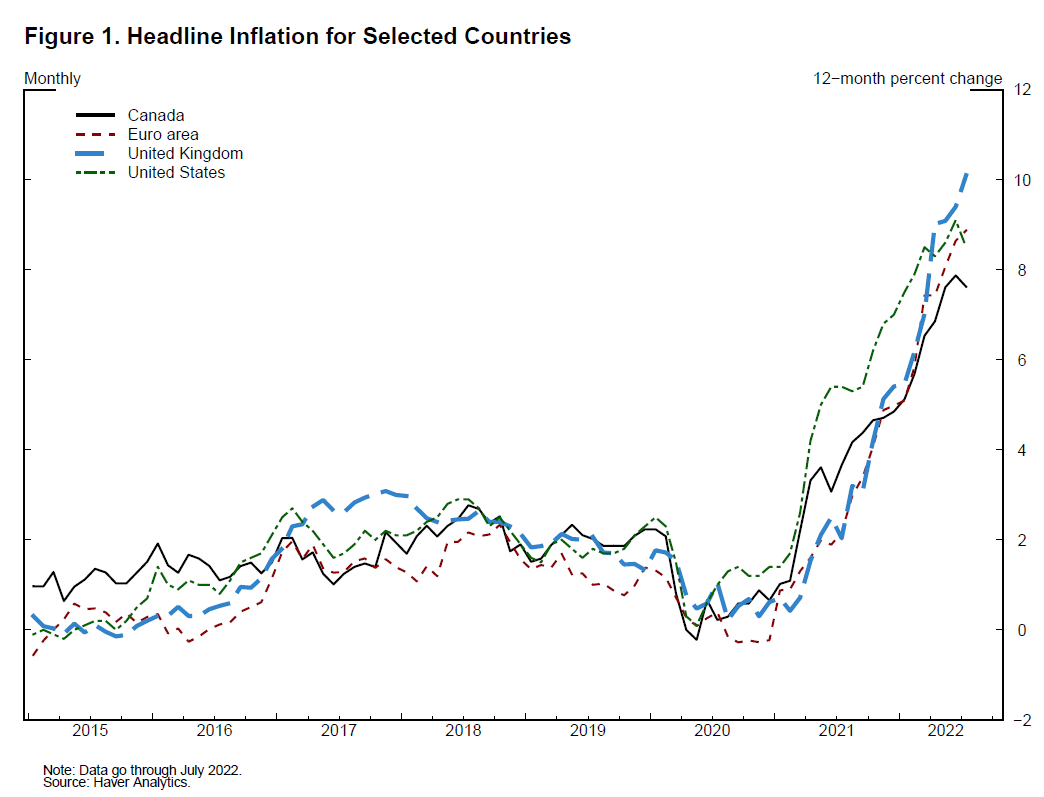
Over the past year, inflation has been very high in the United States and around the world (figure 1). High inflation imposes costs on all households, and especially low-income households. The multiple waves of the pandemic, combined with Russia's war against Ukraine, unleashed a series of supply shocks hitting goods, labor, and commodities that, in combination with strong demand, have contributed to ongoing high inflation. With a series of inflationary supply shocks, it is especially important to guard against the risk that households and businesses could start to expect inflation to remain above 2 percent in the longer run, which would make it much more challenging to bring inflation back down to our target. The Federal Reserve is taking action to keep inflation expectations anchored and bring inflation back to 2 percent over time.1
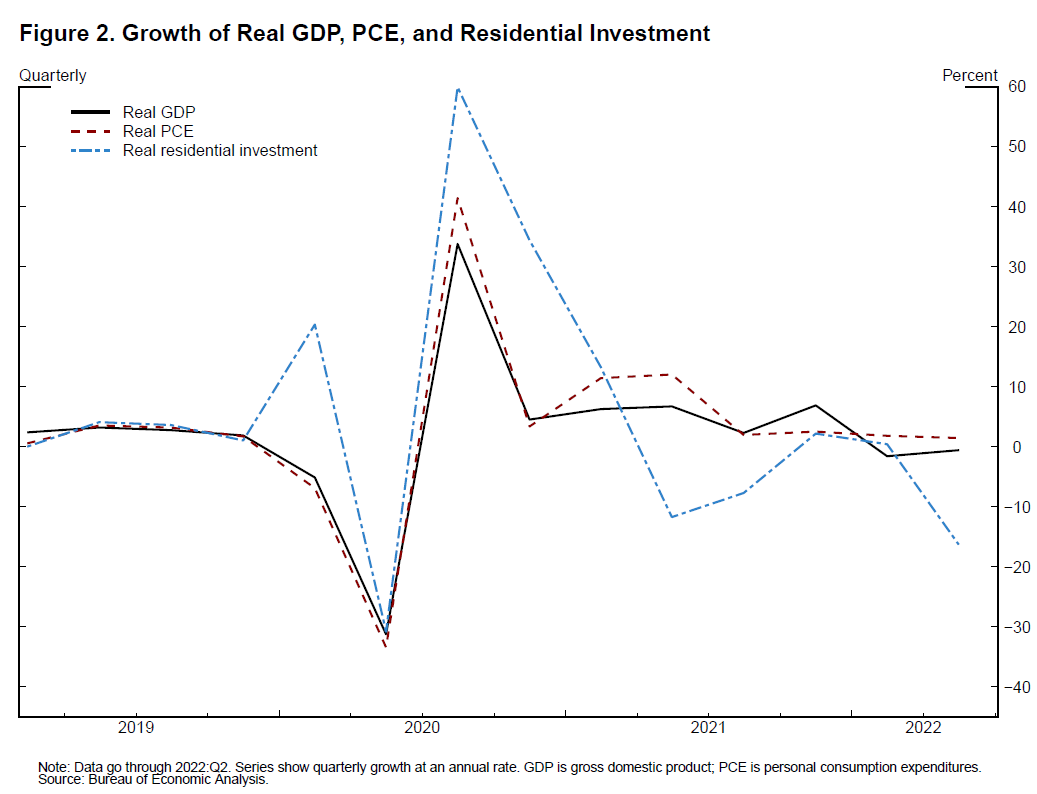
While last year's rapid pace of economic growth was boosted by accommodative fiscal and monetary policy as well as reopening, demand has moderated this year as those tailwinds have abated. A sizable fiscal drag on output growth alongside a sharp tightening in financial conditions has contributed to a slowing in activity. In the first half of 2022, real gross domestic product (GDP) declined outright, overall real consumer spending grew at just one-fourth of its 2021 pace, and residential investment, a particularly interest-sensitive sector, declined by 8 percent (figure 2).2
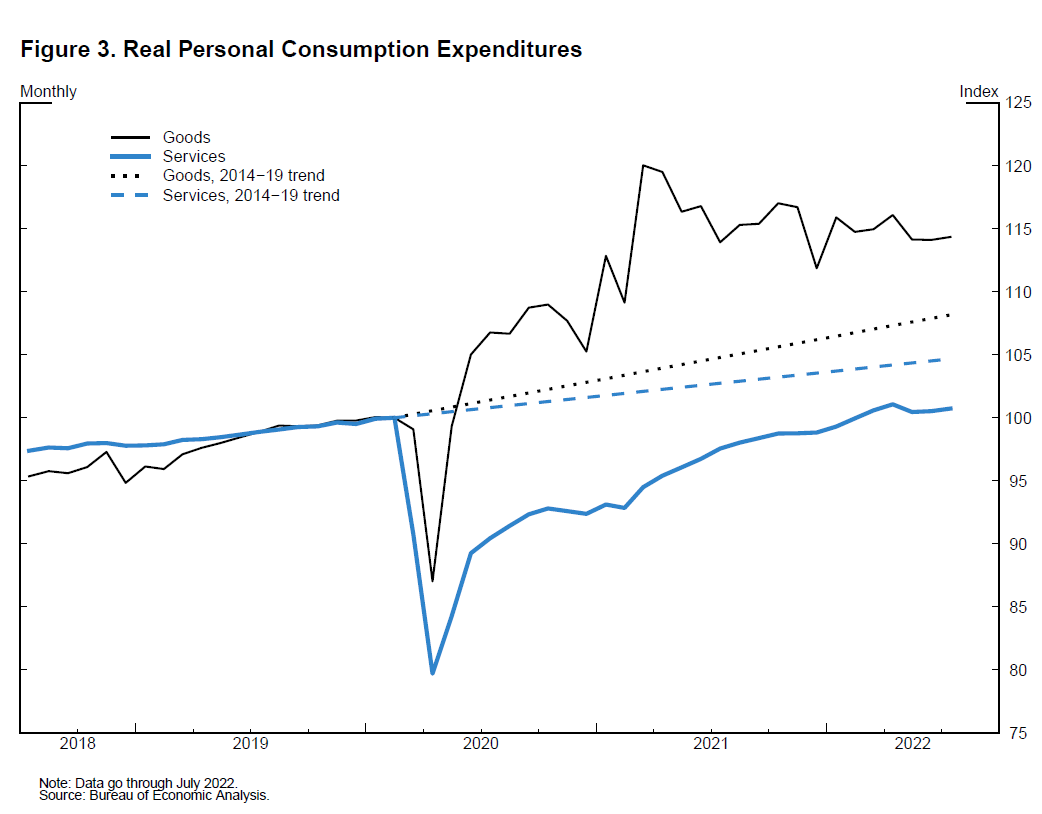
The concentration of strong consumer spending in supply-constrained sectors has contributed to high inflation. Consumer spending is in the midst of an ongoing but still incomplete rotation back toward pre-pandemic patterns. Real spending on goods has declined modestly in each of the past two quarters, while real spending on services has expanded at about half its 2021 growth rate. Even so, the level of goods spending remains 5 percent above the level implied by its pre-pandemic trend, while services spending remains 4 percent below its trend (figure 3).
In addition to the fiscal drag and tighter financial conditions, high inflation—particularly in food and gas prices—has restrained consumer spending by reducing real purchasing power. While price increases in food and energy are weighing on discretionary spending by all Americans, they are especially hard on low-income families, who spend three-fourths of their income on necessities such as food, gas, and shelter—more than double the 31 percent for high-income households.3
Since the very elevated prices at the pump in June, the nationwide average price of a gallon of regular unleaded gasoline has declined every day throughout July and August, most recently falling below $4 a gallon, according to the American Automobile Association.4 The rise and fall of gasoline prices played a major role in the dynamics of inflation over the summer, contributing 0.4 percentage point to month-over-month personal consumption expenditures (PCE) inflation in June and subtracting 0.2 percentage point in July. This 0.6 percentage point swing in the contribution of gasoline prices was an important driver of the decline in month-over-month PCE inflation from 1 percent in June to negative 0.1 percent in July.
In contrast, food price pressures continue to worsen, reflecting Russia's continuing war against Ukraine, as well as extreme weather events in the United States, Europe, and China.5 The PCE index for food and beverages has increased each month this year by an average of 1.2 percent, resulting in an 8-1/2 percent cumulative increase in the index year-to-date through July. For context, the net change in the food and beverages price index over the entire four-year period before the pandemic was only 0.5 percent.
Core inflation—inflation excluding volatile food and energy prices—also moderated in July. Core goods PCE inflation decelerated to 0.1 percent month-over-month in July after averaging 0.5 percent in May and June.6 While the moderation in monthly inflation is welcome, it will be necessary to see several months of low monthly inflation readings to be confident that inflation is moving back down to 2 percent.
How long it takes to move inflation back down to 2 percent will depend on a combination of continued easing in supply constraints, slower demand growth, and lower markups, against the backdrop of anchored expectations. With regard to supply constraints, a variety of indicators are showing signs of improvement on delivery times and supplies of some goods. In addition, labor force participation showed a welcome increase in the August employment data, particularly in the boost in participation among women in the core working years of 25 to 54 years of age. Even with this improvement, the participation rate is still 1 percentage point below its pre-pandemic level, well in excess of the decline in the participation rate that would have been expected due to retirements in the absence of the pandemic.
Reductions in markups could also make an important contribution to reduced pricing pressures. Last year's rapid demand growth in the face of supply constraints led to product shortages in some areas of the economy and high margins for many firms. Although we are hearing some reports of large retailers planning markdowns due to excess inventories, we do not have hard data at an aggregate level suggesting that businesses are reducing margins in response to more price sensitivity among customers. At an aggregate level, in the second quarter, measures of profits in the nonfinancial sector relative to GDP remained near the postwar peak reached last year.7
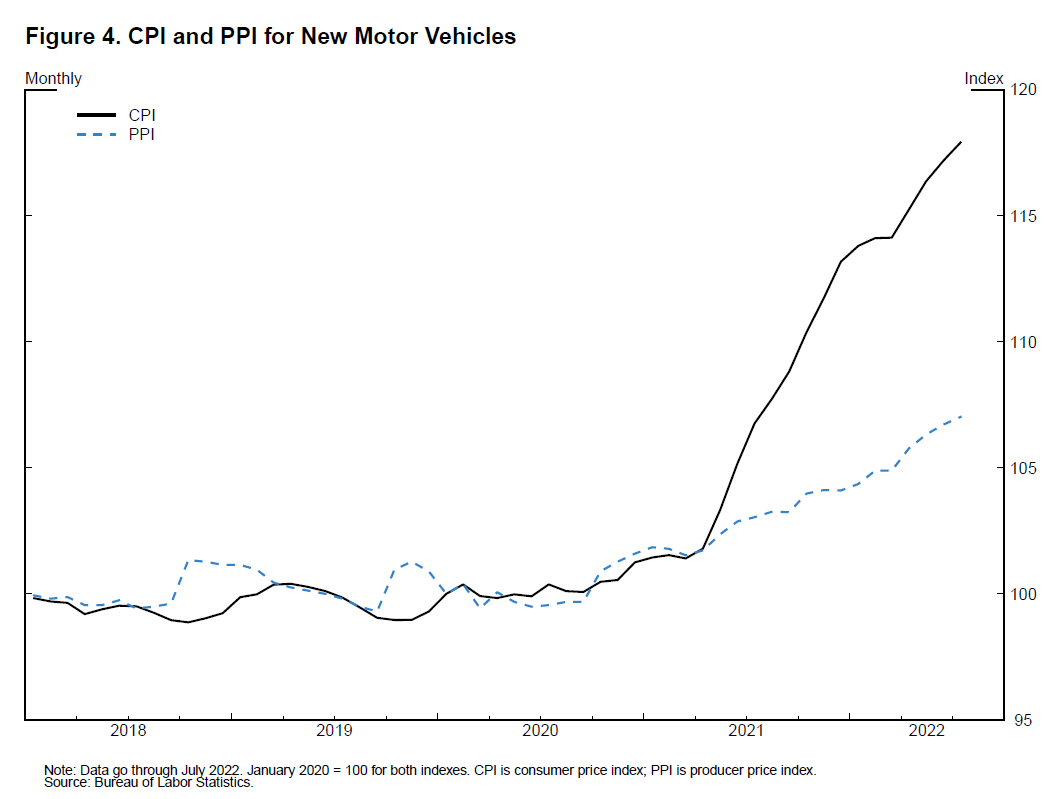
Using the available macroeconomic data, it is challenging to measure directly how much firms mark up their prices relative to their costs. That said, there is evidence at the sectoral level that margins remain high in areas such as motor vehicles and retail. After moving together closely for several years, starting early last year, the new motor vehicle consumer price index (CPI), which measures the price dealers charge to customers, diverged from the equivalent producer price index (PPI), which measures the price dealers paid to manufacturers. Since then, the CPI has increased three times faster than the PPI (figure 4). This divergence between retail and wholesale prices suggests an unusually large retail auto margin. With production now increasing, and interest-sensitive demand cooling, there may soon be pressures to reduce vehicle margins and prices in order to move the higher volume of cars being produced off dealer lots.
Similarly, overall retail margins—the difference between the price retailers charge for a good and the price retailers paid for that good—have risen significantly more than the average hourly wage that retailers pay workers to stock shelves and serve customers over the past year, suggesting that there may also be scope for reductions in retail margins. With gross retail margins amounting to about 30 percent of sales, a reduction in currently elevated margins could make an important contribution to reduced inflation pressures in consumer goods.
Labor demand continues to exhibit considerable strength, which is hard to reconcile with the more downbeat tone of activity. Year-to-date through August, payroll employment has increased by about 3-1/2 million jobs, a surprisingly strong increase given the decelerating spending and declining GDP over the first half of the year. The unemployment rate has fallen, on net, from 4 percent in January to 3.7 percent in August. Possibly the strongest indications that the labor market is tight were the first- and second-quarter readings of the employment cost index (ECI), which point to strong and broad-based growth in total hourly compensation. The 6.3 percent reading for the ECI in the second quarter was the largest annualized quarterly growth in compensation under this metric since 1982. The most recent reading of average hourly earnings suggested some possible cooling, decelerating from a gain of 0.5 percent in July to 0.3 percent in August, although it will be important to see additional data.
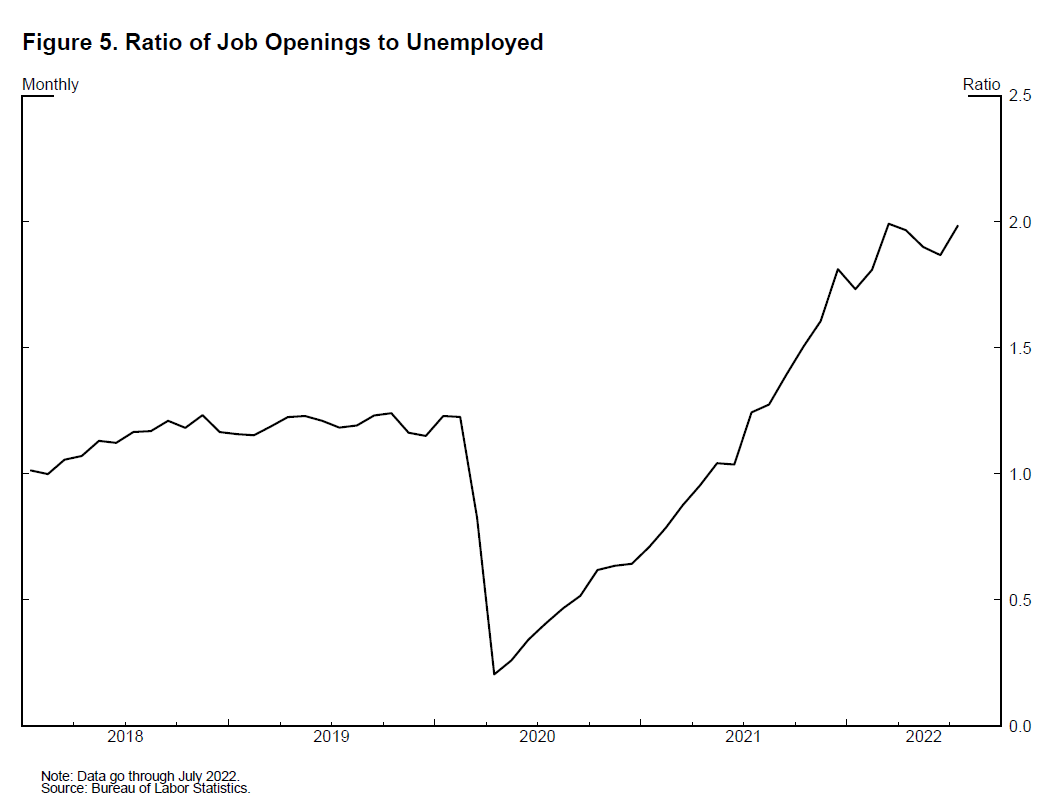
The deceleration in economic activity thus far this year has coincided with only a slight easing in job openings, on net, since their peak in March. The current high level of job openings relative to job seekers remains close to the largest in postwar history, consistent with a tight labor market (figure 5). Businesses that experienced unprecedented challenges restoring or expanding their workforces following the pandemic may be more inclined to make greater efforts to retain their employees than they normally would when facing a slowdown in economic activity. This may mean that slowing aggregate demand will lead to a smaller increase in unemployment than we have seen in previous recessions, but it is too early to draw any definitive conclusions, and I will be monitoring a variety of labor market indicators closely.8
As we follow through on our plan to move monetary policy to an appropriately restrictive stance, the effect of the increased policy rate and pace of balance sheet shrinkage should put downward pressure on aggregate demand, particularly in interest-sensitive sectors like housing. Continued improvements in supply conditions and a further rotation of consumption away from goods and into services should also help by reducing price pressures in goods. With regard to non-housing services, the magnitude of price pressure over the next several quarters will depend on an overall slowing in spending as well as the extent to which labor supply improves in these sectors.
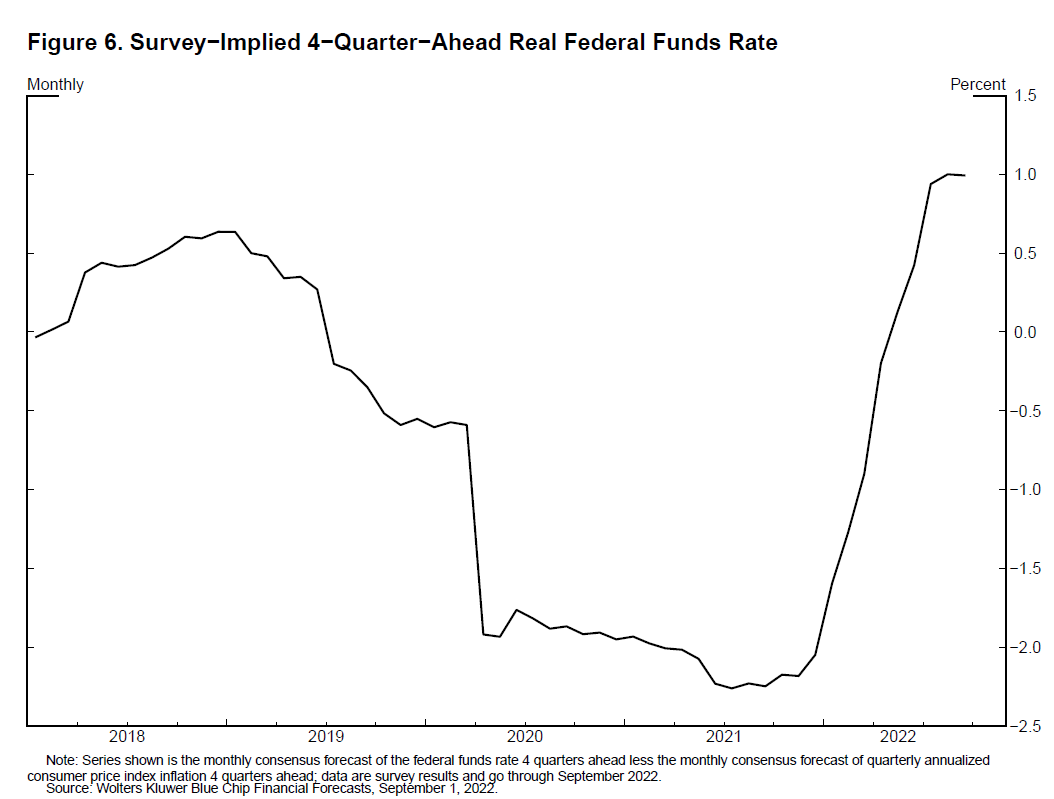
Since pivoting last year, our actions and communications have tightened financial conditions significantly and at a much more rapid speed than earlier cycles. So far during 2022, real 2-year yields have risen more than 350 basis points to about 1.2 percent, and 10-year real yields have risen almost 200 basis points and now stand at 0.85 percent—in the range of values for 10-year real yields from 2014 to 2018. The rapid tightening in monetary policy is also reflected in a significant increase in the projected real short rate: The Blue Chip Financial Forecasts has the expected short rate moving above 0.5 percent in real terms to a significantly higher level than pre-pandemic within the next 12 months (figure 6).
It may take some time for the full effect of these tighter financial conditions to work their way through the economy. The disinflationary process here at home should be reinforced by weaker demand and tightening in many other countries. This is particularly the case as Europe contends with downside risks to activity and a severe energy shortage caused by Russia's war against Ukraine, and as China maintains its zero-COVID approach against a backdrop of weaker consumption.
At some point in the tightening cycle, the risks will become more two-sided. The rapidity of the tightening cycle and its global nature, as well as the uncertainty around the pace at which the effects of tighter financial conditions are working their way through aggregate demand, create risks associated with overtightening. And if history is any guide, it is important to avoid the risk of pulling back too soon. Following a lengthy sequence of adverse supply shocks to goods, labor, and commodities that, in combination with strong demand, drove inflation to multidecade highs, we must maintain a risk-management posture to defend the inflation expectations anchor.9 While we have no control over the supply shocks to food, energy, labor, or semiconductors, we have both the capacity and the responsibility to maintain anchored inflation expectations and price stability.
We are in this for as long as it takes to get inflation down. So far, we have expeditiously raised the policy rate to the peak of the previous cycle, and the policy rate will need to rise further. As of this month, the maximum monthly reduction in the balance sheet will be nearly double the level of the previous cycle.10 Together, the increase in the policy rate and the reduction in the balance sheet should help bring demand into alignment with supply. Monetary policy will need to be restrictive for some time to provide confidence that inflation is moving down to target. The economic environment is highly uncertain, and the path of policy will be data dependent. While the precise course of action will depend on the evolution of the outlook, I am confident we will achieve a return to 2 percent inflation. Our resolve is firm, our goals are clear, and our tools are up to the task.
1. I am grateful to Kurt Lewis of the Federal Reserve Board for his assistance in preparing this text and to Kenneth Eva for preparing the figures. These views are my own and do not necessarily reflect those of the Federal Reserve Board or the Federal Open Market Committee. Return to text
2. For comparison, growth in the alternative activity measure of real gross domestic income (GDI) has come in just below potential in the first half of the year. The national income and product accounts contain two measures of total economic output, measured through an expenditure approach, reported as more-familiar GDP, or an income approach, reported as GDI. These two series generally track each other fairly closely, but research indicates that some independent information about the business cycle can be found in each of the series. The gap between the levels of GDP and GDI, known as the statistical discrepancy, was over $750 billion in the second quarter, by far its largest historical size. For a discussion of these series and the business cycle, see Jeremy J. Nalewaik (2010), "The Income- and Expenditure-Side Estimates of U.S. Output Growth," (PDF) Brookings Papers on Economic Activity, Spring, pp. 71–106. Return to text
3. For more details on this difference and further information on how the effect of inflation varies across households, see Lael Brainard (2022), "Variation in the Inflation Experiences of Households," speech delivered at the Spring 2022 Institute Research Conference, Opportunity and Inclusive Growth Institute, Federal Reserve Bank of Minneapolis, Minneapolis, April 5. Return to text
4. For more information, see https://gasprices.aaa.com. Return to text
5. See, for example, Kim Chipman and Tarso Veloso Ribeiro (2022), "Dried-Out Farms from China to Iowa Will Pressure Food Prices," Bloomberg, August 27. Return to text
6. Price increases for nondurable goods moderated, and price declines in used vehicles as well as durable goods other than motor vehicles more than offset further increases in the prices of new cars and trucks. Prices for PCE services excluding energy and housing declined 0.1 percent in July, the first price decline in this category since November 2020. Return to text
7. After-tax profits in the nonfinancial corporate sector, adjusted for inventory valuation and capital consumption and expressed as a fraction of nominal GDP, were 13 percent in the second quarter. This is just slightly lower than the series high since 1947 of 13.5 percent, set in the second quarter of 2021. Return to text
8. The debate in this area can be seen in two recent pieces. See Andrew Figura and Chris Waller (2022), "What Does the Beveridge Curve Tell Us about the Likelihood of a Soft Landing?" FEDS Notes (Washington: Board of Governors of the Federal Reserve System, July 29); and Olivier Blanchard, Alex Domash, and Lawrence H. Summers (2022), "Bad News for the Fed from the Beveridge Space," Peterson Institute for International Economics, Policy Brief 22-7 (Washington: PIIE, July), https://www.piie.com/sites/default/files/documents/pb22-7.pdf. Return to text
9. See Ricardo Reis (2022), "The Burst of High Inflation in 2021–22: How and Why Did We Get Here?" working paper. Return to text
10. As of September 2022, the monthly caps on the runoff of Treasury securities and mortgage-backed securities are $60 billion and $35 billion per month, as compared with $30 billion and $20 billion, respectively, from 2017 to 2019. Return to text