March 24, 2011
Changed Circumstances: The Impact of the Financial Crisis on the Economic Condition of Workers Near Retirement and of Business Owners
Governor Elizabeth A. Duke
At the Virginia Association of Economists Sandridge Lecture, Federal Reserve Bank of Richmond, Richmond, Virginia
It is an honor to be invited to deliver the annual Sandridge lecture to the Virginia Association of Economists. This series has a long history of important discussions, including the now-famous global savings glut speech by then-Governor Ben Bernanke in 2005. I confess to being quite intimidated by this illustrious history, but I hope to heighten interest in my own contribution by offering you something prized by economists everywhere--fresh data. I am going to draw on preliminary data from the Federal Reserve's Survey of Consumer Finances (SCF) to talk about the impact of the financial crisis on the wealth of consumers and small business owners.
As the recent financial crisis unfolded, I kept coming back to two questions that seemed central to understanding the way consumers and small businesses might respond to changes in their own circumstances during the crisis and, importantly, how their attitudes toward spending and investing might change going forward.
The first question had to do with the relationship between household wealth and the saving rate. And as a baby boomer myself, I wondered whether the relationship between wealth and savings might be especially important as the baby boomers faced a change in wealth just as most were planning to retire. So I am going to talk first about how changes in wealth impacted the spending plans and risk tolerance of consumers closest to retirement.
The other question that continually arises is whether the sharp reduction in small business credit was due to changes in the supply of credit, demand for credit, or creditworthiness of potential borrowers. While the SCF data do not offer any definitive answers, they do give some previously unavailable insight into the role of creditworthiness, if we use changes in wealth as proxies for changes in creditworthiness.
I want to apologize in advance. I found that the rich data set offered some occasionally surprising insights into both of these questions, and I was unable to choose between the two topics. The result is a somewhat overpacked discussion. Despite that, I warn you: These results are the tip of a very large iceberg and may spur more questions than answers in your minds.
The Survey of Consumer Finances
As some of you may know, the SCF is the premier source of microlevel information on the finances of American families. The survey is normally conducted every three years by selecting a new sample of consumers willing to provide detailed responses to questions about their personal finances. Because aggregate data consistently indicated that the crisis was having severe negative effects on households, the Federal Reserve thought a follow-up survey of 2007 survey participants would offer a unique opportunity to understand the impact of the financial crisis on individual families and the resulting changes in the financial decisions and outlooks of those families. Although we are only beginning to mine the data, I believe the richer understanding of individual circumstances provided by the data set will prove invaluable in its ability to help us understand how consumers are approaching a number of important decisions, such as spending, saving, and wealth accumulation.
In 2009, we launched a program to conduct follow-up interviews with participants in our 2007 SCF to update their information. As always, consumers' willingness to share their personal data in the interest of better public policy is a critical requirement for these surveys, and participants' privacy is strictly guarded. We are extremely grateful for the public-spirited people who dredge through their financial statements, pension accounts, credit card bills, and tax returns to give us the most accurate information possible. And we are particularly grateful to the nearly 90 percent of the participants in the 2007 survey who did so a second time in 2009.
The panel interviews were concluded in early 2010, and Board staff spent most of the rest of the year preparing this complex set of data for analysis. Earlier today, the Federal Reserve published a research paper providing an overview of the data, and further results are expected to follow.1
Changes in Household Wealth
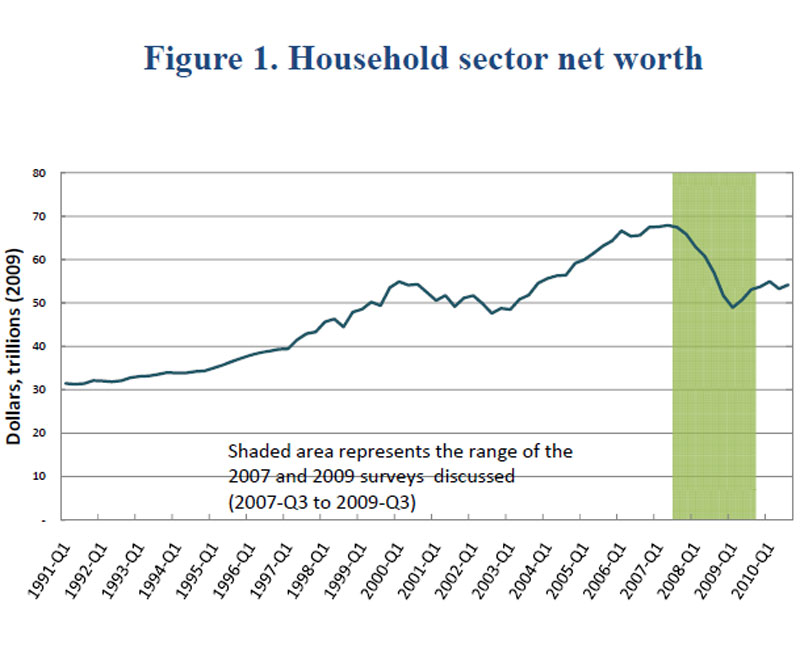
The shocks to household wealth associated with the most recent recession were extraordinary by any measure. According to the Federal Reserve's flow of funds accounts, household net worth peaked in the second quarter of 2007 and then fell approximately 28 percent during the next two years (figure 1).
The initial shocks to housing and to financial assets wiped out most of the wealth gains realized since the aftermath of the tech crash in 2001. There has been some recovery in wealth since the trough, but since early 2010 it has remained fairly flat.
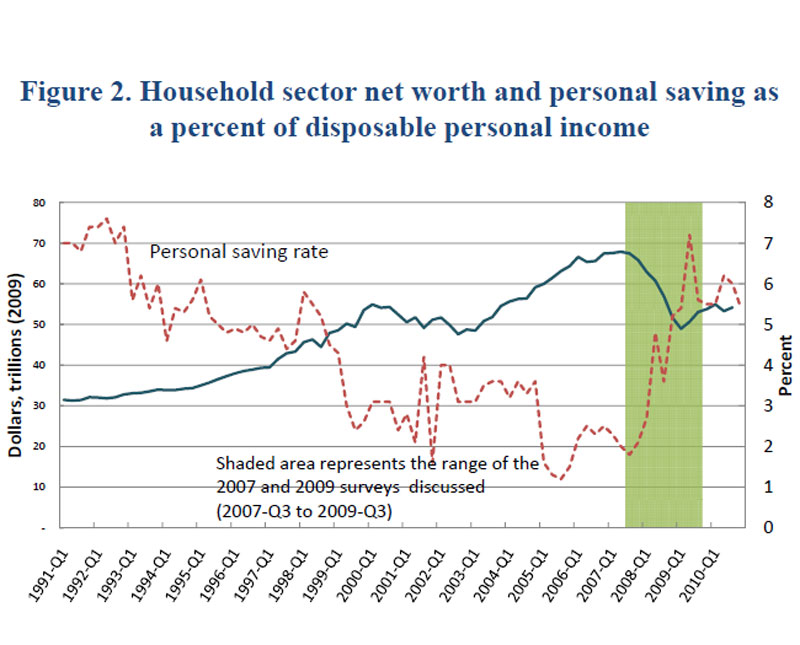
The personal saving rate, which had been trending downward before the recession, jumped during the crisis as spending retreated (figure 2). Traditional macroeconomic analysis would attribute at least some of the increase in the saving rate and corresponding drag in the recovery of consumer spending to diminished household wealth. That direct effect might be compounded if the wealth decline also affected consumers' confidence and expectations, which could affect families' future decisions. For example, workers on the cusp of retirement might need to work longer than they had planned and business owners might be unable or unwilling to leverage their personal assets to fund or expand their businesses. In addition, if attitudes toward risk have shifted, households might make different decisions about spending, or about saving, than they have in the past.
Diversity of Wealth Outcomes in 2009
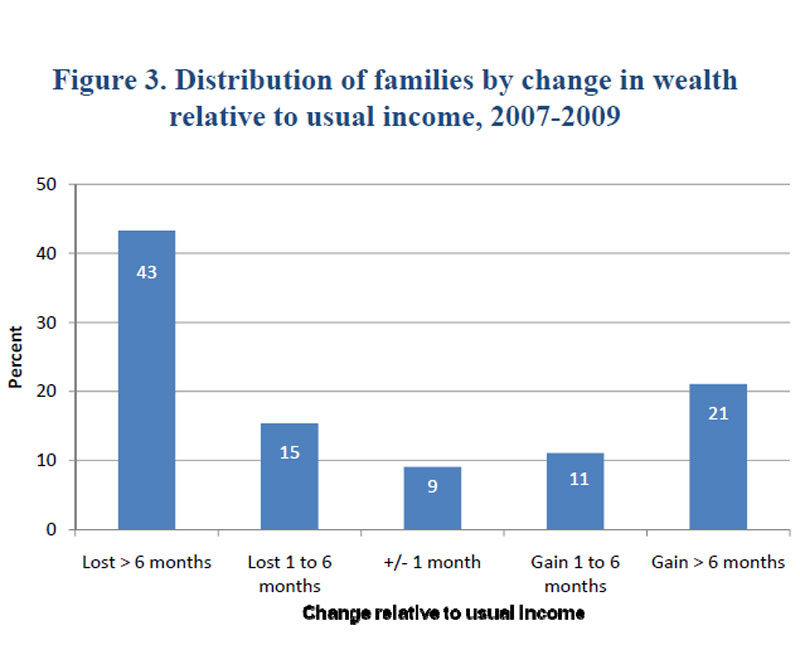
The overall pattern of wealth decline, however, masks the stark differences in outcomes for individual families. To put these wealth changes in perspective, it is useful to look at them relative to a measure of the scale of families' circumstances and, thus, to a possible link with spending. Income is one such possible measure, but it can be quite "noisy" because income may be affected by a variety of transitory factors.
In the SCF, we include a measure of the level of income that families consider their usual income.2 Taking this measure as a scaling device for wealth changes, we see that 43 percent of families saw a wealth decline equal to or more than six months of their usual income (figure 3). Almost a third saw a loss greater than an entire year of their usual income (not shown). However, more than a fifth of families saw a gain in wealth that was greater than six months of their usual income.
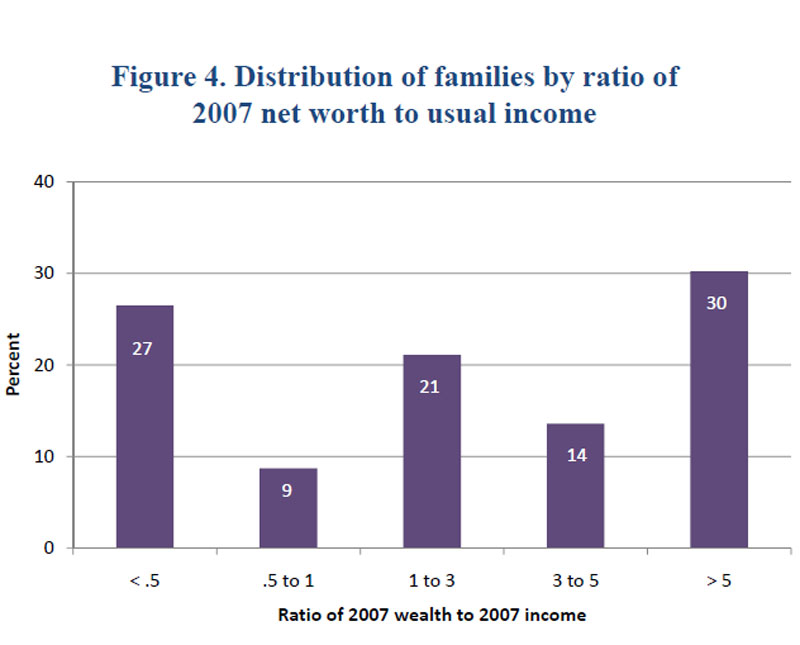
To put these changes in wealth in perspective, it is useful to consider the level of household wealth relative to normal income before the crisis. In 2007, more than one-quarter of families had total wealth equal to or less than six months of their usual income, so a change of this magnitude would be quite significant for those families (figure 4). In contrast, for nearly one-third of households, their wealth was more than five times their usual income.
At the level of individual families, changes in wealth appear to have been driven primarily by changes in asset valuation, not by changes in ownership (that is, by changes in portfolio composition). Comparisons of patterns of ownership in 2007 and 2009 do show some differences, but the dominant pattern across families is no change in portfolio holdings. Moreover, responses to a question we asked about changes in portfolio composition over the crisis indicate that 54 percent of all families made no change at all in their portfolios over the period covered by the panel SCF. This is perhaps surprising, given the large change in asset values that occurred during the crisis.
Preretirement Age Group
In this dataset, the preretirement group includes families whose household head was between 50 and 61 years old in 2007. This age group traditionally has a particularly strong effect on the overall economy because the preretirement years are typically characterized by peak earnings, peak saving, and peak spending. The baby-boom generation, by virtue of its sheer size, has had an outsized influence on the economy as it has entered every stage in the life cycle, and its magnification of the preretirement effect is no exception. In addition, in 2007, this group held more than one-third of all household net worth. Because wealth is a key driver of household decisions about spending, saving, and investment, we might expect behavioral shifts in response to wealth changes to have significant effects on the performance of the U.S. economy. We will look at changes from 2007 to 2009 in the attitudes of this group and how those changes might vary depending on whether they experienced gains or losses in wealth during the crisis.
I chose the preretirement group to examine because of its significant size and wealth, but also because this seemed like the group most likely to be affected by changes in wealth and to feel the need to change behavior as a result of any such changes. The preretirement group must accumulate assets to sustain itself through retirement, continue working, or rely on their children or the government for support. Given their vast numbers, the adjustments they make can affect the course of the economy. So it is informative to look at how the finances of this group were impacted by the crisis and how they have changed their outlook as a result.
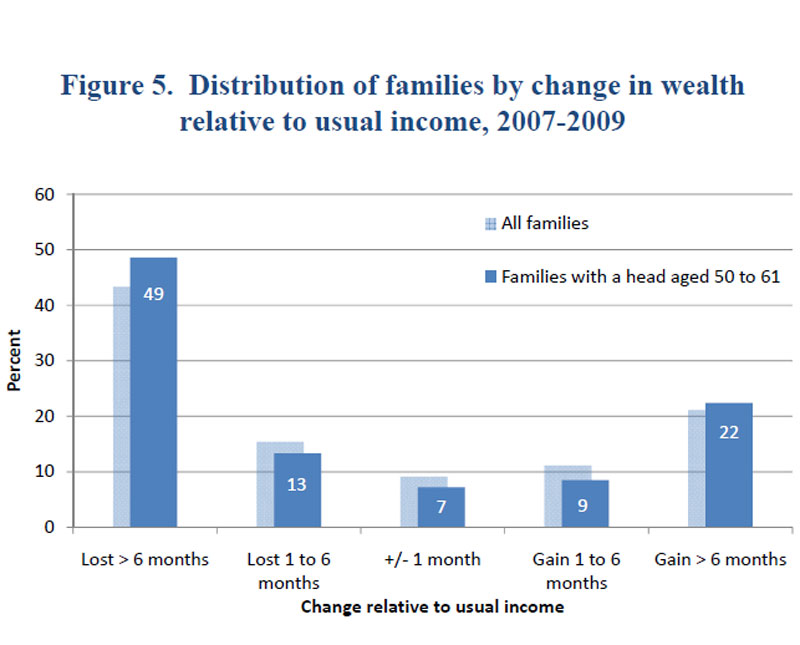
As was the case for families overall, experiences varied widely. The share of families in the 50-to-61 age group that saw a substantial increase in their net worth--more than six months of their usual income--was nearly the same as for families overall (figure 5). But 49 percent of the age group saw a decline of more than six months of their usual income, compared with 42 percent of families overall.
Implications for Behavior
It would be reasonable to expect households' plans and attitudes to vary based on the individual wealth outcomes they experienced. But in comparing responses from boomer families that lost wealth to those that gained wealth, we found remarkably similar answers.
In 2009, more than two-thirds of the preretirement group reported that their expected retirement age was at least a year later than what they reported in 2007. The share of families expecting to extend their working life was very similar regardless of their change in wealth. This likely suggests increased uncertainty about the future, no matter what their experience during the financial crisis, as also suggested by other results in the survey.
In terms of asset management, more than half of the preretirement families reported that they plan to make no changes at all in the next few years; this result holds across all wealth-change groups. But among those who do expect to make changes, increased savings was the most commonly reported goal.
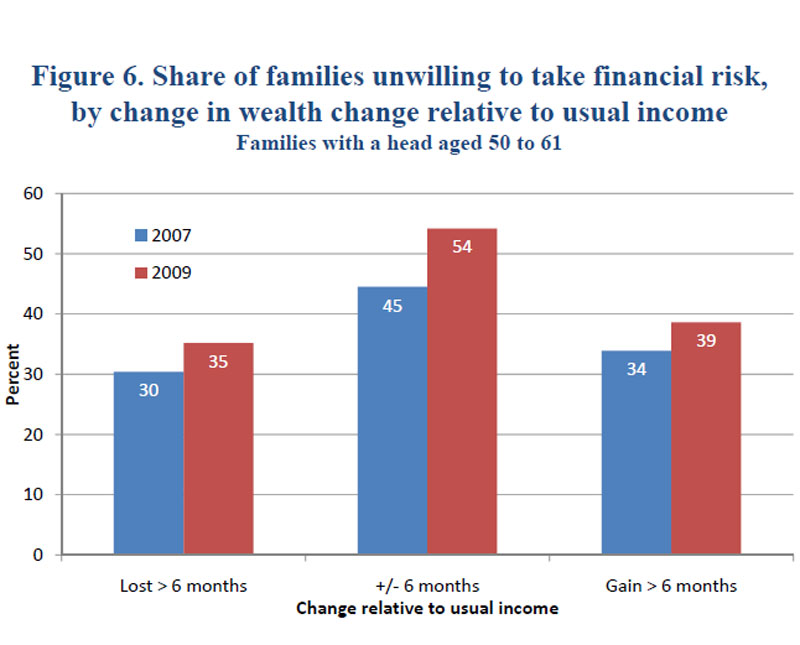
Boomer families' reported willingness to take on financial risk also changed over the panel period. Regardless of the change in their wealth, these families were more likely to report being more unwilling to take financial risk in 2009 than in 2007 (figure 6).
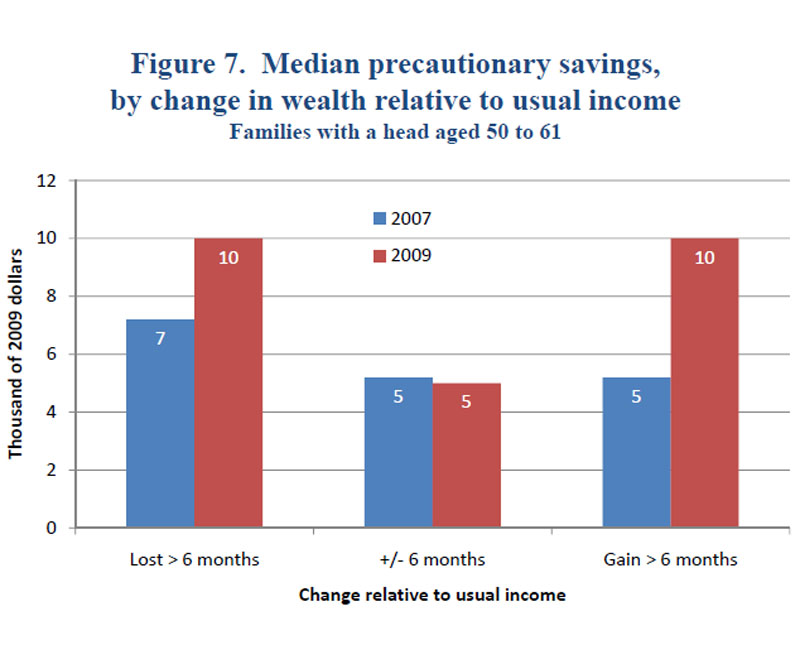
This sense of increased caution is reinforced by the answers to questions the survey posed to families about the amount of money they think they need to cope with emergencies and other unexpected events. The median value of this measure of desired precautionary savings increased substantially from 2007 to 2009 for the preretirement groups that experienced large changes in wealth, regardless of whether the change was a gain or a loss, and was virtually unchanged for others (figure 7). Furthermore, the largest percentage increase was for families that experienced wealth gains.
The large changes in asset prices over the period may have had an effect on the willingness of the families in this age group to consume out of gains to assets or to reduce spending in response to asset losses.3 The survey responses suggest that the large drop in asset prices over the period may have increased boomer families' sensitivity to future losses more than it affected their sensitivity to future gains. In other words, it made them more cautious.
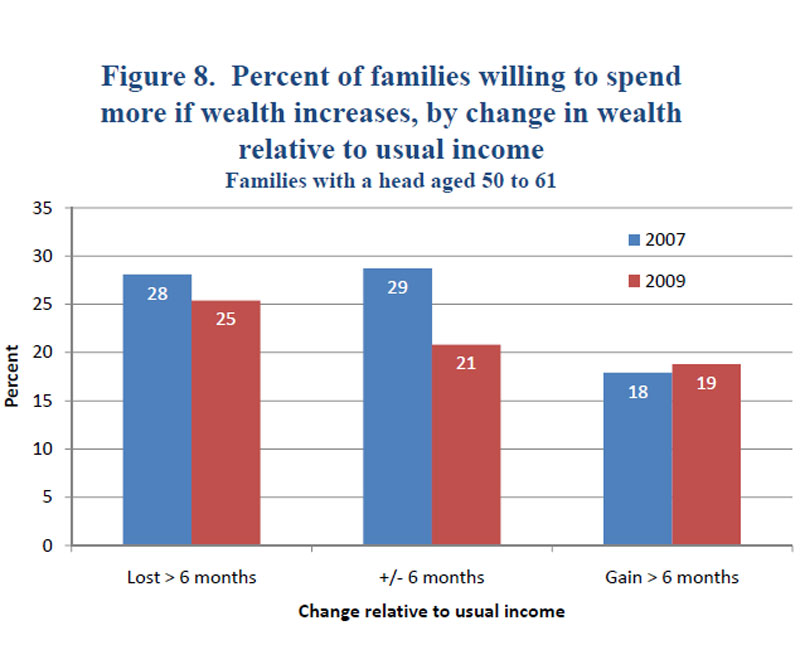
In the boom years leading up to the crisis, many economists believed that increases in wealth, especially increases in home equity, helped fuel consumer spending. However, fewer than 30 percent of boomer families reported in 2007 that they would be willing to spend out of any increase in asset values. In 2009, that willingness declined for boomer families that experienced losses as well as for boomer families that experienced only small gains. Somewhat counterintuitively, boomer families that experienced significant gains in their net worth from 2007 to 2009--gains greater than the equivalent of six months of income--also remained largely unwilling to spend out of increases in asset values. In fact, they were among the least willing in 2007 and they remained among the least willing two years later. Thus, boomer families remained cautious, or grew more cautious, about spending out of their asset gains--regardless of whether they experienced significant losses during the crisis (figure 8).
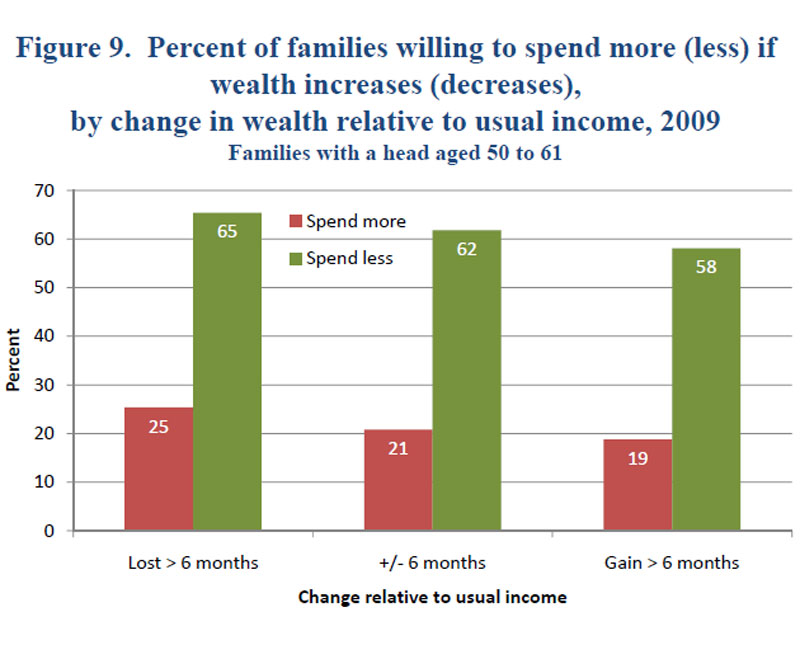
However, the response of spending plans to the prospect of asset losses appears to be stronger than the response to the prospect of asset gains. Every wealth-change group reported being more than twice as likely to decrease spending if asset values declined than they were to increase spending if asset values rose (figure 9). All of this evidence may help explain the sharp drop in consumer spending as household wealth declined and the continued sluggishness of consumer spending even as asset values have recovered. This asymmetry in responses holds over all age groups as well.
The varied change in wealth for preretirement families, taken together with the changes in retirement plans, risk attitudes, and willingness to spend in response to changes in wealth, imply that some of the effects of recent economic turmoil may result in a longer period of economic adjustment than has been the case in past recessions, as fundamental attitudes appear to have shifted.
I think the higher level of caution displayed by all households in the group, regardless of whether the change in their individual circumstances was positive or negative, is especially interesting. This indicates that changes in risk appetite result from observations of changes to the circumstances of others as much as to changes in one's own circumstances. Responses regarding attitudes toward modifying spending as asset values rise and fall suggest that the relationship between the saving rate and household wealth might be even more persistent than in the past. Such an impact would be further magnified if changes in wealth also impacted borrowing patterns and credit approval.
To look at credit indicators, I decided to focus on business owners in order to examine the impact of changes in wealth on access to business as well as consumer credit.
Business Owners
The preretirement and business owner groups I have chosen are not mutually exclusive. Indeed, there is quite a bit of overlap. More than 30 percent of small business owners in 2007 were part of the preretirement group, and they tended to be among the wealthier members of that group. In fact, the business owner group held nearly half of all household wealth in 2007.
Small businesses employ roughly half of private-sector workers, they fill critical niches throughout the economy, and they are often seen as sources of innovation. For many, the ability to leverage personal assets is a critical factor in developing their businesses.
Concern over credit availability for small businesses has appropriately been a recurring worry throughout the crisis, but information about the intersection between business performance, personal finances, and credit has been hard to find. While the data are still not definitive, the panel survey allows us to look at supply, demand, and assessment of creditworthiness from the borrowers' point of view.
Although the SCF is focused on families, not businesses, it does collect substantial information on the closely held businesses families own. The survey clearly shows a high degree of interdependence of personal and business finances for many families with businesses. For example, families make loan guarantees for their businesses using personal assets as collateral, and loans between business owners and their businesses are common in both directions. According to the most recently available data from the Census Bureau's Survey of Business Owners, 6 in 10 small business owners use personal savings or assets to finance or expand their businesses.
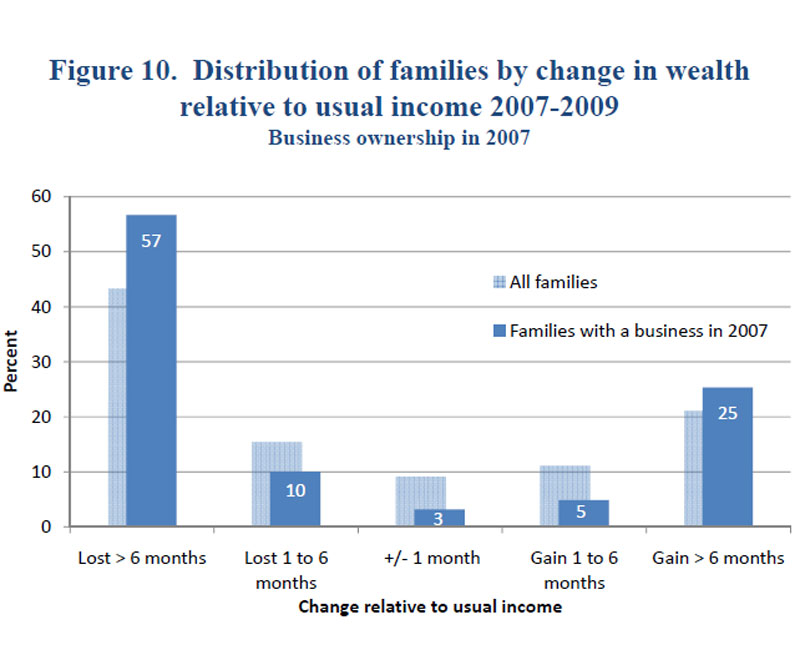
The spread of gains and losses from 2007 to 2009 was sharper for business owners than for the population overall (figure 10). Fifty-seven percent of business owners saw substantial losses in their net worth relative to their usual income, compared with 43 percent of the overall population; but the percentage of business owners who saw large wealth gains relative to their income was also larger than for the overall population.
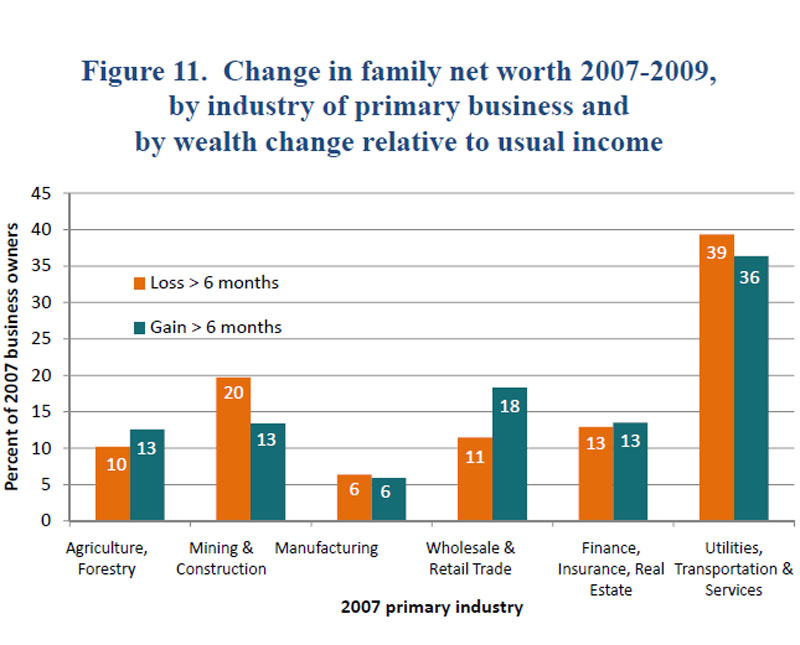
The industry in which the business operated had a significant impact on whether the business owner gained or lost wealth. Families with businesses primarily engaged in mining or construction--among small businesses in the survey, this was overwhelmingly construction-related businesses--were the most likely to see a substantial decline in net worth (figure 11). In contrast, families with a wholesale or retail business were more likely to see a substantial gain. Those involved in utilities, transportation, and services--in the survey, this was predominantly services--saw the largest gains and the largest losses, but losses exceeded gains for the group.
Only 82 percent of the consumers who reported owning a business in 2007 also reported owning a business in 2009. And some of those who remained business owners may have scaled back their operations while awaiting recovery. We do not have the detail necessary to assess the importance of reduced operations directly, but we have some suggestive evidence. For businesses that were in operation in both 2007 and 2009, we see decreased median and mean business incomes for owners who saw their wealth fall and the reverse for owners whose wealth rose.
Some of the decrease in activity may be driven by a decline in demand for services, but some may come from credit constraints. For a variety of reasons, we cannot look directly at changes in credit availability for business owners and their businesses, but we can look at two indicators for the owners who had a continuing business in 2009.
Some business owners use proceeds from personal loans for business purposes or use personal assets to secure business loans. In other cases, the business itself may apply on its own. If the business is a sole proprietorship, there is no legal distinction between business and personal borrowing, but business owners still may view their personal and business debt separately.
The 2009 SCF panel interview asked participants to report separately whether they had applied for personal and business loans during the two-year period. If they had, it asked whether they had been turned down for a loan. The survey also asked whether they had wanted to borrow for personal or business purposes but had been so convinced they would be turned down that they did not apply.
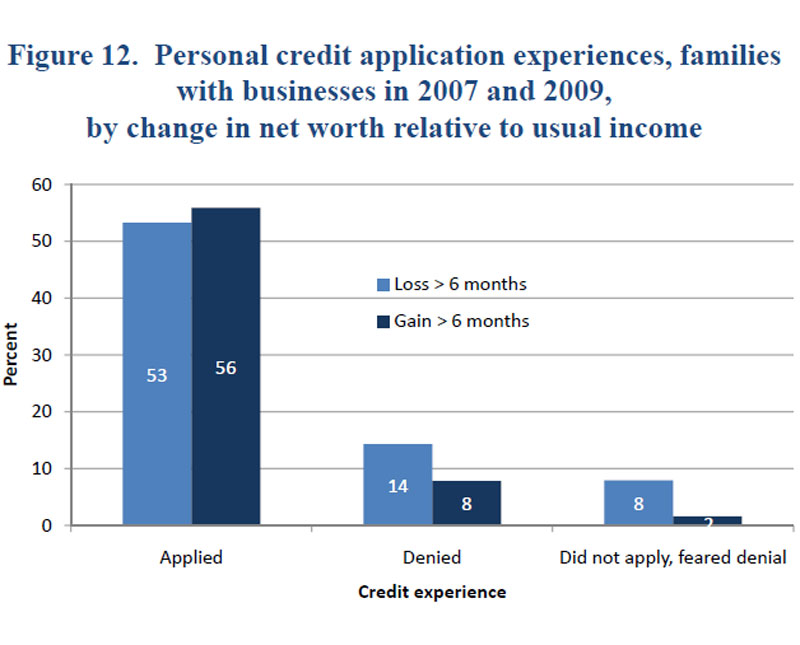
The data show a substantial level of personal and business applications both for owners whose wealth rose and for those whose wealth fell over the period of the SCF panel. The level of personal applications was slightly higher for those whose wealth increased over the period, and their applications were more likely to have been approved (or they were less likely to have believed they would have been denied) (figure 12).
The pattern of personal loan denial rates is consistent with changes in individual circumstances. The denials could also indicate that business difficulties have a significant influence on the ability of business owners to borrow for personal reasons. Indeed, business owners have much more difficulty documenting their income than do wage-earners. The combination of weaker earnings, lower net worth, and renewed focus on income verification could have made it particularly difficult for business owners who lost wealth to refinance mortgages or purchase homes.
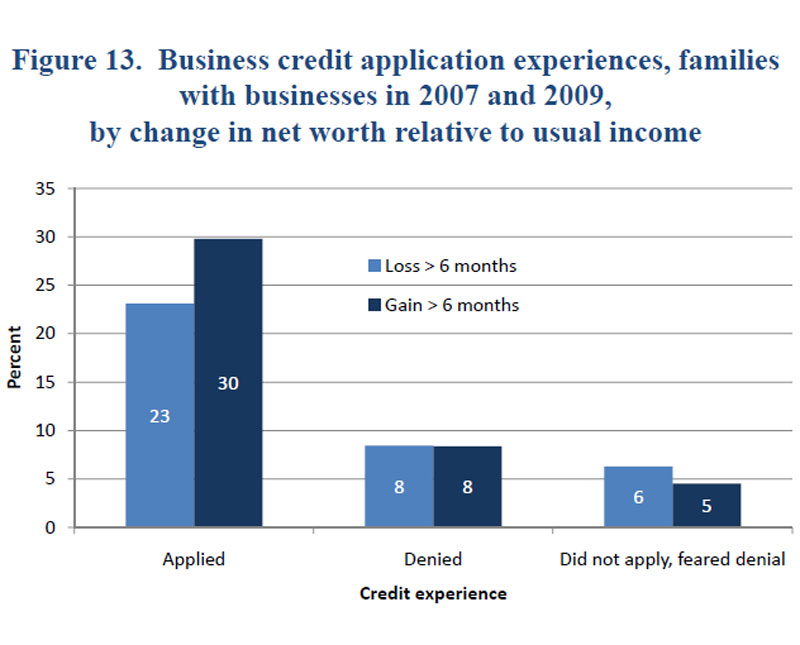
Business owners whose wealth rose were also more likely to have applied for business credit, but the rate of denial and for those who feared denial was nearly the same for business owners who gained wealth as for those who lost wealth (figure 13). In this case, the pattern of denial does not match the variations in individual circumstances. Unfortunately, we don't have any history for this series so it is impossible to tell how it has changed over time. But the striking similarity in credit approval rates for business loan requests by business owners who gained and those who lost wealth would seem to support anecdotal reports at the time--that business credit was hard to obtain even for good borrowers.
Conclusion
The results I have discussed today are among the first details to emerge from our panel study of changes in family finances over the financial crisis. The data show significant heterogeneity in the wealth changes that families experienced during the period of the financial crisis between 2007 and 2009. Any consequent macroeconomic wealth effect depends on the distribution of gains and losses and the propensities of the families that experienced those changes.
Research remains to be done on how all those factors come together, but the data offer at least a suggestion of what may emerge. Among the preretirement age group, those who gained and those who lost wealth during the financial crisis generally appear to act as if they had lost wealth--in that there are signs of delayed retirement and greater desire to save and to avoid risk. In addition, there appears to be an asymmetric reaction to wealth shocks that could be a factor in the slow recovery of spending.
Business owners had much wider changes in wealth than those reported for the general population and the changes were related to the conditions of the industries in which the businesses operated. Business owners who had increases in wealth were more likely to apply for personal and business credit. Although business owners who experienced decreases in wealth were more likely to have been denied or to fear denial of personal credit, actual denial rates for business credit were about the same regardless of wealth outcomes. Moreover, the difference in credit approval rates between personal and business applications suggests that differences other than the financial circumstances of the applicant were at work in business credit markets.
It is still too early to determine how consumer spending patterns will ultimately be altered as a result of changes in circumstances wrought by the financial crisis. But as events unfold, the SCF data will be an invaluable resource as we try to understand these new patterns.
1. Jesse Bricker, Brian Bucks, Arthur Kennickell, Traci Mach, and Kevin Moore (2011), "Surveying the Aftermath of the Storm: Changes in Family Finances from 2007 to 2009," Finance and Economics Discussion Series 2011-17 (Washington: Board of Governors of the Federal Reserve System, March). Return to text
2. For all families, median 2007 normal income was $53,000 (mean of $84,000). Taken over all households, the differences in usual and current income average out to a small amount. Return to text
3. The SCF asks whether families agree or disagree (on a five-point scale) with the following statements: "When the things that I own increase (decrease) in value, I am more (less) likely to spend money." Note that the "spend less" version of the question was only asked in 2009. Return to text