February 24, 2023
Discussion of the Paper "Managing Disinflations" by Stephen G. Cecchetti, Michael E. Feroli, Peter Hooper, Frederic S. Mishkin, and Kermit L. Schoenholtz
At the U.S. Monetary Policy Forum, New York, New York
Thank you very much for inviting me to discuss this paper. It is a timely review for central bankers charged with lowering inflation to targets or, in the terminology of the authors, managing disinflation. I really enjoyed reading it. Before I begin, let me remind you that the views I will express today are my own and not necessarily those of the Federal Open Market Committee (FOMC) or the Federal Reserve System.
My discussion time is limited. Therefore, I'll be selective. I will begin by briefly describing what the paper is about. Then, I will summarize the authors' takeaways from their analysis. Next, I will share my takeaways. Finally, I will offer some concluding remarks.
So what is this paper about? Conceptually, the paper can be divided into three parts. In the first part, the authors review historical disinflationary episodes in the United States and other countries to see what lessons we might learn from past experience.
In the second part, the authors present a simple, tractable model that relates interest rates, inflation, inflation expectations, and slack in the labor market. They use the model to make predictions about future inflation.
In the third part, the authors provide advice to monetary policymakers on how to address the current situation; that is, how to manage disinflation.
With that, let me cut to consideration of the authors' takeaways.
The authors' first takeaway, based on past disinflation episodes in the United States and abroad, is that policymakers should expect that disinflation will be costly in terms of foregone output or employment. They find that all 16 of the large policy-induced disinflations in the four advanced economies they study were associated with a recession.1 As the paper makes clear, however, a good measure of judgment comes into the exercise of identifying and quantifying disinflationary episodes. History is replete with confounding factors that make parsing difficult. These factors include supply shocks, labor market structure, economic conditions at the start of the disinflationary episode, how "well anchored" are inflation expectations, and the speed at which a disinflation is carried out. Even so, the authors are thorough in what they do. And while one may quibble with bits and pieces, their argument that policymakers should accept that disinflation is likely to be costly is well reasoned.
The authors' second takeaway from history is that state dependencies or nonlinearities are also in play. The state dependency they note is that a higher initial inflation rate is associated with a lower sacrifice ratio. To explain this finding, they advance an argument based on policy credibility. Specifically, they argue that a high initial inflation rate enhances the plausibility of central banks' willingness to incur the cost of reducing inflation. That strikes me as plausible on its face, but there are other stories that may also apply. In the interest of brevity, let me point out just one. Central bankers are constantly warning of combatting inflationary shocks before those forces become embedded in inflation expectations.2 The Volcker disinflation of 1981–82 resulted in a painful recession. But the reduction in inflation was large. Thus, measured in terms of percentage points of inflation reduction, as is conventionally done, it was not particularly costly.3 A plausible, if partial, explanation for this finding is that the Volcker disinflation was carried out before the inflation associated with the second OPEC oil price shock had become entrenched in inflation expectations and more generally at a time when inflation expectations were fluid.4 This is relevant as my colleagues on the FOMC and I strive to bring down actual inflation promptly in order to preserve the "well anchored" longer-term inflation expectations we see in the data. It is also consistent with the authors' argument that swift and relatively painless disinflations of the past were due to early and sharp policy interest rate increases.
The authors' third takeaway from history is that easing monetary policy before the disinflation is complete, or easing by too much, is costly.5 My reading of this claim is that while central bankers might entertain hopes that they will directly see a dividend from early, forceful policy actions, historical experience suggests that they should not count on such a favorable outcome.
And, finally, they argue that policy needs to look ahead and act preemptively. While the authors do not present evidence to support this claim, it is an argument with which policymakers nearly always agree, in principle, but find difficult to execute, in practice. As I'll discuss in a minute, choosing the appropriate stance of monetary policy, in real time, to influence expected future economic conditions is a difficult task in the best of circumstances. It is all that much more difficult when the economy is experiencing a once-in-a-century disturbance of worldwide significance.
As you have already heard, the authors outline a very simple model that relates interest rates, slack in the economy, inflation, and inflation expectations. They use this model to forecast inflation in the year 2021 and evaluate the model's predictive performance, employing alternative measures of slack, linear and nonlinear relationships, and different sample periods. Interestingly, the various measures of slack, and specifications for slack, make little difference. The models do a little better when you allow them to see data from the era of high and volatile inflation in the 1960s and '70s instead of restricting consideration to the Great Moderation period, as empirical tests for structural breaks would surely have suggested.6 Two key and related reasons for this improvement are that inflation expectations in the 1960s and 1970s were more persistent and that the slope of the empirical Phillips curve was steeper than during recent history.
The authors' policy takeaways fall into two classes. First, there are the conclusions that pertain to the current situation. They suggest that the unusually large and rapid tightening in policy in 2022 was good policy. In particular, the authors contend, on page 19, that "the apparent anchoring of long-term [inflation] expectations may reflect in part the FOMC's unanticipated shift toward aggressive rate hikes." In addition, despite the rapid tightening to date, the authors contend that additional monetary policy tightening is likely to prove necessary to achieve 2 percent inflation by 2025 and is likely to lead to a mild recession.
Second, there are the more general takeaways. The authors favor aggressive monetary policy tightening—or preemption—over gradualism. And they argue that the costs of increasing the target rate of inflation outweigh the benefits because the loss of credibility from showing a lack of resolve to achieve 2 percent inflation will persist.
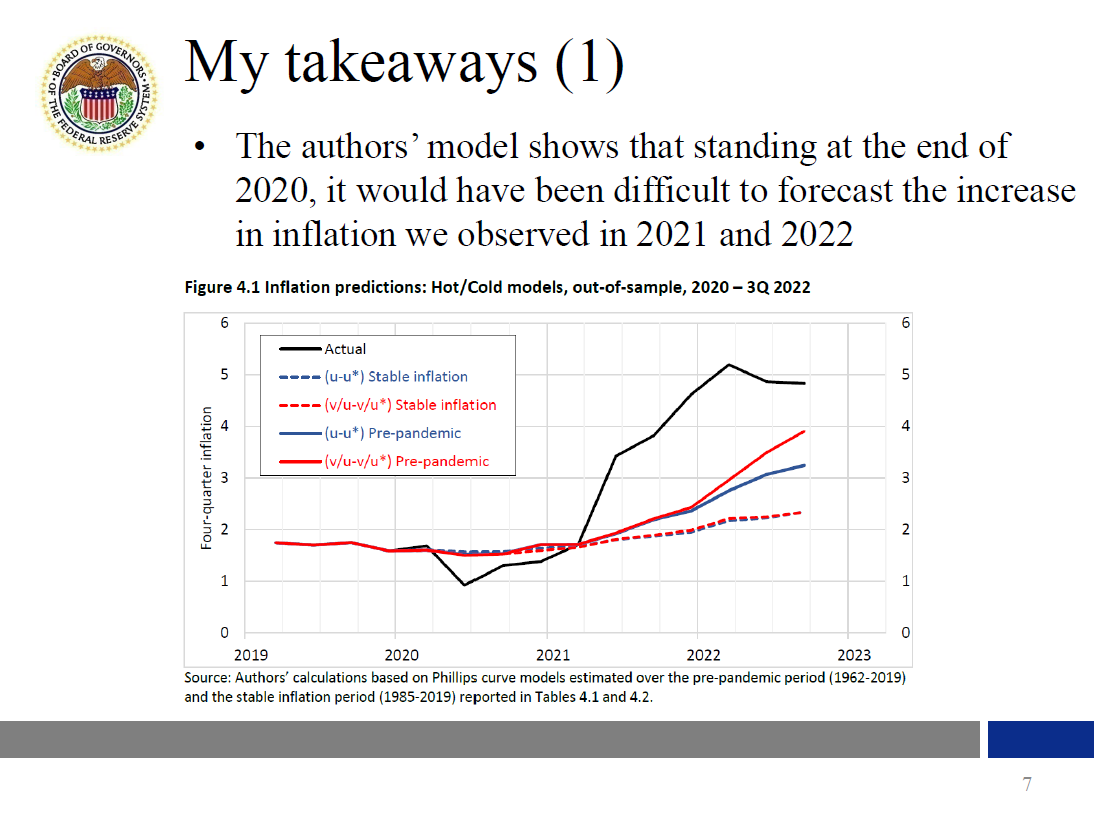
Now, let me share my takeaways. First, figure 4.1 in the paper demonstrates that, standing at the end of 2020, it would have been difficult to forecast the increase in inflation we observed in 2021 and 2022: The out-of-sample forecasts are far below the actual. This result stands despite the authors having benefited from knowledge of how economic forces played out that would not have been available in real time. Here, I emphasize the unprecedented nature of the pandemic, with its wide-reaching economic effects and comingling of economic and public health policies. It's just very difficult to formulate forecasts and implement preemptive monetary policy in real time, especially under such extraordinary circumstances.
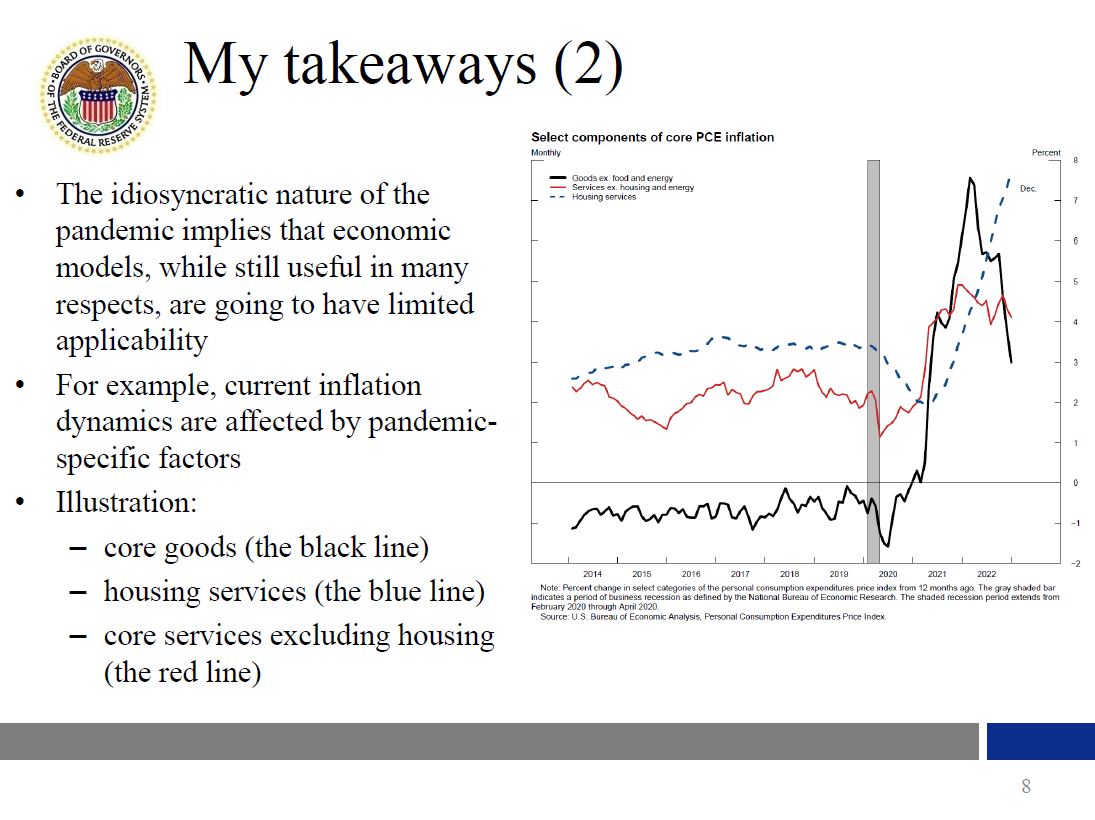
A corollary, of sorts, of this observation is that the idiosyncratic nature of the pandemic implies that economic models, while still useful in many respects, are going to have limited applicability. Taken at face value, the model assumes, as all models do, that the past tells policymakers what they need to know. But current inflation dynamics are being driven by some pandemic-specific factors not seen in the historical data. It follows that policymakers need to look at a broader range of factors to understand recent inflation dynamics.
Let me illustrate this point by considering three large categories that make up core personal consumption expenditures inflation. These are core goods inflation, housing services inflation, and inflation in core services excluding housing. It's useful to look at these three categories separately because the driving forces behind each differ. Some of these forces are pandemic specific, and understanding the different causes should help us predict what will happen to inflation going forward.
Focusing on the price of core goods, the black line in the chart, you can see how goods prices started climbing in the second half of 2020 and rose sharply in 2021 as the pandemic-driven disruptions to social interactions induced a rapid shift in demand from services to goods, exacerbating snags in global supply chains. By the end of 2021, once vaccines were developed and deployed and people slowly emerged from isolation, the shift in demand back to services began, and supply chain bottlenecks started to ease. Thus, inflation in this category came down substantially over the course of 2022. The strengthening of the overall economy may have played a role in core goods price inflation, but it was likely secondary to the roles played by goods-specific demand and by the production and distribution network for goods over this period. In contrast, housing services inflation, the blue line in the chart, picked up appreciably in 2022 after having softened early in the pandemic. Inflation in this sector is also driven by certain pandemic-specific factors. In particular, the surge in work from home led to an abrupt increase in the demand for bigger homes located in smaller metro areas or further from city centers. House prices and rents increased significantly. We have not seen a decline in housing services inflation yet, but recent data on new leases and lease renewals indicate that we soon will. Lastly, we have inflation in other core services, the red line in the graph, a large category that covers activities as varied as travel and recreation, and medical and legal services. Inflation for these services, most of which are labor intensive, has remained stubbornly high. An important source of inflation pressures in this category has likely been the shortage of workers, which has pushed up labor costs at rates above those consistent with 2 percent inflation. The inflation outlook for this nonhousing category of core services will likely depend in large part on whether labor demand moves into better balance with labor supply and growth in nominal labor costs. Recent data suggest that labor compensation has indeed started to decelerate somewhat over the past year but is still running too high to be consistent with returning inflation to 2 percent in a timely and sustainable fashion. The point is that the inflationary forces impinging on the U.S. economy at present represent a complex mixture of temporary and more long-lasting elements that defy simple, parsimonious explanation.
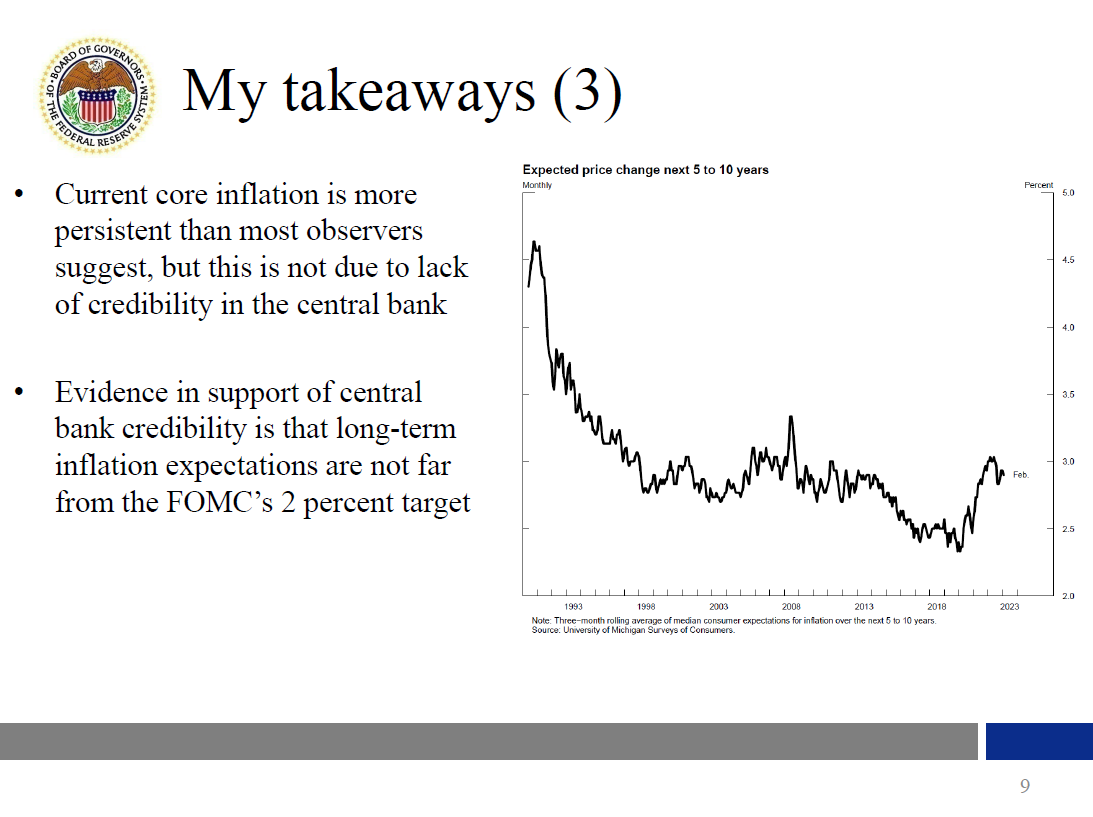
The ongoing imbalance between the supply and demand for labor, combined with the large share of labor costs in the services sector, suggests that high inflation may come down only slowly. The paper notes the role of central bank credibility in managing disinflations, but I do not attribute the persistence in inflation to a lack of Fed credibility. Indeed, there is evidence in support of central bank credibility, including that long-term inflation expectations are not far from the FOMC's 2 percent target.
Let me conclude with a summary of my takeaways.
History is useful, but it can only tell us so much, particularly in situations without historical precedent.
The current situation is different from past episodes in at least four ways. First, the pandemic created unprecedented disruptions to global supply chains. Second, the pandemic is having a long-lasting effect on labor force participation rates. Third, the credibility of the central bank is higher now than it was in the 1960s and 1970s. Fourth and most importantly, unlike in the late 1960s and 1970s, the Federal Reserve is addressing the outbreak in inflation promptly and forcefully to maintain that credibility and to preserve the "well anchored" property of long-term inflation expectations.
Finally, economic models are important tools but need to be used with careful interpretation and judgment when history does not speak to the current situation. Sound decisionmaking requires that their findings be complemented with additional analytical tools, including careful scrutiny of real-time data.
Thank you!
References
Ball, Laurence (1994). "What Determines the Sacrifice Ratio?" in N. Gregory Mankiw, ed., Monetary Policy. Chicago: University of Chicago Press, pp. 155–93.
Cecchetti, Stephen G., Michael E. Feroli, Peter Hooper, Frederic S. Mishkin, and Kermit L. Schoenholtz (2023). "Managing Disinflations," paper presented at the U.S. Monetary Policy Forum, New York, February 24.
Kohn, Donald (2008). "Lessons for Central Bankers from a Phillips Curve Framework," remarks given at the Federal Reserve Bank of Boston's 53rd Annual Economic Conference, Chatham, Mass., June 11.
Macklem, Tiff (2022). "Opening Statement before the Standing Senate Committee on Banking, Trade and the Economy," Ottawa, Ontario, November 1.
Powell, Jerome H. (2022a). "Nomination Hearing," testimony before the Committee on Banking, Housing, and Urban Affairs, U.S Senate, Washington, January 11.
——— (2022b). "Monetary Policy and Price Stability," speech delivered at "Reassessing Constraints on the Economy and Policy," an economic policy symposium sponsored by the Federal Reserve Bank of Kansas City, Jackson Hole, Wyo., August 26.
Sims, Christopher, and Tao Zha (2006). "Were There Regime Switches in U.S. Monetary Policy?" American Economic Review, vol. 96 (March), pp. 54–81.
Tetlow, Robert J. (2022). "How Large Is the Output Cost of Disinflation?" Finance and Economics Discussion Series 2022-078. Washington: Board of Governors of the Federal Reserve System, November.
1. They draw this conclusion by replicating some of the methodology from the literature on sacrifice ratios. See, for example, Ball (1994) and Tetlow (2022) and references therein. Return to text
2. For example, Chair Powell, in testimony before the U.S. Senate, said, "We will use our tools to support the economy and a strong labor market and to prevent higher inflation from becoming entrenched" (Powell, 2022a). This reasoning has a lengthy history, as evidenced by remarks in 2008 by then Vice Chair of the Board of Governors of the Federal Reserve System Donald Kohn: "As demonstrated by historical experiences around the world and in the United States during the 1970s and 1980s, efforts to bring inflation and inflation expectations back to desirable levels after they have risen appreciably involve costly and undesirable changes in resource utilization" (Kohn, 2008). And the sentiment is shared internationally, as remarks by Bank of Canada Governor Tiff Macklem attest: "If we don't do enough [policy tightening], Canadians will continue to endure the hardship of high inflation. And they will come to expect persistently high inflation, which will require much higher interest rates and, potentially, a severe recession to control inflation. Nobody wants that" (Macklem, 2022). Return to text
3. Converting the unemployment sacrifice ratio in Ball (1994) into output space using an Okun coefficient of two renders an output sacrifice ratio of just 1.8, a small number by historical standards. For a summary of sacrifice ratios in history, see Tetlow (2022) and Cecchetti and others (2023). Return to text
4. This may be related to the authors' second conjecture on why initially high levels of inflation are associated with lower sacrifice ratios—namely, that high inflation is associated with large global supply shocks (Cecchetti and others, 2023, p. 18). It is analytically distinct, however, in that they do not emphasize the timely monetary policy response to those shocks. Return to text
5. This point is elaborated upon in Chair Powell's 2022 Jackson Hole speech; see Powell (2022b). Return to text
6. The borderline, as it were, between the inflationary era that the authors argue is critical for obtaining plausible results in their conditional forecasting exercise and the Great Moderation period is the Volcker disinflation of 1981–82. Sims and Zha (2006) argue that the Volcker disinflation is the only regime shift that can be unequivocally shown to be present in the data over the postwar period in their sample. Return to text