February 27, 2023
Recent Inflation and the Dual Mandate
At the Ec10, Principles of Economics, Lecture, Faculty of Arts and Sciences, Harvard University, Cambridge, Massachusetts
Thank you, Jason, for inviting me to join your economics class and for your kind introduction. It is a pleasure to be here. I miss teaching economics classes.
Before I continue, I would like to note, as I always do, that the views I will express today are my own and are not necessarily those of my colleagues at the Board of Governors of the Federal Reserve System or the Federal Open Market Committee (the FOMC).
What I like about economics is that it deals with real-world issues, and many times we experience firsthand a topic discussed in textbooks. Take the recent inflation, for example. This may be your first experience with high inflation. I am sure you noticed prices going up at restaurants, supermarkets, and the gas pump without having to read about it in the newspaper. I, for one, can confirm that the inflationary pressure in the rental housing market in the Washington, D.C., area is real. While we have all experienced prices going up, it's challenging to measure inflation itself and its consequences.
Today, I want to do the following: discuss with you different ways to measure inflation, characterize our recent inflation, and contextualize the battle against inflation in terms of the Fed's dual-mandate goals of price stability and maximum employment. Then, I will offer some concluding remarks.
Different Ways to Measure Inflation
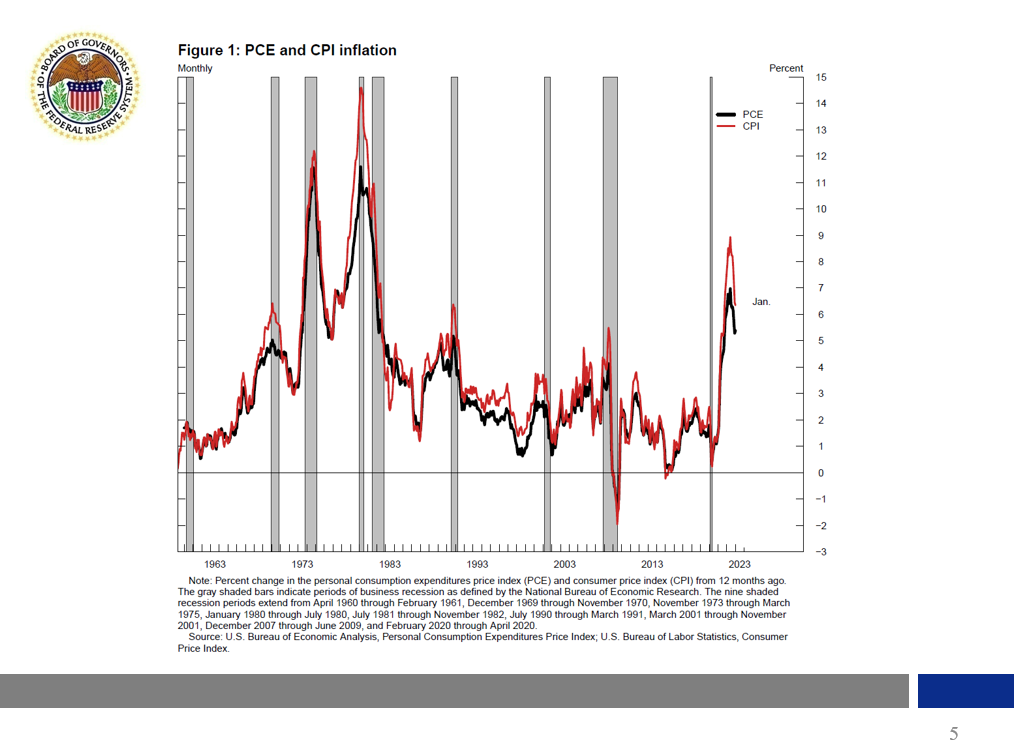
The two primary measures of the price level in the United States are the consumer price index, commonly referred to as the CPI, and the personal consumption expenditures price index, commonly referred to as the PCE price index. Positive changes in these indexes are recorded as inflation. Each inflation measure has both total (or headline) and core subindexes, which I will talk about later. The CPI and PCE price indexes are constructed in broadly similar ways, but there are important differences between them.1 Both indexes measure inflation using a specific basket of goods and services consumed by households. These baskets are similar but not identical across the two measures. Both measures also weight each item in their basket roughly in accordance with its expenditure share. That is, the more households spend on an item, like rent, the higher the weight it receives in the overall index. The weights are broadly similar across the two indexes, but, again, there are some important differences.
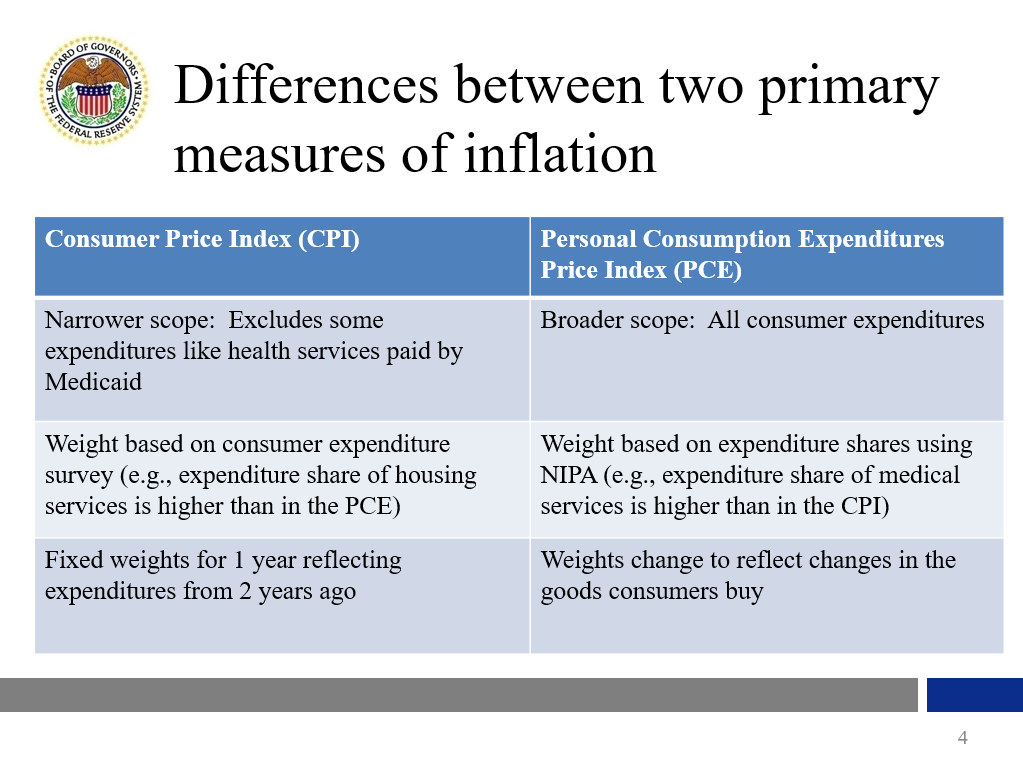
Now, let's talk in more detail about the differences between the CPI and the PCE price indexes. First, the PCE price index has a broader scope than the CPI. The CPI is limited to expenditures that households pay out of pocket, while the PCE price index covers a broader set of goods and services as it seeks to cover prices for all consumer expenditures in the national income and product accounts (NIPA). For example, the PCE price index includes prices of the health services provided to households through Medicaid, while the CPI excludes these items.
Second, the PCE price index and the CPI use different weighting systems. The PCE price index, which is more comprehensive than the CPI, estimates expenditure shares using the national income and product accounts, while the CPI measures expenditure shares using a separate survey of households, the Consumer Expenditure Survey. This leads to some differences in expenditure weights that can at times be important. For example, the share of medical services is notably higher in the PCE price index (partly because the PCE price index includes more kinds of medical expenditures), and the share of housing services is noticeably smaller (because overall expenditures are larger in the PCE price index). As a result, when health-care services or housing services inflation behave differently than other prices, this can lead to differences in PCE versus CPI inflation.
Another difference in the weights is that the PCE price index uses time-varying weights, while the official CPI keeps weights fixed for a year. The PCE price index weights change to reflect changes in the goods consumers buy. For instance, at the start of the pandemic, the CPI was still giving the same weights to cruise ship and airline fares, even though no one was traveling. The time-varying weights in PCE also account for substitution behavior. Suppose the price of apples goes up and the price of oranges stays the same. Consumers are then likely to substitute apples with oranges. In contrast, the CPI does not capture substitution behavior because the basket of goods consumers purchase is updated only once a year (instead of every month) and reflects expenditure patterns prevailing two years ago. The substitution effects captured by the PCE price index is one reason why PCE inflation (black line) is, almost always, lower than CPI inflation (red line), as you can see in figure 1.
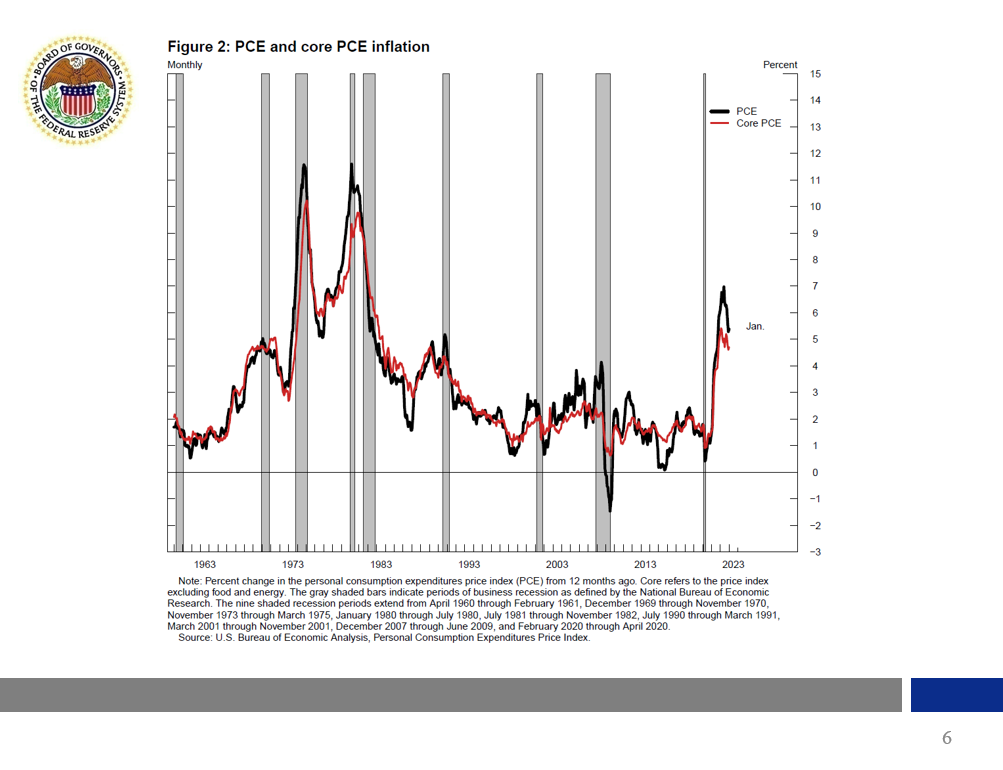
As I mentioned earlier, there are both total and core PCE price and CPI indexes. The core subindex is the total index excluding food and energy prices.2 Food and energy prices are more volatile than other prices, which makes total inflation more volatile.
This volatility is evident in figure 2. You can see the black line (total PCE price index) exhibiting more drastic ups and downs than core PCE price index, the red line in the graph, and many of the sharp movements are short lived. In other words, the volatility in the total PCE price index makes it harder to discern trends (longer-lasting movements) from transitory movements. In addition, food and energy prices often depend on factors that are beyond the influence of monetary policy, such as geopolitical developments (for example, those associated with fluctuations in energy prices) or weather or disease or war (for example, in the case of food prices).
In summary, the differences between CPI and PCE price indexes are important. The FOMC has chosen to target the PCE price index because it is broader and it captures more accurately what households are actually consuming.3 In addition, food and energy account for a significant portion of household budgets, so the Federal Reserve's inflation objective is defined in terms of the total PCE price index, but the Fed monitors the core PCE price index, as well as other inflation indicators, in order to identify evolving inflation trends.4
Select Components of Core PCE Inflation
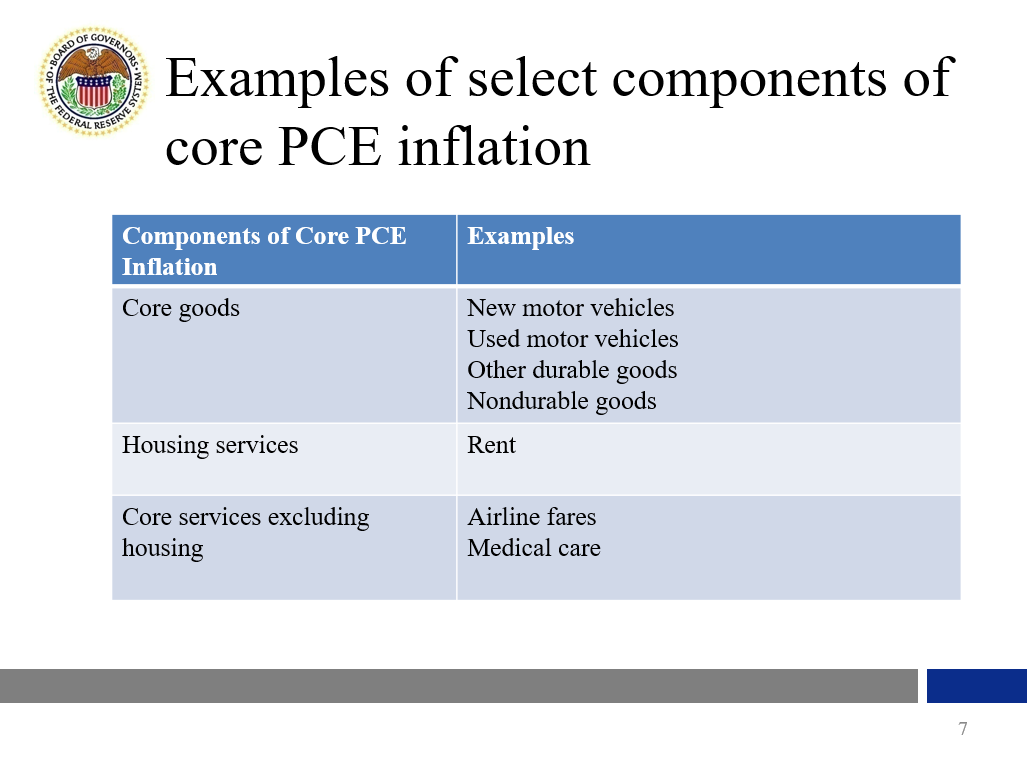
Now, I would like to dig a bit deeper into recent inflation trends. To do so, I find it useful to look at three large categories that together make up the core PCE price index: goods excluding food and energy, housing services, and services excluding housing and energy. Slide 7 provides some examples of what is in each subcomponent.
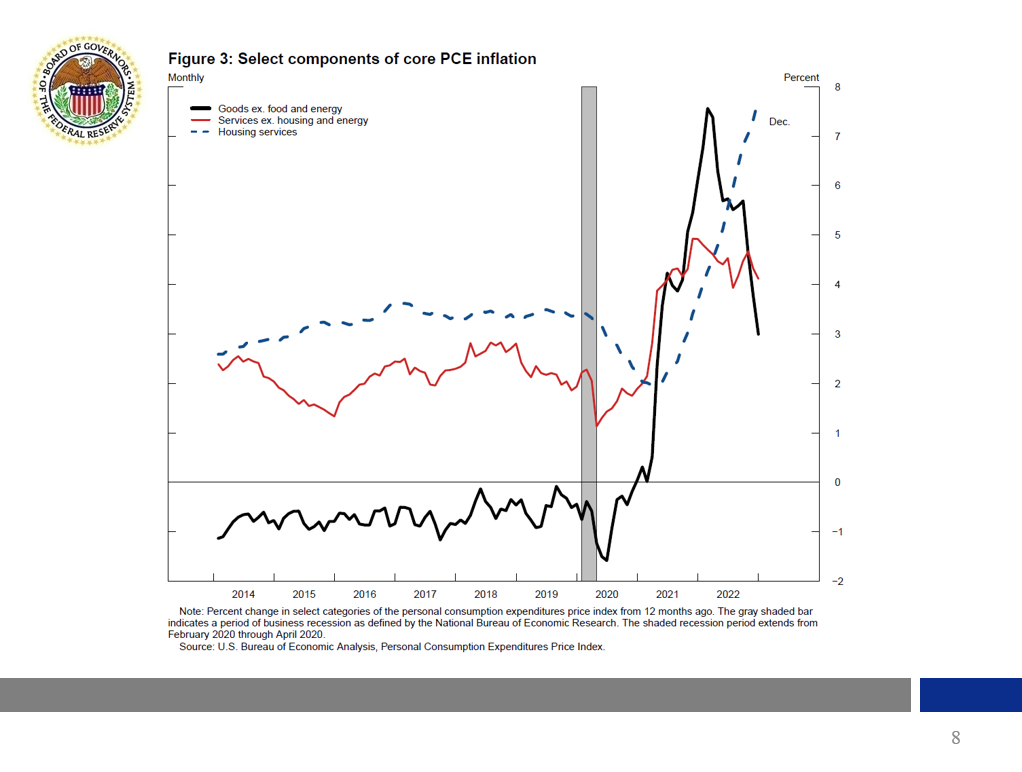
Figure 3 shows recent inflation rates for each component: goods excluding food and energy (black line), housing services (blue line), and services excluding housing and energy (red line). I look at these three categories separately because what has been causing inflation in each of these sectors is somewhat different. Understanding the different causes and how they affect the different components could help the FOMC predict the future course of inflation. Since monetary policy affects the economy (and inflation) with a lag, the Committee is always forward looking.
Focusing on the price of core goods, the black line in figure 3, you can see how goods prices rose sharply in the second half of 2020 due to both a rapid shift in demand toward goods and unprecedented disruptions to global supply chains. As so many were isolating themselves—especially those of us lucky enough to have jobs that let us work remotely—there was a sharp shift in demand from services (eating out and traveling) to durable goods (like stationary bicycles) to make our stay-at-home experience more pleasant. The pandemic also severely disrupted the global production and distribution of goods, leading to large backlogs at ports and widespread shortages of materials, most notably semiconductors. The imbalance between supply and demand for goods resulted in a sharp increase of prices. At the end of 2021, once vaccines were developed and deployed and people slowly emerged from isolation, there was a partial shift in demand back to services, and supply chain bottlenecks started to ease. Thus, inflation in this category started to come down and has come down substantially.
In contrast to core goods, housing services inflation, the blue dashed line in figure 3, has not started to come down yet. Housing services prices are estimated using information on rents and measure the price that renters pay, and homeowners would pay, to live in their homes. Like core goods, demand in the housing sector underwent a major shift during the pandemic.
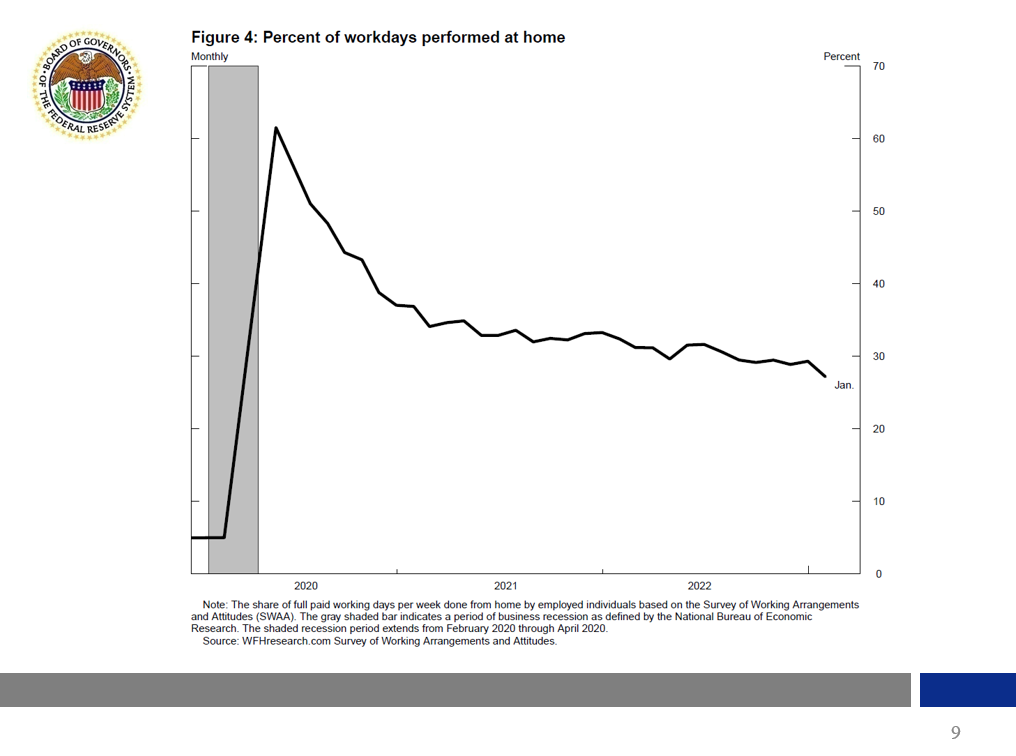
The surge in work from home shown in figure 4 led to an increase in the demand for bigger homes located in smaller metro areas or further from city centers. These shifts in demand happened much more rapidly than the response in housing supply. As a result, rents increased quite significantly.
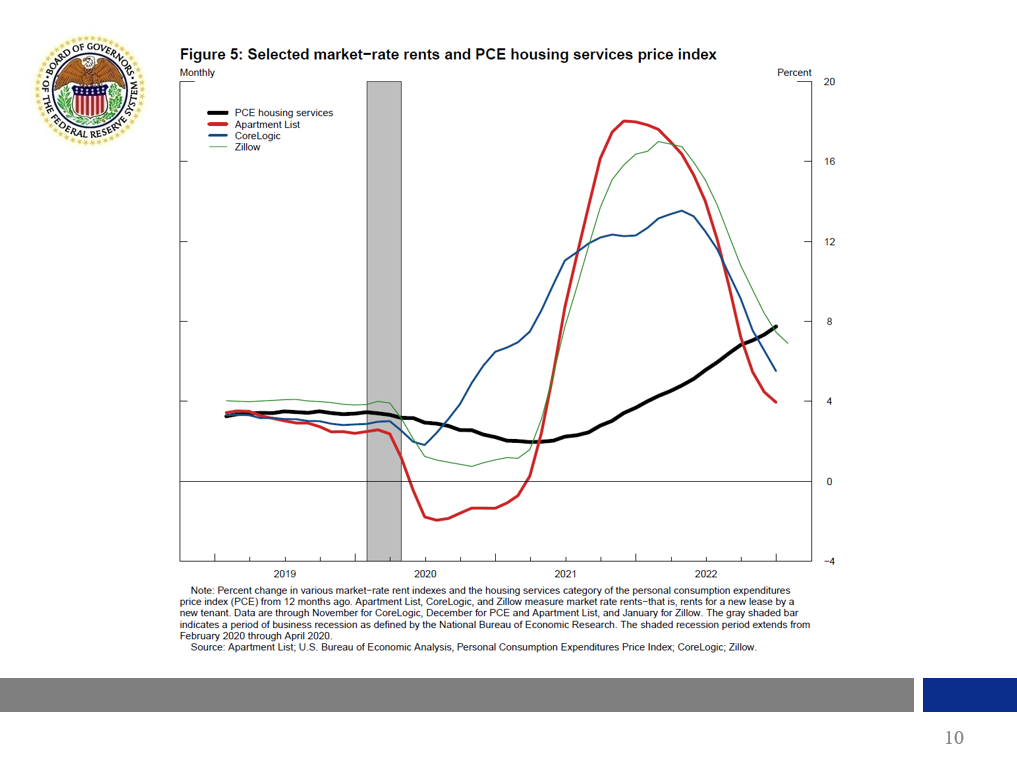
We have not seen a decline in housing services inflation, but there are indications that we soon will. To see this, consider figure 5. Because rental agreements tend to be renewed infrequently (often only once a year), average rents (the black line), which is what the PCE price index measures, tend to lag market rents (the green, blue, and red lines), the rent I would pay if I were to sign a new lease as a new tenant. For this reason, market rents are a leading indicator of how overall rents and housing services prices are likely to change over the next 6 to 12 months. Market rents are now increasing much more slowly than over 2021 and much of 2022, suggesting that housing services inflation will eventually slow.
Lastly, inflation in other core services, the red line back in figure 3, is a large category that covers activities as varied as travel and recreation, and medical and legal services. Inflation for these services has remained stubbornly high. As other Governors and I have noted in the past, an important source of inflation pressures in this category has likely been the shortage of workers, which has pushed up labor costs at rates above those consistent with 2 percent inflation. The inflation outlook for this nonhousing category of core services partly depends on whether growth in nominal labor costs comes back down, and recent data suggest that labor compensation has indeed started to decelerate somewhat over the past year.
Although I have focused on core inflation because it is more useful for assessing trends in inflation, we also closely follow food and energy prices given that our target is for total inflation and that food and energy prices are very important for many households. Both food and energy inflation rose sharply following the Russian invasion of Ukraine. But more recently, food inflation has slowed somewhat, as global food prices have retraced some of their earlier increases, while energy prices have fallen noticeably. Because energy prices are shaped primarily by global developments and not by U.S. monetary policy, there is a lot of uncertainty about the future course of energy inflation.
In summary, core goods inflation has started to come down. Several indicators suggest that housing services inflation is likely to come down in the coming months. There is more uncertainty surrounding inflation in core services excluding housing. Over time, we'll learn more about inflation dynamics in this sector.
Benefits of Price Stability and a Target of 2 Percent
So far, I've talked about how to measure inflation, about different subcomponents, and about drivers of inflation. I will now discuss the benefits of price stability and a longer-run 2 percent inflation rate target.
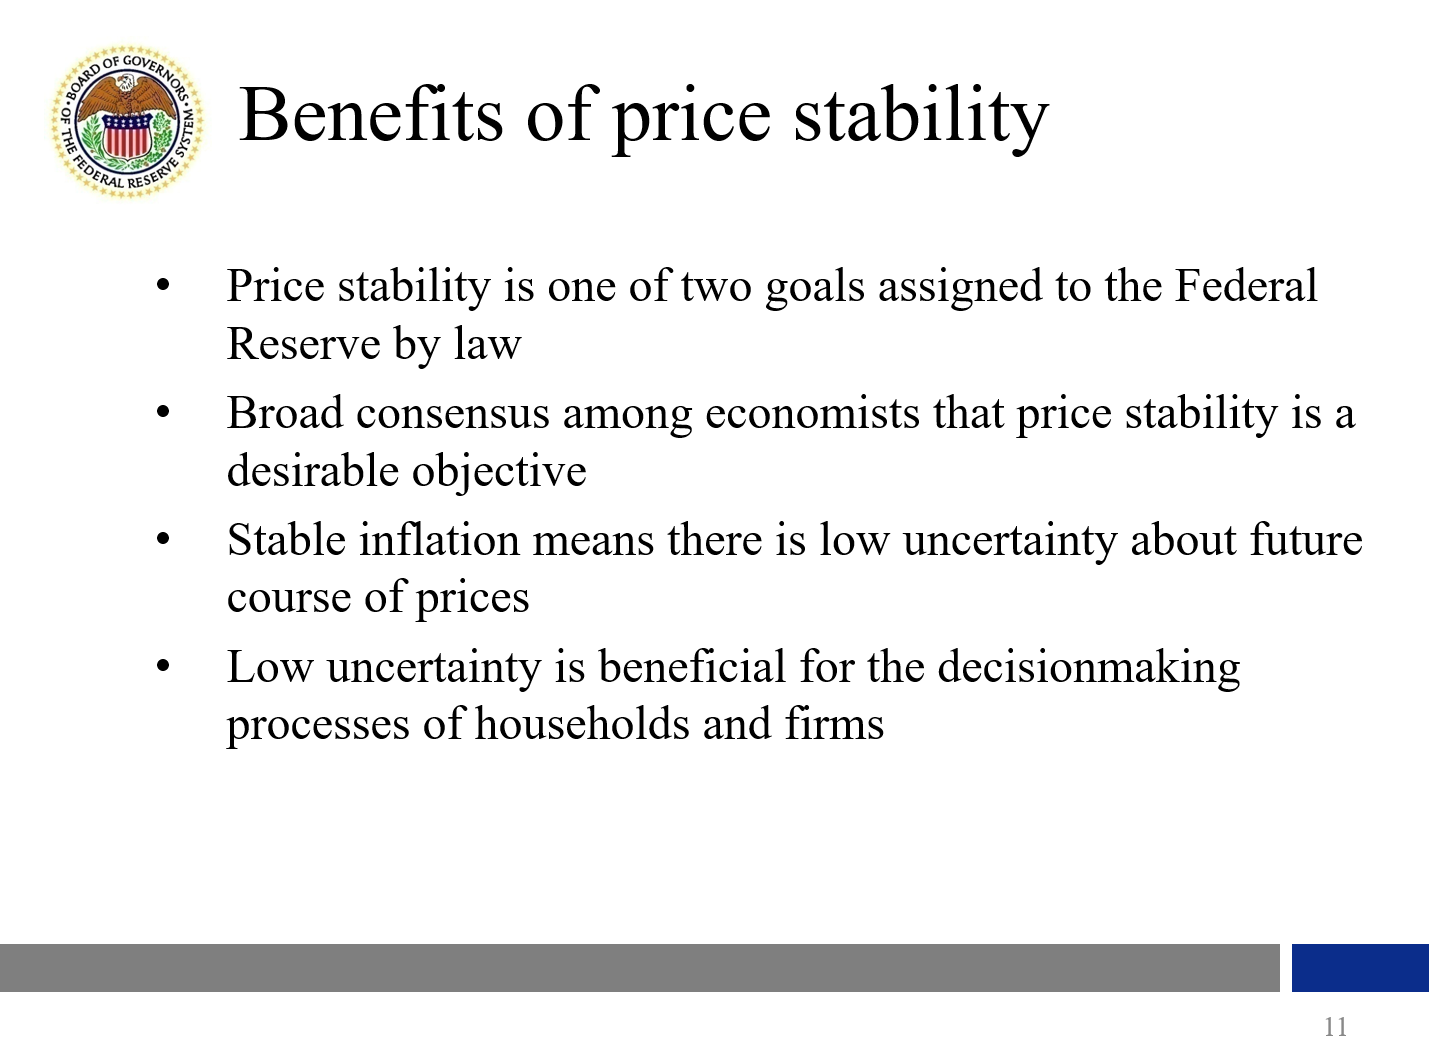
Price stability is one of two goals assigned to the Federal Reserve by law, but there is also a broad consensus among economic researchers and policymakers that price stability is a desirable objective. Deviations from price stability in the form of persistently elevated inflation rates are costly for the economy for several reasons, some of which I'll review now.5
Fundamentally, a low and stable inflation rate is beneficial for the decisionmaking processes of households and firms. Choices regarding work, savings, and the expansion of business enterprises are likely to be harder when there is uncertainty about the likely future course of prices. Retirement planning by households and investment decisions by firms are, consequently, put on a sounder footing if there is confidence about the future value of the currency. The avoidance of this uncertainty is also likely to be beneficial for national economic performance. If the prospect of high inflation or uncertainty about future inflation factors heavily into firms' and households' calculations, it is less likely that resources will be allocated to activities that raise the productive potential of the economy, rather than into areas that are only made attractive by the presence of high and variable inflation.6
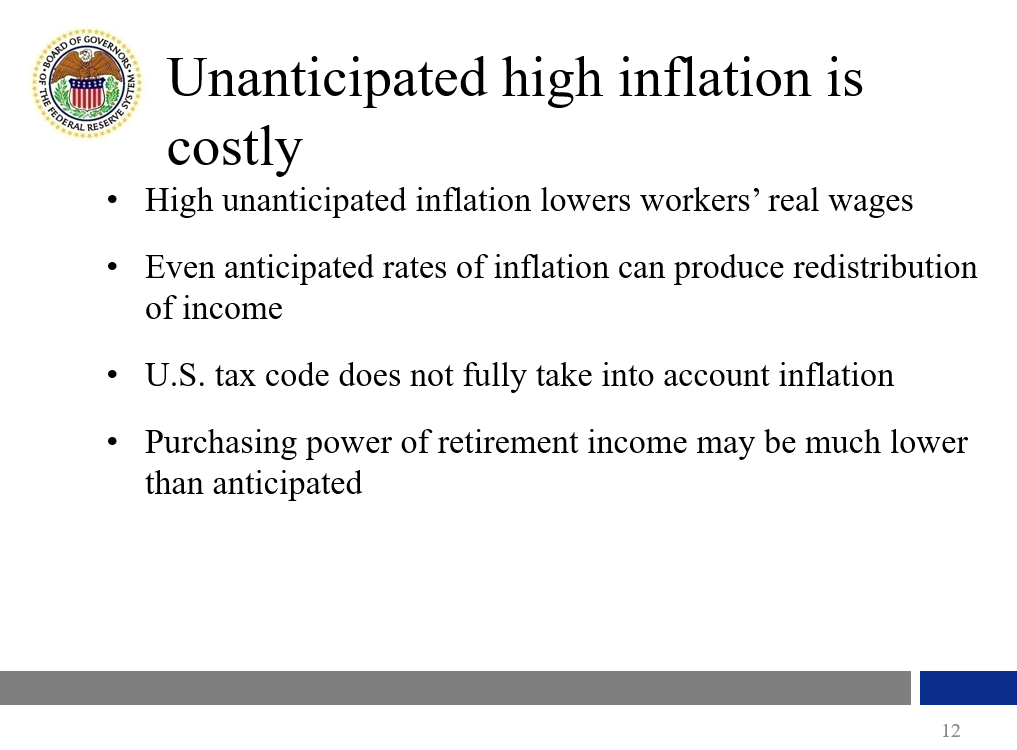
There are other economic costs of high inflation. In the labor market, as nominal wages are often set in advance, bouts of unanticipated inflation typically lead to a drop in workers' real wages in the short run, and this is a burden on households in meeting their expenses.7
More generally, even anticipated rates of inflation can produce redistributions of income. Such redistributions are also likely to be adverse for members of society who do not have ready access to the kinds of financial instruments that would best protect them against high inflation.
The likelihood of wide-ranging distortions due to inflation is enhanced by the fact that the U.S. tax code does not fully take inflation into account. Consequently, as stressed in fundamental work by the late Martin Feldstein of Harvard University, high inflation can distort saving and investment decisions, including through the treatment of after-tax capital gains.8
Another reason why deviations from price stability distort decisions and redistribute income lies in the fact that much of our financial system, including many arrangements pertaining to retirement plans, is structured in terms of streams of nominal payments.9 Absent a background of a steady and predictable inflation rate, the purchasing power of retirement income streams and other payments may turn out to be very different from what was envisioned when they were originally arranged.
The fact that much of the financial system is based on nominal payments also makes it clear that unexpectedly or unduly low inflation rates have important economic costs, too, including by saddling borrowers (debtors) with very high repayment burdens in real terms. Consider homeowners who take out a conventional fixed-rate mortgage, with the expectation their nominal incomes will rise about 2 percent per year. If the economy were instead to experience deflation accompanied by flat or declining wages, then after a few years the homeowners might find it considerably more difficult to cover their monthly fixed mortgage payments than they had originally anticipated. This increase in the real value of debts due to very low inflation or, worse, outright deflation would also be a burden on all households that have outstanding fixed nominal student loans, auto loans, or credit card debt, as well as businesses that had taken out bank loans or issued bonds.
In 2012, the FOMC set a formal inflation target to help households and businesses understand our goal and help keep inflation expectations anchored over time. The FOMC's choice of a 2 percent inflation rate, instead of zero, reflected the judgment that reasonable price stability was desirable while also recognizing the reality that very low inflation can also be economically costly.10 In addition, a zero percent goal would make the longer-run nominal interest rate 2 percentage points lower than would be the case under a 2 percent inflation goal. A zero-inflation environment would consequently restrict the FOMC's scope to lower nominal interest rates when this was necessary for stabilization purposes. In contrast, a 2 percent inflation rate is still low enough to be consistent with price stability but gives the FOMC greater scope to stimulate the economy in times when it judges that achievement of maximum employment requires that the Committee provide policy accommodation.
From these considerations flows the conclusion that a 2 percent inflation rate is the price-stability objective most consistent with the FOMC's dual mandate. The 2 percent longer-run inflation goal has been maintained since 2012.
Policy Risks and the Benefits of Credibility
Often, the FOMC must balance competing risks given its dual mandate of promoting maximum employment and stable prices. In the current context, there is, on the one hand, the risk that monetary policy will not be sufficiently restrictive to bring inflation back to 2 percent over time, and on the other hand there is a risk of policy being too restrictive and unnecessarily increasing the likelihood of recession. In the face of this latter risk, some economists argue that a higher inflation target is better than the Fed's current 2 percent target rate.11 Changing the FOMC's longer-run inflation objective, however, would introduce an additional risk by calling into question the FOMC's commitment to stabilizing inflation at any level because it might lead people to suspect that the target could be changed opportunistically in the future. If so, then these reputational costs will undermine the key benefits of well-anchored longer-run inflation expectations discussed above: an increased ability of monetary policy to fight economic downturns without sacrificing price stability. Moreover, if the purpose of a higher inflation target is to increase the ability of the central bank to deal with the severe recessions that follow financial crises, then a better strategic approach might be to rely on more vigorous supervisory and macroprudential policies that could help reduce the likelihood of such events. Further, seeking an inflation rate in the vicinity of 4 percent or higher would certainly stretch the meaning of "stable prices" in the Federal Reserve Act.12
Conclusion
In conclusion, today, I have discussed with you how persistently high inflation hurts everyone and how the Fed must jointly achieve price stability and maximum employment to fulfill its dual mandate over time. I also discussed how persistently low inflation is costly, and how changing the 2 percent inflation target would damage the central bank's credibility. For these reasons, I am committed to lowering inflation to our 2 percent target.
This is a very exciting time to study economics. I hope that the ways of thinking you are developing in this class will help you better understand economic phenomena that you observe and the challenges that policymakers face.
Thank you.
References
Ball, Laurence (2013). "The Case for Four Percent Inflation," Central Bank of the Republic of Turkey, Central Bank Review, vol. 13 (May), pp. 17–31.
Barattieri, Alessandro, Susanto Basu, and Peter Gottschalk (2014). "Some Evidence on the Importance of Sticky Wages," American Economic Journal: Macroeconomics, vol. 6 (January), pp. 70–101.
Bernanke, Ben (2010a). "The Economic Outlook and Monetary Policy," speech delivered at the Federal Reserve Bank of Kansas City Economic Symposium, Jackson Hole, Wyoming, August 27.
——— (2010b). "Statement of the Honorable Ben Bernanke, Chairman, Board of Governors of the Federal Reserve System," in The Economic Outlook, hearing before the Joint Economic Committee, U.S. Congress, April 14, Senate Hearing 111-583, 111 Cong. Washington: Government Printing Office.
Bernanke, Ben S., Thomas Laubach, Frederic S. Mishkin, and Adam S. Posen (1999). Inflation Targeting: Lessons from the International Experience. Princeton, N.J.: Princeton University Press.
Blanchard, Olivier, Giovanni Dell'Ariccia, and Paolo Mauro (2010). "Rethinking Macroeconomic Policy (PDF)," IMF Staff Position Note SPN/10/03. Washington: International Monetary Fund, February 12.
Board of Governors of the Federal Reserve System (2000). Monetary Policy Report (PDF). Washington: Board of Governors, February.
——— (2016). "What Is Inflation and How Does the Federal Reserve Evaluate Changes in the Rate of Inflation?" webpage.
Chung, Hess, Jean-Philippe Laforte, David Reifschneider, and John Williams (2012). "Have We Underestimated the Likelihood and Severity of Zero Lower Bound Events?" Journal of Money, Credit, and Banking, vol. 44, Supplement 1 (February), pp. 47–82.
Diercks, Anthony M. (2019). "The Reader's Guide to Optimal Monetary Policy," paper, August 17.
Feldstein, Martin (1982). "Inflation, Capital Taxation, and Monetary Policy," in Robert E. Hall, ed., Inflation: Causes and Effects. Chicago: University of Chicago Press, pp. 153-67.
———, ed. (1999). The Costs and Benefits of Price Stability. Chicago: University of Chicago Press.
Fischer, Stanley (1981). "Towards an Understanding of the Costs of Inflation: II," Carnegie- Rochester Conference Series on Public Policy, vol. 15 (1), pp. 5-41.
Fischer, Stanley, and Franco Modigliani (1978). "Towards an Understanding of the Real Effects and Costs of Inflation," Weltwirtschaftliches Archiv, vol. 114 (4), pp. 810-33.
Johnson, Noah (2017). "A Comparison of PCE and CPI: Methodological Differences in U.S. Inflation Calculation and Their Implications (PDF)," BLS Statistical Survey Paper. Washington: Bureau of Labor Statistics, November.
McCallum, Bennett T. (1990). "Inflation: Theory and Evidence," in Benjamin M. Friedman and Frank H. Hahn, eds., Handbook of Monetary Economics, Volume 2. Amsterdam: North-Holland, pp. 963–1012.
Mitchell, Wesley C. (1913). Business Cycles. University of California Berkeley Press Part III.
Nelson, Edward (2021). "The Emergence of Forward Guidance as a Monetary Policy Tool," Finance and Economics Discussion Series 2021-033. Washington: Board of Governors of the Federal Reserve System, May.
Orphanides, Athanasios (2006). "The Road to Price Stability," American Economic Review, vol. 96 (May), pp. 178-81.
Reifschneider, David, and John C. Williams (2000). "Three Lessons for Monetary Policy in a Low-Inflation Era," Journal of Money, Credit and Banking, vol. 32 (November), pp. 936–66.
Shiller, Robert J. (1997). "Why Do People Dislike Inflation?" in Christina D. Romer and David H. Romer, eds., Reducing Inflation: Motivation and Strategy. Chicago: University of Chicago Press, pp. 13-65.
Summers, Lawrence (1991). "Panel Discussion: Price Stability. How Should Long-Term Monetary Policy Be Determined?" Journal of Money, Credit and Banking, vol. 23 (August), pp. 625–31.
1. See, for example, Johnson (2017), who explains methodological similarities and differences between PCE price index and CPI. Return to text
2. Note that the core indexes are defined somewhat differently. Both core indexes exclude all energy prices. But while the CPI excludes all food prices, the core PCE price index excludes food bought for consumption at home (that is, food purchased at grocery stores) but includes food purchased at restaurants. Return to text
3. The Fed's Monetary Policy Report explains why the Fed chooses the PCE price index to the CPI (see Board of Governors, 2000, footnote 1). Notwithstanding this preference, the FOMC relies on a variety of aggregate price measures, as well as other information on prices and costs, in assessing the path of inflation. Return to text
4. For an explanation of how the Board of Governors of the Federal Reserve System evaluates changes in inflation, see Board of Governors (2016). Return to text
5. For examples of research on the costs of inflation, see Fischer and Modigliani (1978), Fischer (1981), McCallum (1990), Shiller (1997), and Feldstein (1999). See also the implications for monetary policy drawn by Bernanke and others (1999). Diercks (2019) provides a detailed analysis of work that has appeared on the issue since the mid-1990s. Return to text
6. One long-standing effect of inflation is that it creates incentives that would not otherwise be present to economize on low-interest-bearing money balances. More broadly, an inflationary environment may distort portfolio decisions. Return to text
7. Ultimately, nominal wage contracts will adjust to reflect a higher longer-run inflation rate. In the short run, however, it has been a long-standing feature of the U.S. economy that nominal wages tend to lag developments in prices; see, for example, Mitchell (1913) and Barattieri, Basu, and Gottschalk (2014). Consequently, inflation tends to drain worker purchasing power in the short run. Return to text
8. See, for example, Feldstein (1982). Return to text
9. Owing to contractual and other institutional arrangements, it may be difficult to adjust these streams of payments promptly once it emerges that the inflation rate is higher or lower than expected. Return to text
10. The Federal Reserve has had price stability as a formal part of its mandate since 1977. In 2012, the 2 percent inflation objective was seen as formalizing judgments that the Committee had already made over the previous years about the appropriate inflation rate. For analyses of how the Federal Reserve has interpreted its price-stability mandate over time, see the transcript of the FOMC's January 24–25, 2012, meeting, which is available on the Board's website at https://www.federalreserve.gov/monetarypolicy/files/FOMC20120125meeting.pdf; see also Orphanides (2006) and Nelson (2021). Return to text
11. See, for example, Summers (1991) and Reifschneider and Williams (2000). Blanchard, Dell'Ariccia, and Mauro (2010), among others, have suggested that central banks should consider raising their target inflation rate, on the grounds that conditions since the financial crisis have demonstrated that monetary policy is more constrained by the effective lower bound (ELB) on nominal interest rates than was originally estimated. Ball (2013), for example, has proposed 4 percent as a more appropriate target for the FOMC. While it is certainly likely that earlier analyses of the implications of the ELB significantly underestimated the likelihood of severe recessions and slow recoveries of the sort recently experienced in the United States and elsewhere (see Chung and others, 2012), it is also the case that these analyses did not consider central banks' ability to use large-scale asset purchases and other unconventional tools as a means of providing economic stabilization in the presence of the ELB constraint. Return to text
12. In rejecting a 4 percent inflation target, Bernanke (2010a) suggests that "inflation would be higher and probably more volatile under such a policy" and "inflation expectations would also likely become significantly less stable." According to Bernanke (2010b), "The Federal Reserve over a long period of time has established a great deal of credibility in terms of keeping inflation low, around 2 percent . . . If we were to go to 4 percent, and say we're going to 4 percent, we would risk I think losing a lot of that hard-won credibility because folks would say, well, if we go to 4, why not go to 6 . . . It would be very difficult to tie down credible expectations at 4." Return to text