September 29, 2016
Trends in Community Bank Performance over the Past 20 Years
At the "Community Banking in the 21st Century" Fourth Annual Community Banking Research and Policy Conference, sponsored by the Federal Reserve System and the Conference of State Bank Supervisors, St. Louis, Missouri
Welcome to Day 2 of the conference. I am grateful to the organizing committee for inviting me to be part of this important event once again. This is the third time that I have had the privilege of addressing this unique audience, which brings together bankers, bank supervisors, and banking researchers to share their thoughts regarding the current and future state of community banking. The interactions that occur at these annual gatherings are incredibly valuable and stimulate innovative thinking on the part of all three groups of participants.
As usual, the organizers have put together a highly relevant agenda. I was particularly struck by the way in which this year's program spans generations, from last night's keynote speaker, Gene Rainbolt, who began his career in banking more than 50 years ago, to the winners of the case study competition, who are just preparing to embark on their careers. I hope that these impressive and accomplished young men and women will enjoy long and successful careers in banking that they will be able to reflect back on during the 54th annual community banking conference in 2066. I have already penciled in the date on my calendar, and I look forward to hearing what they will have to say.
While the keynote addresses, case study competition, and networking opportunities all contribute to the appeal of this event, it is the research sessions that form the core of the conference. In the first research session yesterday, we heard about the importance of community banks to the Missouri economy, the viability of the traditional banking model, what is special about community banks, and the changing characteristics of the communities served by minority depository institutions. In the second session, we heard about the relationship between bank size and performance from three quite different perspectives. Both of these sessions provided cause for optimism about the future relevance and importance of community banks while simultaneously raising concerns about the viability of the very smallest banking organizations.
In my remarks today, I would like to explore this mixed message a bit further and ask what the observed trends in the data imply for today's community bankers and the communities they serve. In doing so, I will look at changes in the community banking sector at a national level and will also look at geographic patterns of community bank growth and decline. For purposes of these remarks, I will define community banks as those with less than $10 billion in assets, although my conclusions would be the same if I used a lower cutoff, such as $1 billion in assets, or a more detailed definition of community banks, such as that developed by the Federal Deposit Insurance Corporation (FDIC) a few years ago.1 As always, the views I express here today are my own.
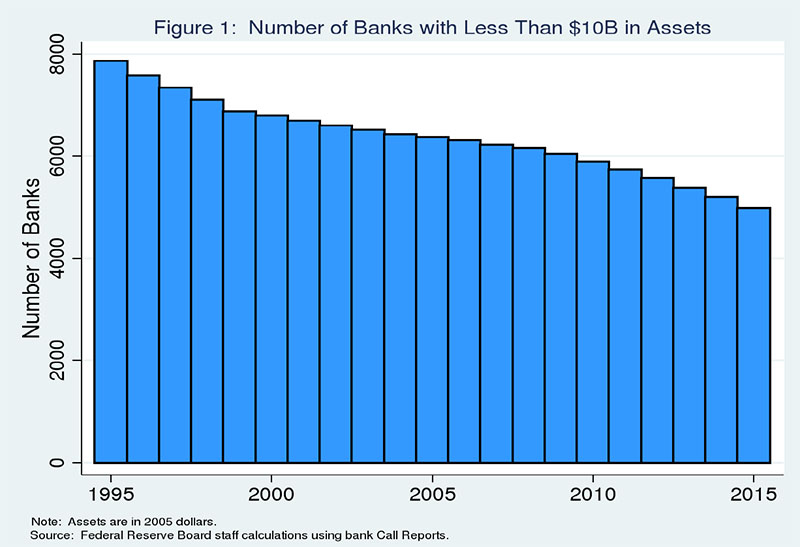
I will start by discussing figures showing the number of community banks operating in the United States over the past 20 years. Figure 1 shows the number of community banks for each year from 1995 to 2015. It shows a steady decline in the number of such banks over time. The rate of decline is considerably steeper in the late 1990s than in the period from 2000 to 2010. In the past five years, the rate of decrease has accelerated somewhat but remains slower than that experienced in the late 1990s.
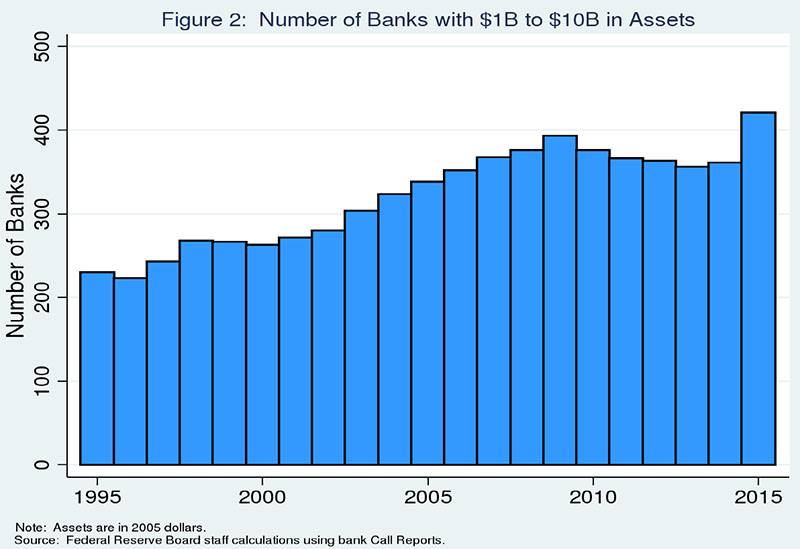
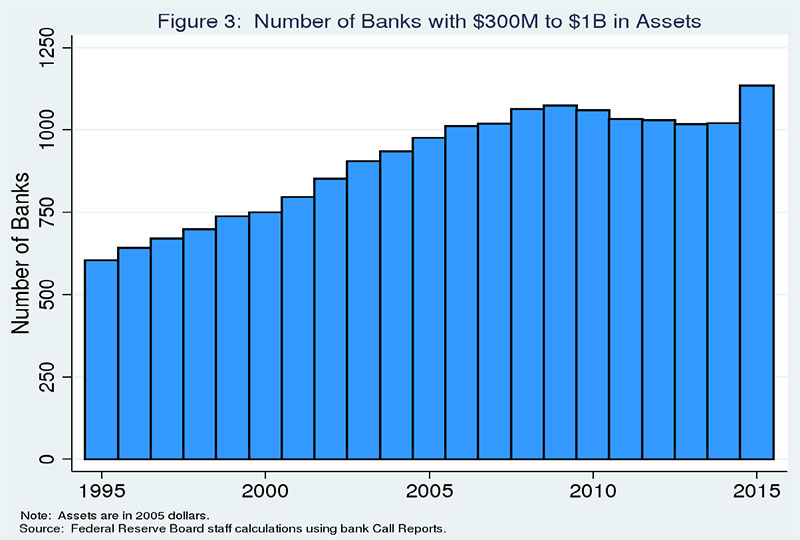
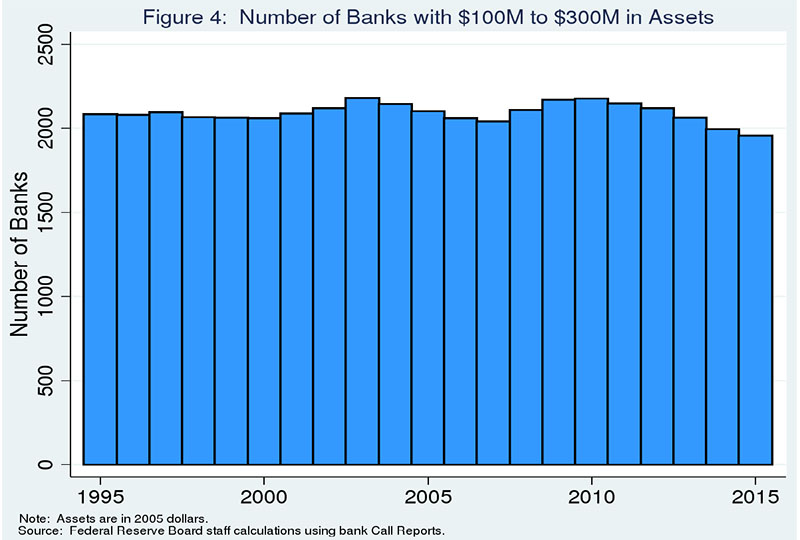
Breaking the universe of community banks down into subgroups based on size, we can see that the decline in community bank numbers is far from uniform.2 The number of banks with between $1 billion and $10 billion in assets has doubled since 1995 (figure 2), although such banks still make up a small percentage of all community banks. I should note that the growth in this "large community bank" category is greater than that among banks with more than $10 billion in assets, in terms of both the number of banks added to the category and the percentage growth rate. Banks ranging in size from $300 million to $1 billion have also roughly doubled in number over these past 20 years (figure 3). And the number of banks in the size range from $100 million to $300 million in assets has declined by only a very modest percentage since 1995 (figure 4).
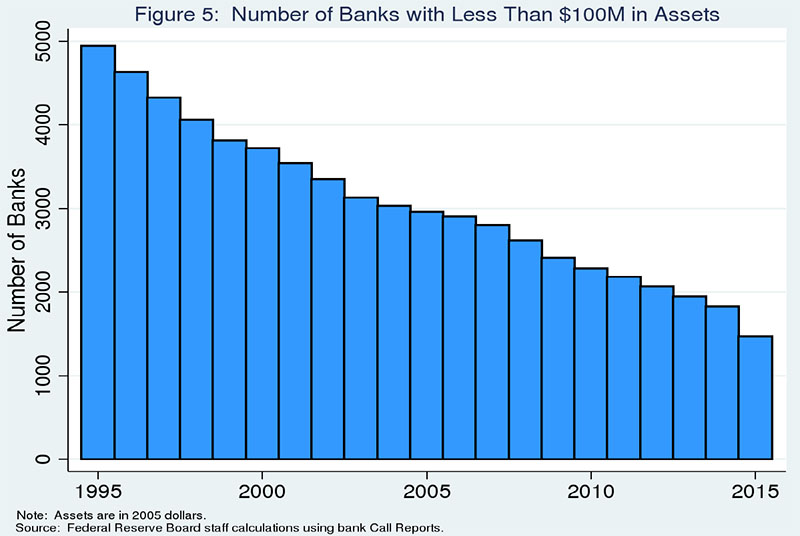
However, the picture for banks with less than $100 million in assets is very different from the picture for larger banks. As can be seen in figure 5, the number of such banking organizations has declined by more than two-thirds since 1995. As with the pattern for all community banks, the decline in the number of these small community banks was steeper in the late 1990s than in later years.
We can identify four factors that help to account for the decrease in the number of banks with under $100 million in assets. Some of this decline reflects the growth of small banks (often de novo banks) out of the smallest size range into larger size categories due to either organic growth or acquisition of another bank. Indeed, 90 percent of the large drop-off in the number of banks in this size range in 2014 and 2015 is due to banks moving up into a larger size category. A number of the smallest banking organizations also disappeared as a result of being merged with or acquired by other banking organizations. Some of the decline reflects the failures experienced in the Great Recession. And, finally, there have been few new bank formations in recent years.
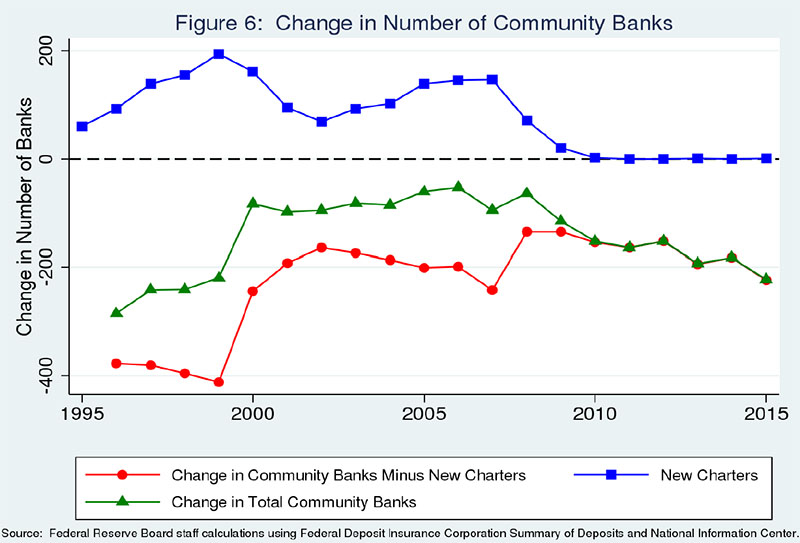
As noted in a 2014 article by McCord and Prescott, a key difference between the past few years and the late 1990s is that the recent acceleration in the rate of decrease in the number of community banks is due in large part to a decline in new bank charters rather than an increase in the annual number of exits.3 This fact can be seen in figure 6, which shows the number of new charters each year (in blue, with squares to mark yearly values), the actual annual change in the number of community banks (in green, with triangles), and what the annual change in the number of banks would have been in the absence of new entry (in red, with circles), over the past 20 years. It is clear from this figure that in the absence of new entry, the annual decline in the number of community banks between 2000 and 2010 would have been quite similar to what it has been since 2010. Or, viewed from a different perspective, if entry had remained at more "normal" levels during the past 5 years, the rate of decline in the number of community banks would not have accelerated. And, since almost all new entrants have less than $100 million in assets, the decline in the number of banks in this smallest size category would have been much less steep during the past 5 years.
Research by Adams and Gramlich that was presented at the 2014 community banking conference and subsequently published in the Review of Industrial Organization considers the underlying causes of the virtual absence of new bank formation since 2009.4 This research suggests that slow economic growth and low interest rates in the post-crisis environment can explain about 75 percent of the decline in new bank charters. The authors were not able to isolate the effect of regulatory changes on the rate of new bank formation, but note that regulation may also play a role.
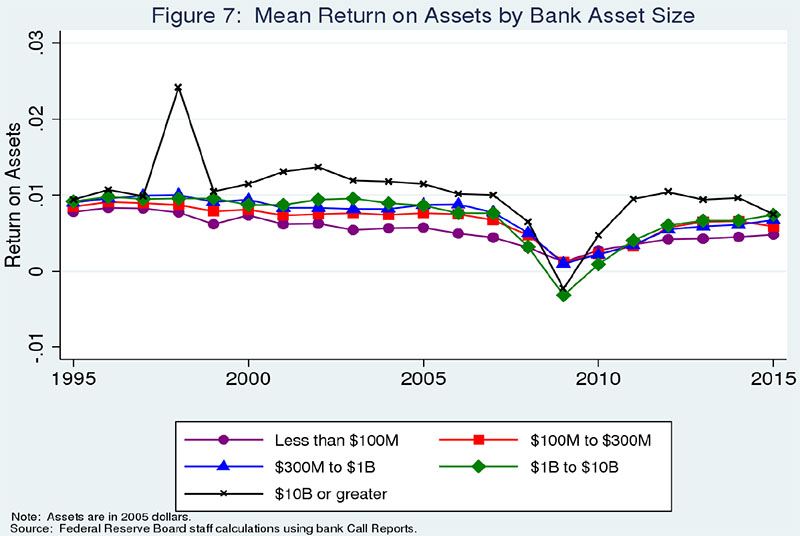
The sharp difference in trends for the number of banks with less than $100 million in assets compared with larger community banks naturally leads to the question of whether this difference is reflected in basic bank performance measures. I will begin with return on assets (ROA). Breaking down all community banks into the same size categories I used earlier, with the addition of a category for all banks larger than $10 billion in assets, we find striking differences in the patterns of bank profitability over time (figure 7). The largest community banks--those with $1 billion to $10 billion in assets (in green, with diamonds to mark yearly values)--followed a pattern similar to that of our largest banks (in black, with crosses), but with slightly worse results throughout the past 20 years. These large community banks had lower average levels of profitability than our largest banks prior to the recent recession, suffered worse losses in 2009, and have enjoyed lower levels of earnings since the crisis.
Banks in the size range from $300 million to $1 billion in assets (in blue, with triangles) have been the most consistently profitable group among community banks, although their profit levels still lag those for the largest banks. These midsize community banks performed as well as banks with $1 billion to $10 billion in assets before the recent recession and remained profitable, on average, even in 2009.
The story is much the same for banks in the size class from $100 million to $300 million in assets (in red, with squares). Their profit levels were slightly lower than those for larger community banks prior to the crisis, but they performed similarly until 2015, when banks of this size showed a decline in profits not experienced by any other size grouping of community banks. Time will tell whether this is an anomaly or the beginning of a pattern.
Looking at the smallest community banks, those with less than $100 million in assets, gives some hints for why their numbers have declined. The average ROA for the smallest banks (in purple, with circles) has been consistently lower than that for the next-smallest class of banks since 1995. The already lower level of profits for the smallest banks began to decline further in 2006. Since 2009, profits for the smallest banks have increased slightly but remain below their levels of profitability prior to the recession and below the ROA levels for larger banks.5
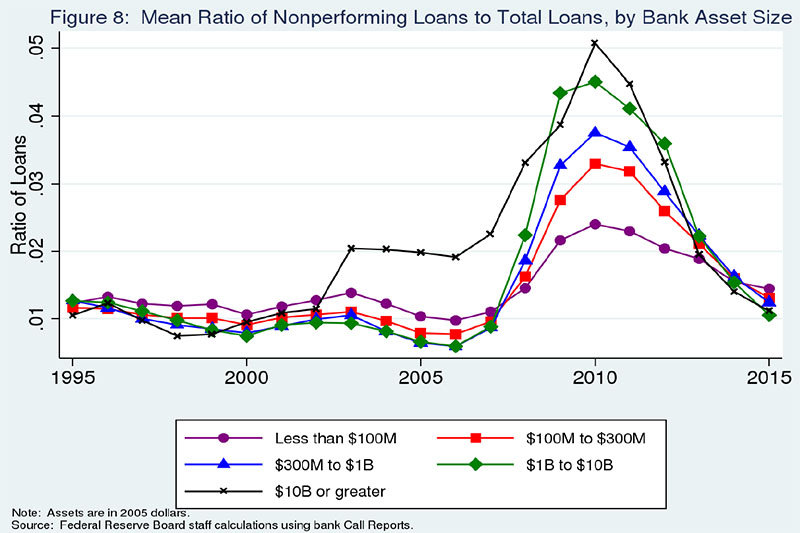
Data on nonperforming loans (NPLs) show a mixed picture.6 A breakdown of community banks by size indicates that the ratio of NPLs to total loans peaked for every size category in 2010 (figure 8). Prior to 2007, the smallest community banks consistently had a higher ratio of NPLs than did larger community banks; but from 2007 until 2013, their NPL rate was below that of larger community banks. In the past two years, NPLs on the balance sheets of the smallest banks have declined more slowly than for larger banks so that banks with less than $100 million in assets once again have the highest NPL ratio.
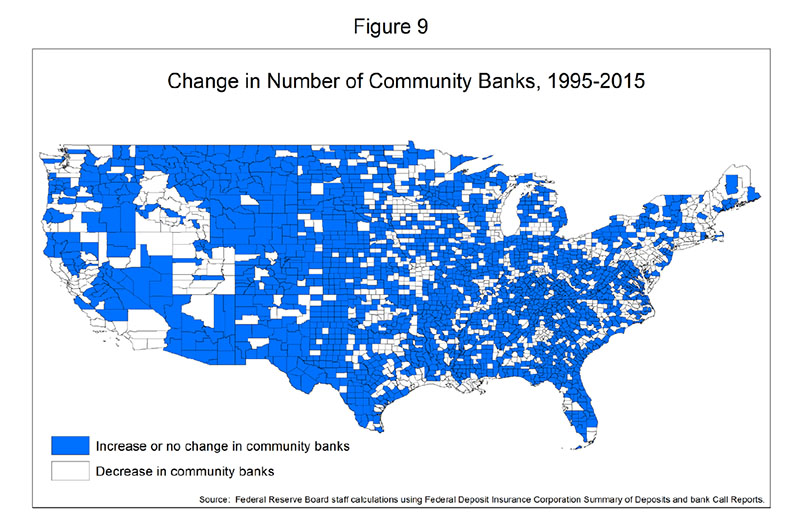
Let me turn now to consider changes in the number of community banks over the past 20 years at a more local level. For purposes of this discussion, I define local banking markets as counties in rural areas and as Metropolitan Statistical Areas in urban areas. Figure 9 shows those local banking markets in which the number of community banks decreased over the 20 years from 1995 to 2015 (in white) and those markets in which the number of community banks increased or stayed constant (in blue). As you can see, there are markets in every state where the number of community banks has declined. However, there also are markets in every state where community banks have maintained or increased their presence. In fact, the number of local markets that saw their population of community banks hold constant or increase between 1995 and 2015 was more than double the number of local markets that experienced a decline in the number of community banks over this period. And, perhaps surprisingly, the share of rural markets experiencing a decrease in the number of community banks (about 32 percent) was slightly lower than the share of urban markets facing such a decline (about 35 percent).
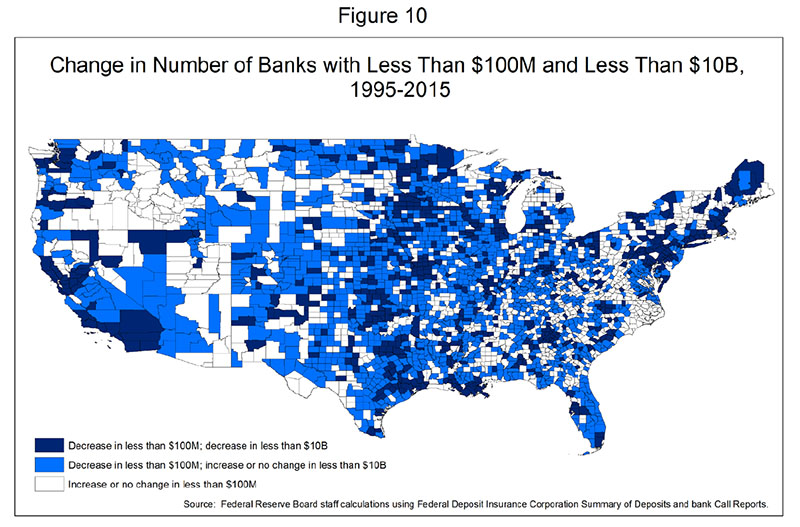
As we saw, the vast majority of the decline in the number of community banks involved banks with less than $100 million in assets. This next figure (figure 10) shows changes in the number of banks in this smallest size category together with changes in the number of all community banks. The local markets that are shaded in dark blue are those where both the number of banks with less than $100 million in assets and the number of all community banks declined between 1995 and 2015. The light-blue markets are those where the total number of community banks remained constant or increased despite a decline in the number of banks in the smallest size category. There are just over twice as many markets shaded in light blue as there are shaded in dark blue, indicating that in two-thirds of the markets where the number of very small community banks declined, the number of community banks overall did not decline. Markets in white are those where the number of banks in the smallest category increased or remained unchanged over the past 20 years.
This examination of the geographic patterns of changes in the population of community banks has shown that most markets in the United States have maintained or increased their numbers of community banks over the past 20 years. Those local markets that have lost community banks have not been concentrated in any particular section of the country, and urban markets have been slightly more likely to lose community banks over the past 20 years than rural areas.
One might ask, what factors have led some markets to lose community banks while others gained community banks or saw no change? Because of the importance of community banks as a source of small business lending and other retail services, we have explored this question but do not yet have any definitive answers. We considered the possibility that underlying demographic characteristics were driving the observed changes in the number of banks in a local market area. Perhaps the size of the labor force or the population density, the racial and ethnic mix of the population, or changes in any of these factors might explain the outcome. We also considered whether economic conditions such as the unemployment rate, the median household income, the number of business establishments, or changes in any of these measures might be useful in predicting which markets would lose community banks over time. Taking into account all of these variables in a regression framework did not yield much explanatory power.
This analysis has not led us to a clear story regarding the determinants of changes in the number of community banks serving a local market area, but we intend to continue our research efforts and hope that they will ultimately yield some valuable insights. We can take some comfort from the fact that the number of local markets that either maintained or increased the number of community banks serving their residents and small businesses is much larger than the number of markets that saw a decline in the number of community banks. That said, we recognize that the loss of community banks may have caused some communities to suffer adverse economic consequences.
So, what do we take away from this review of bank numbers and performance? First, the decline in the number of community banks is not a recent phenomenon--it has been a constant theme over at least the past 20 years. Second, it has occurred almost exclusively among the smallest community banks--those with less than $100 million in assets. However, I want to emphasize that the long-trending decline in the number of very small community banks does not mean that these banks do not play an important role in our financial system. Almost all newly chartered banks fall into this category, and many of these banks thrive and, ultimately, outgrow the smallest size category. Thus, banks with less than $100 million in assets should be viewed as a key source of dynamism and competition within the banking sector. Third, although the rate of decline has accelerated a bit during the past 5 years, that acceleration is largely due to a lack of entry rather than an increased rate of exit. Fourth, although the lack of entry may be due in part to increased regulatory burden, much of it can be explained by very low interest rates and a post-crisis expansion that has been slower than usual. Fifth, at a local level, about one-third of markets have seen a decline in the number of community banks over the past 20 years, but about two-thirds have seen no change or an increase in the number of community banks. It is unclear what factors explain observed changes in the number of community banks at a local market level. More research is needed on this question.
I think the key question for policymakers is whether the recent acceleration in the rate of decline in the number of small banks is primarily a structural change attributable to increasing economies of scale--or, perhaps more accurately, diseconomies of very small scale--or whether recent efforts by the FDIC and others to encourage more chartering of new banks, combined with a return to higher interest rates and stronger economic growth, will mitigate the decline in numbers. At this point, I think it is too soon to say.
The Federal Reserve and the Conference of State Bank Supervisors began this conference three years ago in order to stimulate research on community banks, with the goal of improving our understanding of their condition and their important contributions to economic growth and prosperity. We plan to continue our own research efforts across the Federal Reserve System, as well as our efforts, through initiatives such as this conference, to encourage academics to focus their attention on community banks.
Of course, the Federal Reserve's support for community banks goes well beyond research. One of the clearest lessons from our most recent recession is that, when it comes to bank regulation and supervision, one size does not fit all. As we seek to promote safety and soundness and ensure consumer compliance, we increasingly tailor rules and supervisory approaches to the differing risks posed by institutions of different size and complexity. This way, we can achieve our aims without creating undue regulatory burden. The Federal Reserve is committed to this approach to community bank oversight and to ensuring that new and existing regulations are not unduly burdensome for community banks. In addition to fulfilling this commitment, the Federal Reserve and other federal banking agencies have launched a review to identify banking regulations that are outdated, unnecessary, or unduly burdensome, as required by the Economic Growth and Regulatory Paperwork Reduction Act.
The Federal Reserve has taken some concrete steps to provide burden relief by publishing a streamlined Call Report for non-complex community banks, extending the examination cycle for banks with $1 billion or less in total assets, increasing the threshold for the Small Bank Holding Company Policy Statement to $1 billion and expanding the scope to include savings and loan holding companies. In addition, we have efforts underway to reduce burden associated with our real estate appraisal requirements, to simplify the regulatory capital requirement for community banks, to encourage resource sharing among community banks to help manage their BSA and AML obligations, and to use Call Report data and forward-looking risk analytics to identify high-risk community banks, which would allow us to focus our supervisory response on the areas of highest risk and reduce the regulatory burden on low-risk community banks. We will continue to work with bankers and the other banking regulators to ensure that we reduce burden and complexity in our regulations and guidance.
Another way that we further our understanding is by talking to the bankers themselves. The entire Board of Governors meets twice a year with the Community Depository Institutions Advisory Council, which includes representatives of community banks, thrifts, and credit unions in each of the 12 Federal Reserve Districts. Individual Governors also take advantage of opportunities to meet with community bankers from time to time. I speak regularly to bank executives, including those who run smaller institutions. I find these types of conversations--with people who live and work in the world outside the Capital Beltway and far from Wall Street--to be particularly enlightening. In addition, I hope that some of the conversations here today among researchers, bankers, and bank regulators will continue, leading to benefits to all in the form of more informative research, better design and implementation of regulatory policy, and enhanced community bank performance.
1. The FDIC definition of community banks can be found at https://www.fdic.gov/regulations/resources/cbi/report/CBSI-1.pdf. Return to text
2. All asset sizes are converted to 2005 dollars, so the changes in size distribution cannot be attributed to inflation. Return to text
3. See Roisin McCord and Edward Simpson Prescott (2014), "The Financial Crisis, the Collapse of Bank Entry, and Changes in the Size Distribution of Banks ," Federal Reserve Bank of Richmond, Economic Quarterly, vol. 100 (First Quarter), pp. 23-50. Return to text
4. Robert M. Adams and Jacob Gramlich (2016), "Where Are All the New Banks? The Role of Regulatory Burden in New Bank Formation," Review of Industrial Organization, vol. 48 (March), pp. 181-208. Return to text
5. The patterns for return on equity (ROE) are similar to those for ROA, although community banks as a whole had negative ROE in both 2009 and 2010. The largest community banks, with $1 billion to $10 billion in assets, suffered much greater negative returns on equity in these years than did smaller community banks. Midsize community banks, with $300 million to $1 billion in assets, fared better than their larger and smaller counterparts.
The smallest community banks showed an unusual pattern in their ROEs. (It should be noted that, for banks of this size, ROE can be a questionable measure of profitability because such banks tend to be either privately held or very thinly traded.) These banks were in the only size category that did not show a negative ROE in 2009, but it was also the only class to show a negative ROE in 2013, and the ROE for these banks has been consistently below that for larger banks since the recession. Return to text
6. NPLs are defined as nonaccrual loans plus loans that are 90-plus days past due and still accruing. Return to text