November 30, 2022
Inflation and the Labor Market
At the Hutchins Center on Fiscal and Monetary Policy, Brookings Institution, Washington, D.C.
Today I will offer a progress report on the Federal Open Market Committee's (FOMC) efforts to restore price stability to the U.S. economy for the benefit of the American people. The report must begin by acknowledging the reality that inflation remains far too high. My colleagues and I are acutely aware that high inflation is imposing significant hardship, straining budgets and shrinking what paychecks will buy. This is especially painful for those least able to meet the higher costs of essentials like food, housing, and transportation. Price stability is the responsibility of the Federal Reserve and serves as the bedrock of our economy. Without price stability, the economy does not work for anyone. In particular, without price stability, we will not achieve a sustained period of strong labor market conditions that benefit all.
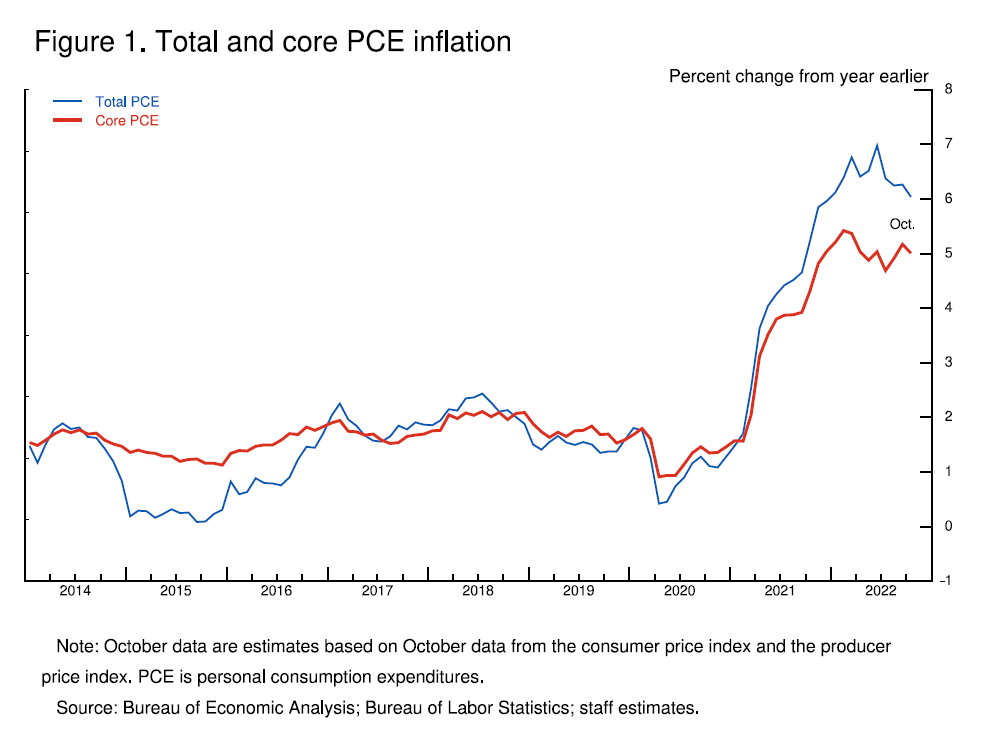
We currently estimate that 12-month personal consumption expenditures (PCE) inflation through October ran at 6.0 percent (figure 1).1 While October inflation data received so far showed a welcome surprise to the downside, these are a single month's data, which followed upside surprises over the previous two months. As figure 1 makes clear, down months in the data have often been followed by renewed increases. It will take substantially more evidence to give comfort that inflation is actually declining. By any standard, inflation remains much too high.
For purposes of this discussion, I will focus my comments on core PCE inflation, which omits the food and energy inflation components, which have been lower recently but are quite volatile. Our inflation goal is for total inflation, of course, as food and energy prices matter a great deal for household budgets. But core inflation often gives a more accurate indicator of where overall inflation is headed. Twelve-month core PCE inflation stands at 5.0 percent in our October estimate, approximately where it stood last December when policy tightening was in its early stages. Over 2022, core inflation rose a few tenths above 5 percent and fell a few tenths below, but it mainly moved sideways. So when will inflation come down?
I could answer this question by pointing to the inflation forecasts of private-sector forecasters or of FOMC participants, which broadly show a significant decline over the next year. But forecasts have been predicting just such a decline for more than a year, while inflation has moved stubbornly sideways. The truth is that the path ahead for inflation remains highly uncertain. For now, let's put aside the forecasts and look instead to the macroeconomic conditions we think we need to see to bring inflation down to 2 percent over time.
For starters, we need to raise interest rates to a level that is sufficiently restrictive to return inflation to 2 percent. There is considerable uncertainty about what rate will be sufficient, although there is no doubt that we have made substantial progress, raising our target range for the federal funds rate by 3.75 percentage points since March. As our last postmeeting statement indicates, we anticipate that ongoing increases will be appropriate. It seems to me likely that the ultimate level of rates will need to be somewhat higher than thought at the time of the September meeting and Summary of Economic Projections. I will return to policy at the end of my comments, but for now, I will simply say that we have more ground to cover.
We are tightening the stance of policy in order to slow growth in aggregate demand. Slowing demand growth should allow supply to catch up with demand and restore the balance that will yield stable prices over time. Restoring that balance is likely to require a sustained period of below-trend growth.
Last year, the ongoing reopening of the economy boosted real gross domestic product (GDP) growth to a very strong 5.7 percent. This year, GDP was roughly flat through the first three quarters, and indicators point to modest growth this quarter, which seems likely to bring the year in with very modest growth overall. Several factors contributed to this slowing growth, including the waning effects of reopening and of pandemic fiscal support, the global implications of Russia's war against Ukraine, and our policy actions, which tightened financial conditions and are affecting economic activity, particularly in interest-sensitive sectors such as housing. We can say that demand growth has slowed, and we expect that this growth will need to remain at a slower pace for a sustained period.
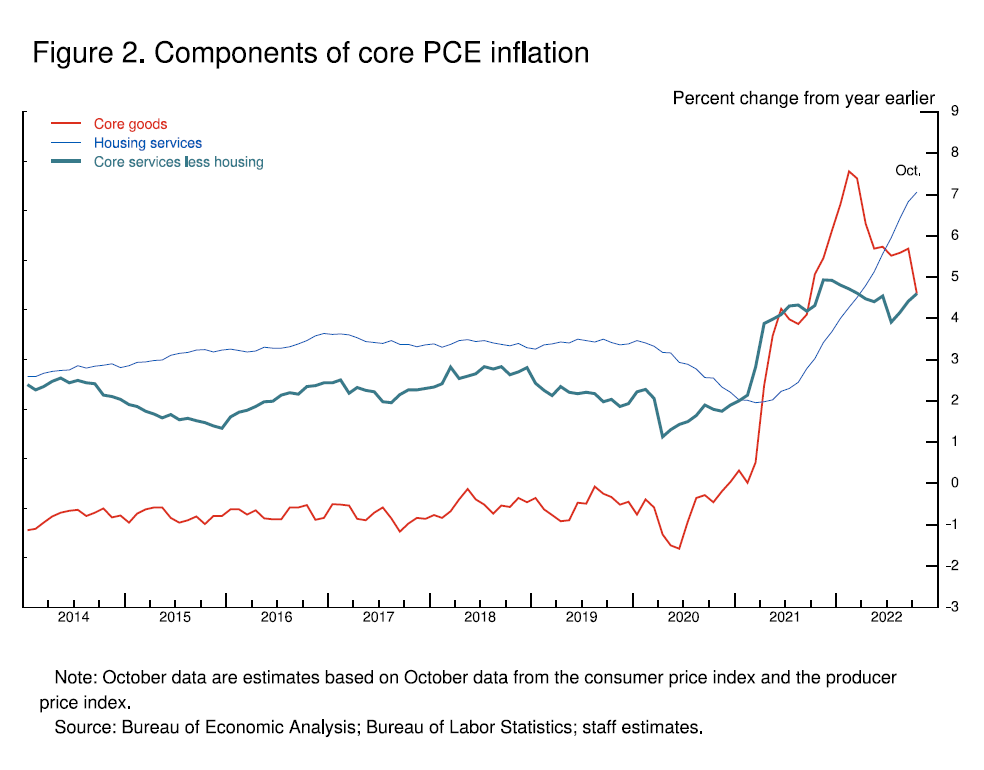
Despite the tighter policy and slower growth over the past year, we have not seen clear progress on slowing inflation. To assess what it will take to get inflation down, it is useful to break core inflation into three component categories: core goods inflation, housing services inflation, and inflation in core services other than housing (figure 2).
Core goods inflation has moved down from very high levels over the course of 2022, while housing services inflation has risen rapidly. Inflation in core services ex housing has fluctuated but shown no clear trend. I will discuss each of these items in turn.
Early in the pandemic, goods prices began rising rapidly, as abnormally strong demand was met by pandemic-hampered supply. Reports from businesses and many indicators suggest that supply chain issues are now easing. Both fuel and nonfuel import prices have fallen in recent months, and indicators of prices paid by manufacturers have moved down. While 12-month core goods inflation remains elevated at 4.6 percent, it has fallen nearly 3 percentage points from earlier in the year. It is far too early to declare goods inflation vanquished, but if current trends continue, goods prices should begin to exert downward pressure on overall inflation in coming months.
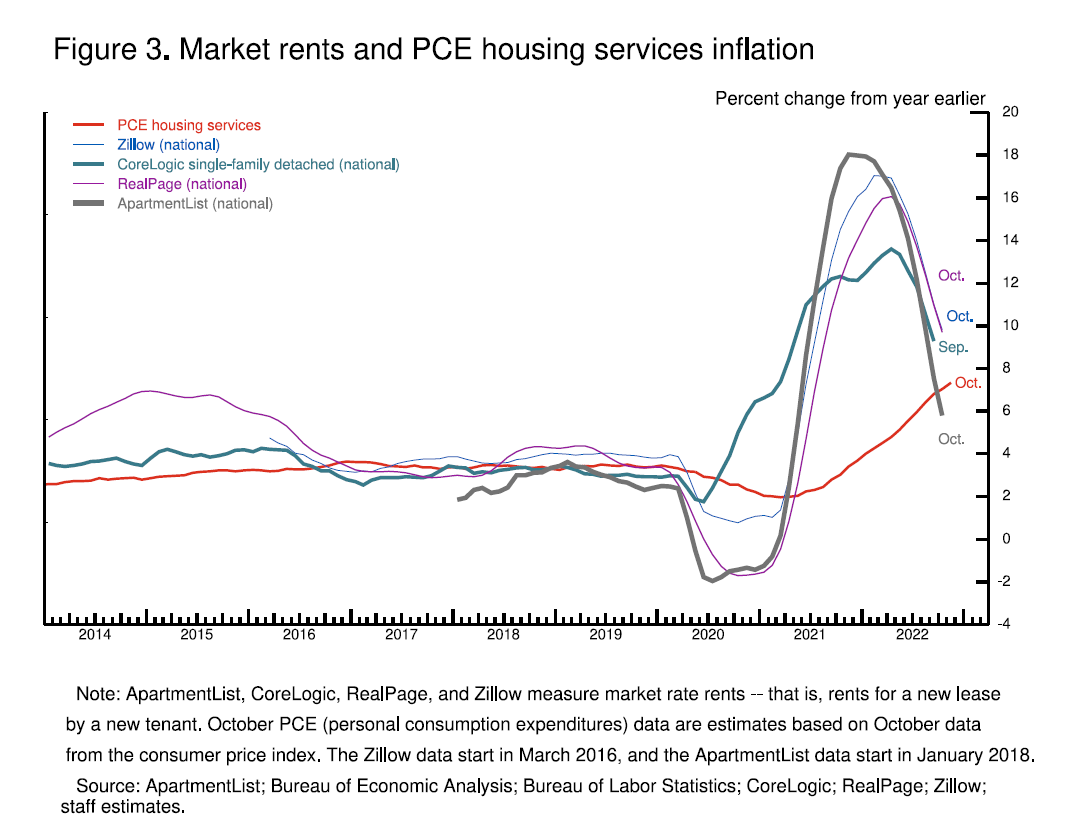
Housing services inflation measures the rise in the price of all rents and the rise in the rental-equivalent cost of owner-occupied housing. Unlike goods inflation, housing services inflation has continued to rise and now stands at 7.1 percent over the past 12 months. Housing inflation tends to lag other prices around inflation turning points, however, because of the slow rate at which the stock of rental leases turns over.2 The market rate on new leases is a timelier indicator of where overall housing inflation will go over the next year or so. Measures of 12-month inflation in new leases rose to nearly 20 percent during the pandemic but have been falling sharply since about midyear (figure 3).
As figure 3 shows, however, overall housing services inflation has continued to rise as existing leases turn over and jump in price to catch up with the higher level of rents for new leases. This is likely to continue well into next year. But as long as new lease inflation keeps falling, we would expect housing services inflation to begin falling sometime next year. Indeed, a decline in this inflation underlies most forecasts of declining inflation.
Finally, we come to core services other than housing. This spending category covers a wide range of services from health care and education to haircuts and hospitality. This is the largest of our three categories, constituting more than half of the core PCE index. Thus, this may be the most important category for understanding the future evolution of core inflation. Because wages make up the largest cost in delivering these services, the labor market holds the key to understanding inflation in this category.
In the labor market, demand for workers far exceeds the supply of available workers, and nominal wages have been growing at a pace well above what would be consistent with 2 percent inflation over time.3 Thus, another condition we are looking for is the restoration of balance between supply and demand in the labor market.
Signs of elevated labor market tightness emerged suddenly in mid-2021. The unemployment rate at the time was much higher than the 3.5 percent that had prevailed without major signs of tightness before the pandemic. Employment was still millions below its level on the eve of the pandemic. Looking back, we can see that a significant and persistent labor supply shortfall opened up during the pandemic—a shortfall that appears unlikely to fully close anytime soon.
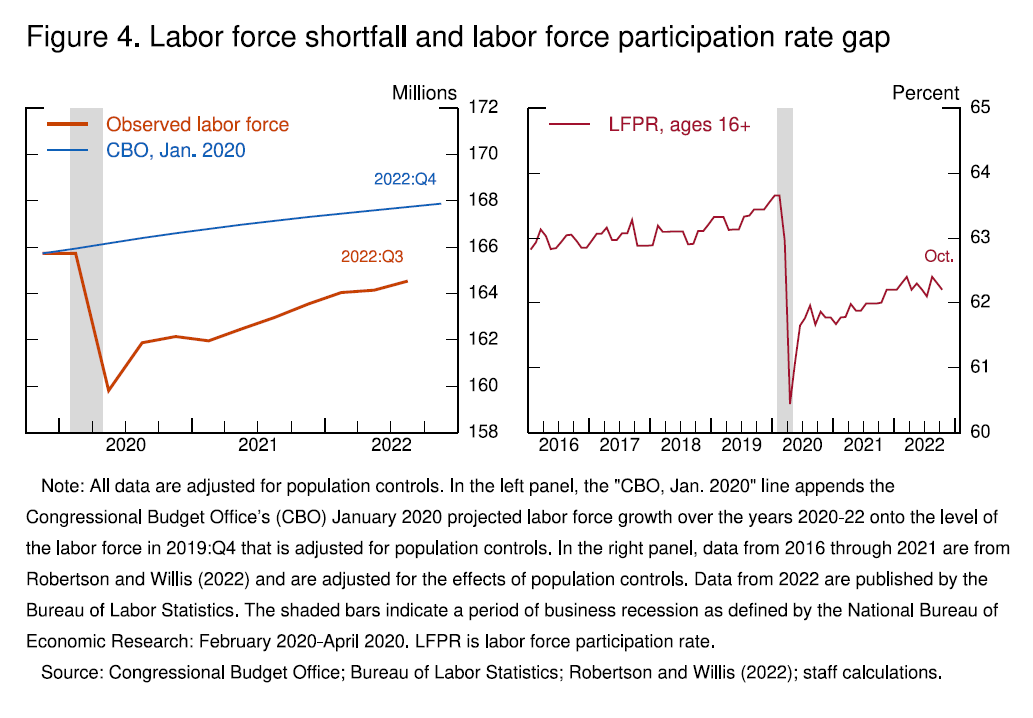
Comparing the current labor force with the Congressional Budget Office's pre-pandemic forecast of labor force growth reveals a current labor force shortfall of roughly 3-1/2 million people (figure 4, left panel).4 This shortfall reflects both lower-than-expected population growth and a lower labor force participation rate (figure 4, right panel). Participation dropped sharply at the onset of the pandemic because of many factors, including sickness, caregiving, and fear of infection. Many forecasters expected that participation would move back up fairly quickly as the pandemic faded. And for workers in their prime working years, it mostly has. Overall participation, however, remains well below pre-pandemic trends.
Some of the participation gap reflects workers who are still out of the labor force because they are sick with COVID-19 or continue to suffer lingering symptoms from previous COVID infections ("long COVID").5 But recent research by Fed economists finds that the participation gap is now mostly due to excess retirements—that is, retirements in excess of what would have been expected from population aging alone.6 These excess retirements might now account for more than 2 million of the 3‑1/2 million shortfall in the labor force.7
What explains these excess retirements? Health issues have surely played a role, as COVID has posed a particularly large threat to the lives and health of the elderly.8 In addition, many older workers lost their jobs in the early stages of the pandemic, when layoffs were historically high. The cost of finding new employment may have appeared particularly large for these workers, given pandemic-related disruptions to the work environment and health concerns.9 Also, gains in the stock market and rising house prices in the first two years of the pandemic contributed to an increase in wealth that likely facilitated early retirement for some people.
The data so far do not suggest that excess retirements are likely to unwind because of retirees returning to the labor force. Older workers are still retiring at higher rates, and retirees do not appear to be returning to the labor force in sufficient numbers to meaningfully reduce the total number of excess retirees.10
The second factor contributing to the labor supply shortfall is slower growth in the working-age population. The combination of a plunge in net immigration and a surge in deaths during the pandemic probably accounts for about 1-1/2 million missing workers.11
Policies to support labor supply are not the domain of the Fed: Our tools work principally on demand. Without advocating any particular policy, however, I will say that policies to support labor force participation could, over time, bring benefits to the workers who join the labor force and support overall economic growth. Such policies would take time to implement and have their effects, however. For the near term, a moderation of labor demand growth will be required to restore balance to the labor market.
Currently, the unemployment rate is at 3.7 percent, near 50-year lows, and job openings exceed available workers by about 4 million—that is about 1.7 job openings for every person looking for work (figure 5). So far, we have seen only tentative signs of moderation of labor demand. With slower GDP growth this year, job gains have stepped down from more than 450,000 per month over the first seven months of the year to about 290,000 per month over the past three months. But this job growth remains far in excess of the pace needed to accommodate population growth over time—about 100,000 per month by many estimates. Job openings have fallen by about 1.5 million this year but remain higher than at any time before the pandemic.
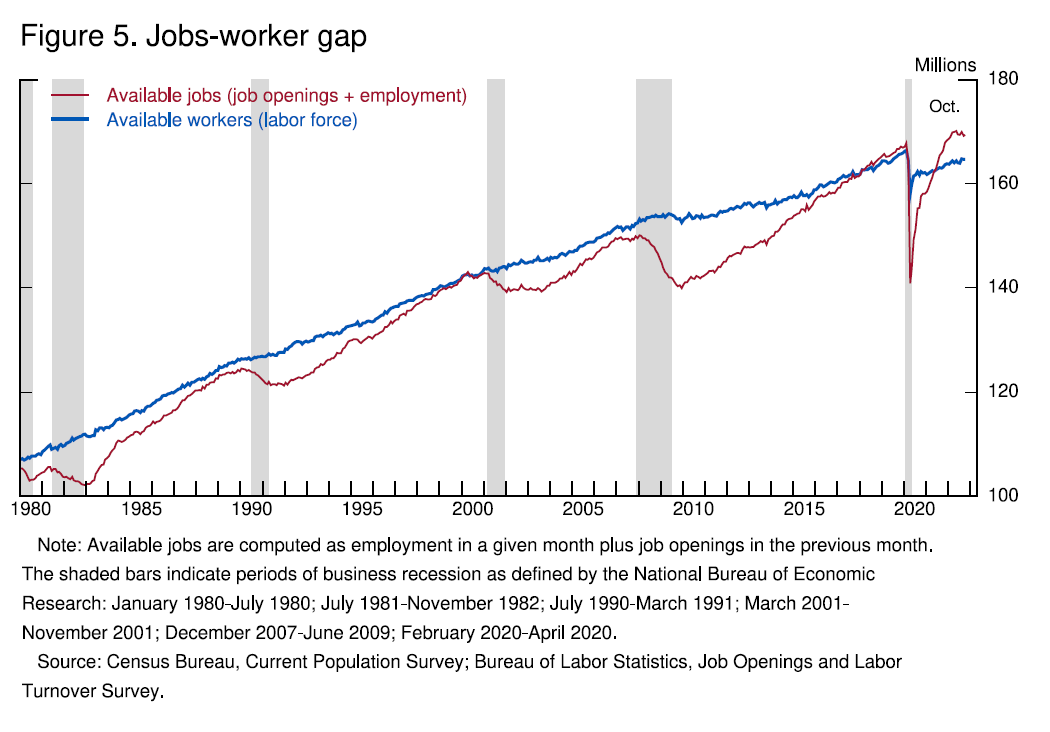
Wage growth, too, shows only tentative signs of returning to balance. Some measures of wage growth have ticked down recently (figure 6). But the declines are very modest so far relative to earlier increases and still leave wage growth well above levels consistent with 2 percent inflation over time. To be clear, strong wage growth is a good thing. But for wage growth to be sustainable, it needs to be consistent with 2 percent inflation.
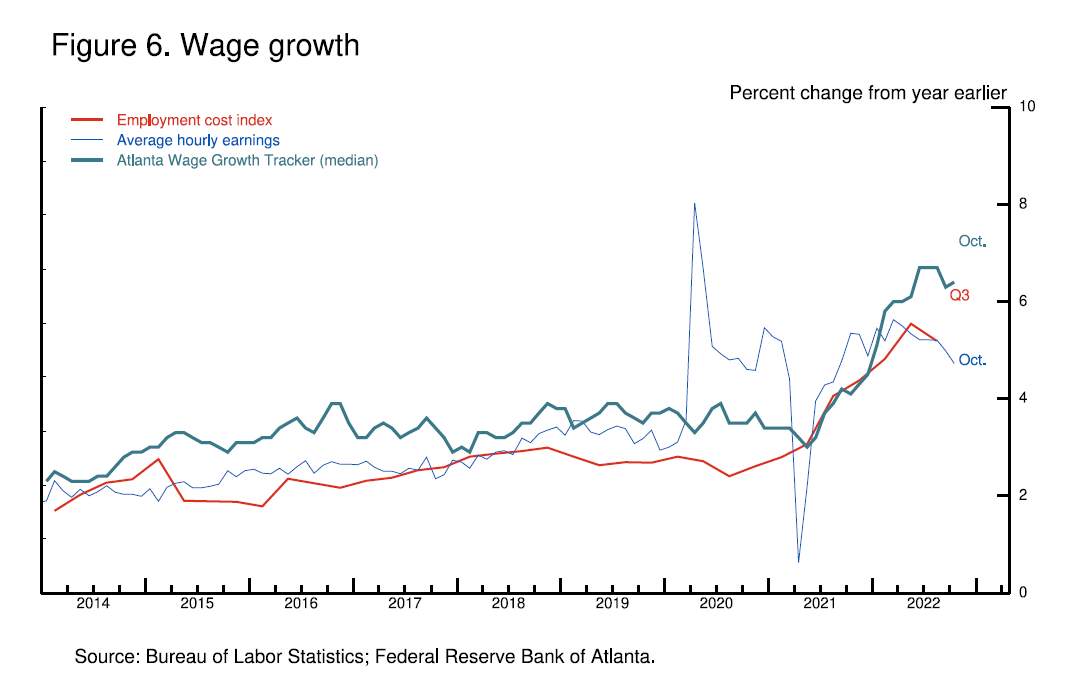
Let's sum up this review of economic conditions that we think we need to see to bring inflation down to 2 percent. Growth in economic activity has slowed to well below its longer-run trend, and this needs to be sustained. Bottlenecks in goods production are easing and goods price inflation appears to be easing as well, and this, too, must continue. Housing services inflation will probably keep rising well into next year, but if inflation on new leases continues to fall, we will likely see housing services inflation begin to fall later next year. Finally, the labor market, which is especially important for inflation in core services ex housing, shows only tentative signs of rebalancing, and wage growth remains well above levels that would be consistent with 2 percent inflation over time. Despite some promising developments, we have a long way to go in restoring price stability.
Returning to monetary policy, my FOMC colleagues and I are strongly committed to restoring price stability. After our November meeting, we noted that we anticipated that ongoing rate increases will be appropriate in order to attain a policy stance that is sufficiently restrictive to move inflation down to 2 percent over time.
Monetary policy affects the economy and inflation with uncertain lags, and the full effects of our rapid tightening so far are yet to be felt. Thus, it makes sense to moderate the pace of our rate increases as we approach the level of restraint that will be sufficient to bring inflation down. The time for moderating the pace of rate increases may come as soon as the December meeting. Given our progress in tightening policy, the timing of that moderation is far less significant than the questions of how much further we will need to raise rates to control inflation, and the length of time it will be necessary to hold policy at a restrictive level. It is likely that restoring price stability will require holding policy at a restrictive level for some time. History cautions strongly against prematurely loosening policy. We will stay the course until the job is done.
References
Bureau of Labor Statistics (2022). "Worker Displacement: 2019–2021 (PDF)," press release, August 26.
Camarota, Steven A., and Karen Zeigler (2022). Estimating the Illegal Immigrant Population Using the Current Population Survey. Washington: Center for Immigration Studies, March.
Congressional Budget Office (2020). The Budget and Economic Outlook: 2020 to 2030 (PDF). Washington: CBO, January.
Goda, Gopi Shah, and Evan J. Soltas (2022). "The Impacts of COVID-19 Illnesses on Workers (PDF)," NBER Working Paper Series 30435. Cambridge, Mass.: National Bureau of Economic Research, September.
Montes, Joshua, Christopher Smith, and Juliana Dajon (2022). " 'The Great Retirement Boom': The Pandemic-Era Surge in Retirements and Implications for Future Labor Force Participation," Finance and Economics Discussion Series 2022-081. Washington: Board of Governors of the Federal Reserve System, November.
Price, Brendan M. (2022). "Long COVID, Cognitive Impairment, and the Stalled Decline in Disability Rates," FEDS Notes. Washington: Board of Governors of the Federal Reserve System, August 5.
Sheiner, Louise, and Nasiha Salwati (2022). "How Much Is Long COVID Reducing Labor Force Participation? Not Much (So Far) (PDF)," Hutchins Center Working Paper 80. Washington: Brookings Institution, October.
U.S. Customs and Border Protection (2022). CBP Enforcement Statistics: Fiscal Year 2022. Washington: CBP, November.
U.S. Department of Homeland Security (2022). Legal Immigration and Adjustment of Status Report: Fiscal Year 2022, Quarter 2. Washington: Department of Homeland Security, October.
1. Throughout this discussion, PCE data for October are estimates based on the October consumer price index and producer price index data. Return to text
2. Rental lease data are also the main input into the measurement of owner-occupied housing prices. Return to text
3. The pace of wage inflation affects all sectors of the economy, but wages are a particularly large share of costs in core services ex housing and, thus, particularly important for inflation in this category. Return to text
4. See Congressional Budget Office (2020). To account for the effect of population controls on the level of the labor force, the shortfall is calculated by appending the Congressional Budget Office's January 2020 projected labor force growth over the years 2020–22 onto the level of the labor force in 2019:Q4 that is adjusted for population controls. Return to text
5. Recent research suggests that long COVID may be keeping 280,000 to 680,000 individuals aged 16 to 64 out of the labor force (Sheiner and Salwati, 2022), and long COVID may explain why the percentage of those aged 18 to 64 not in the labor force due to a disability has stalled over the past two years rather than continuing its pre-pandemic decline (see also Price, 2022). Return to text
6. See Montes, Smith, and Dajon (2022). Return to text
7. This analysis adjusts for population controls to the Current Population Survey. This adjustment is important, because while the unadjusted data show a marked decline in the retired share in January 2022, this drop is entirely an artifact of new population controls introduced in January. A proper assessment of the effects of retirements since the start of the pandemic needs to adjust the historical data for the effects of these population controls. See Montes, Smith, and Dajon (2022). Return to text
8. For example, see Goda and Soltas (2022). Return to text
9. Displaced workers aged 65 and over had markedly lower reemployment rates and markedly higher rates of labor force exit than did similarly aged displaced workers in the years just before the pandemic. See Bureau of Labor Statistics (2022). Return to text
10. Among those 55 and over, transitions into retirement are currently well above the average rate in the three years before the pandemic (after adjusting for population controls). At the same time, retirees are returning to the labor force at a rate similar to that before the pandemic. Return to text
11. First, due primarily to COVID, mortality over the past few years has far exceeded what had been expected before the pandemic. This channel accounts for about 400,000 of the labor force shortfall. Total deaths due to COVID are much larger—about 1 million people. However, the effect on the labor force is smaller than this because COVID deaths have mostly been among older people, who participate in the labor force at lower rates than younger people.
Second, due, at least in part, to pandemic-related restrictions on entry into the United States, total immigration has slowed substantially since the start of the pandemic, lowering the labor force by about 1 million people relative to pre-pandemic trends. While lawful, nonpermanent immigration (for example, H-1B and H-2B visa holders) has bounced back considerably since earlier in the pandemic, these categories of immigration are generally still below 2019 levels. Meanwhile, lawful permanent immigration (that is, new green card holders) is also somewhat lower than in 2019 and well below levels that prevailed earlier in the 2010s. Regarding undocumented immigration, while migrant encounters at the U.S.–Mexico border have been high lately, some estimates suggest the number of undocumented immigrants in the United States is not much different than in 2019. (For data on legal immigration, see U.S. Department of Homeland Security, 2022; for data on border encounters, see U.S. Customs and Border Protection, 2022; for estimates of the number of undocumented immigrants, see Camarota and Zeigler, 2022.). Return to text
i. Note: On December 2, 2022, a typo was corrected to change the month labels on Figure 3.