National Payment Volumes, Top-Line Data (CY 2015-24)
The 2025 Federal Reserve Payments Study (FRPS) collected data for the 2024 calendar year. This initial release includes top-line figures for the core noncash payment methods used in the United States by consumers, businesses, and governments, including payments by general-purpose and private-label cards, automated clearinghouse (ACH) transfers, and checks. This release also covers ATM cash withdrawals. Wire transfers, used primarily for large financial transactions, are excluded from these data. Additional details about the 2024 results will be available in future releases.
More information about the FRPS is available here.
Key Findings
- Total noncash payments grew substantially, marking the largest three-year increase since the FRPS began estimating U.S. noncash payment volumes in 2000. The total number of noncash payments rose to 236.6 billion in 2024, an increase of 31.9 billion from 2021, driven primarily by card payments. Core noncash payments have more than doubled since 2009 and more than tripled since 2000. Despite the record absolute increase, the 4.9 percent annual growth rate from 2021 to 2024 was slightly lower than in the two preceding three-year periods.
- Total noncash payment value grew at one-quarter the growth rate experienced in the previous three-year period. The total value of noncash payments rose to $140.01 trillion in 2024, up $10.37 trillion from 2021. The annual growth rate in total value was 2.6 percent from 2021 to 2024 – considerably lower than the 10.4 percent growth from 2018 to 2021, and also lower than the 3.8 percent annual growth rate from 2000 to 2021.
- Cards continued to dominate noncash payments by number, comprising nearly four-fifths of all transactions in 2024. Cards' share of noncash payments reached 79 percent in 2024, up from 77 percent in 2021 and 71 percent in 2015. By contrast, cards' share of total value of noncash payments was 8 percent in 2024 – up only slightly from earlier years.
- Growth in the number of debit card payments slowed sharply to the lowest level in any measured three-year period since 2000. In 2024, debit card payments reached 120.6 billion, up 13.8 billion from 2021. The 4.1 percent annual growth rate from 2021 to 2024 was not just lower than the 7.2 percent rate from 2018 to 2021, but also less than a third of the 12.9 percent annual growth rate from 2000 to 2021.
- Debit cards continued to account for the majority of all card payments, despite slower overall growth. Debit cards accounted for 64 percent of all card payments in 2024 by number, down from 68 percent in 2021. The decline in growth reflects slower growth both for non-prepaid cards associated with checking accounts, which represented 82 percent of debit card payments in 2024, and for prepaid debit cards overall. Among prepaid debit cards, while general-purpose and private-label prepaid debit card payments grew substantially from 2021 to 2024, the number of electronic benefits transfer card payments declined by 16.9 percent per year over the same period.
- Credit cards grew the most by number among all payment types, marking the first measured three-year period since 2000 that credit card payments grew more than debit card payments. Credit card payments increased to 67.1 billion in 2024, up 16.2 billion from 2021. General-purpose credit cards were the main source of growth, with their share of all credit card payments reaching 96 percent in 2024 by number, up from 92 percent in 2015. By contrast, private-label credit card payments declined by number to 2.9 billion in 2024, down from a peak of 3.7 billion in 2018.
- ACH payments continued to dominate noncash payments by value, although growth slowed relative to recent periods. Total ACH payments increased to $104.06 trillion in 2024, up $10.23 trillion from 2021, resulting in ACH's share of total noncash payments by value increasing from 72 to 74 percent over the three-year period. Annual growth rates were 3.5 percent by value and 3.3 percent by number, substantially lower than in the two previous three-year periods.
- ACH debit transfers grew faster than ACH credit transfers, although the latter still account for almost two-thirds of ACH payments by value. The number and value of ACH debit transfers grew by 5.4 and 5.6 percent per year, respectively, from 2021 to 2024 faster than the corresponding growth of 0.7 and 2.4 percent for ACH credit transfers. Since 2000, ACH credit transfers' share of all ACH payments by value increased from 48 to 65 percent, while the average value of ACH credit transfers almost doubled from $2,195 to $3,881.
- Checks continued their long, steady decline, as well as their gradual shift towards higher-value payments. Check payments fell to 9.2 billion by number and $24.45 trillion by value in 2024, down 1.8 billion and $1.92 trillion from 2021, respectively. By 2024, checks fell to 4 and 17 percent of noncash payments by number and value, respectively, down from 59 and 67 percent in 2000. At the same time, the average value of check payments increased almost threefold, from $945 in 2000 to $2,653 in 2024.
- The number of ATM cash withdrawals continued to fall, while their average value reached a new high. ATM withdrawals fell to 3.4 billion in 2024, down from 5.2 billion in 2015. Over this period, the value of the average ATM withdrawal increased substantially, from $134 in 2015 to $210 in 2024.
Table 1. Noncash payments, 2015, 2018, 2021, and 2024 (Excel)
| Noncash payment type | 2015 | 2018 | 2021 | 2024 | CAGR (Percent) | |||||||||||||
|---|---|---|---|---|---|---|---|---|---|---|---|---|---|---|---|---|---|---|
| Number (billions) |
Value ($ trillions) |
Average ($) |
Number (billions) |
Value ($ trillions) |
Average ($) |
Number (billions) |
Value ($ trillions) |
Average ($) |
Number (billions) |
Value ($ trillions) |
Average ($) |
2015-18 | 2018-21 | 2021-24 | ||||
| Number | Value | Number | Value | Number | Value | |||||||||||||
| Total | 142.4 | 83.99 | 590 | 172.6 | 96.26 | 558 | 204.8 | 129.63 | 633 | 236.6 | 140.01 | 592 | 6.6 | 4.7 | 5.9 | 10.4 | 4.9 | 2.6 |
| Cards | 101.5 | 5.52 | 54 | 131.2 | 7.07 | 54 | 157.7 | 9.43 | 60 | 187.7 | 11.50 | 61 | 8.9 | 8.6 | 6.3 | 10.1 | 6.0 | 6.8 |
| Debit cards | 67.8 | 2.47 | 36 | 86.6 | 3.10 | 36 | 106.7 | 4.56 | 43 | 120.6 | 4.99 | 41 | 8.5 | 7.9 | 7.2 | 13.7 | 4.1 | 3.1 |
| Non-prepaid | 56.6 | 2.18 | 38 | 72.7 | 2.75 | 38 | 87.8 | 3.94 | 45 | 99.3 | 4.34 | 44 | 8.7 | 8.1 | 6.5 | 12.7 | 4.2 | 3.3 |
| Prepaid | 11.2 | 0.29 | 26 | 13.9 | 0.35 | 25 | 18.9 | 0.62 | 33 | 21.3 | 0.65 | 31 | 7.4 | 6.4 | 10.8 | 20.8 | 4.0 | 1.5 |
| General purpose | 4.3 | 0.15 | 35 | 6.0 | 0.19 | 32 | 9.0 | 0.38 | 42 | 11.8 | 0.43 | 36 | 12.3 | 8.7 | 14.2 | 25.4 | 9.7 | 4.3 |
| Private label | 4.4 | 0.07 | 16 | 5.6 | 0.10 | 18 | 5.2 | 0.08 | 16 | 6.7 | 0.11 | 17 | 8.4 | 13.0 | -2.3 | -6.4 | 9.0 | 11.5 |
| Electronic benefits transfer (EBT) | 2.6 | 0.08 | 29 | 2.3 | 0.06 | 27 | 4.8 | 0.16 | 35 | 2.7 | 0.11 | 40 | -3.7 | -6.1 | 26.9 | 38.3 | -16.9 | -12.5 |
| Credit cards | 33.7 | 3.05 | 91 | 44.6 | 3.97 | 89 | 51.0 | 4.87 | 96 | 67.1 | 6.51 | 97 | 9.8 | 9.2 | 4.5 | 7.0 | 9.6 | 10.1 |
| General purpose | 31.0 | 2.80 | 90 | 40.9 | 3.64 | 89 | 47.8 | 4.52 | 95 | 64.3 | 6.17 | 96 | 9.7 | 9.1 | 5.3 | 7.5 | 10.4 | 10.9 |
| Private label | 2.7 | 0.25 | 93 | 3.7 | 0.33 | 90 | 3.1 | 0.35 | 110 | 2.9 | 0.34 | 118 | 11.1 | 9.8 | -5.0 | 1.7 | -3.1 | -0.9 |
| Automated clearinghouse (ACH) | 23.9 | 52.42 | 2,195 | 28.0 | 64.17 | 2,293 | 36.0 | 93.83 | 2,604 | 39.7 | 104.06 | 2,622 | 5.4 | 7.0 | 8.8 | 13.5 | 3.3 | 3.5 |
| Credit transfers | 10.2 | 33.13 | 3,254 | 12.2 | 42.04 | 3,442 | 16.9 | 62.56 | 3,691 | 17.3 | 67.26 | 3,881 | 6.2 | 8.3 | 11.5 | 14.2 | 0.7 | 2.4 |
| Debit transfers | 13.7 | 19.29 | 1,407 | 15.8 | 22.13 | 1,403 | 19.1 | 31.28 | 1,639 | 22.4 | 36.80 | 1,647 | 4.8 | 4.7 | 6.6 | 12.2 | 5.4 | 5.6 |
| Network | 19.3 | 41.64 | 2,159 | 22.9 | 51.25 | 2,234 | 29.1 | 72.62 | 2,497 | 33.5 | 86.18 | 2,570 | 6.0 | 7.2 | 8.2 | 12.3 | 4.9 | 5.9 |
| Credit transfers | 8.0 | 26.78 | 3,333 | 9.5 | 33.42 | 3,512 | 12.7 | 47.25 | 3,714 | 14.7 | 56.85 | 3,861 | 5.8 | 7.7 | 10.2 | 12.2 | 5.0 | 6.4 |
| Debit transfers | 11.3 | 14.86 | 1,321 | 13.4 | 17.83 | 1,328 | 16.4 | 25.37 | 1,551 | 18.8 | 29.33 | 1,560 | 6.1 | 6.3 | 6.8 | 12.5 | 4.8 | 5.0 |
| On-us | 4.6 | 10.78 | 2,344 | 5.0 | 12.91 | 2,565 | 6.9 | 21.21 | 3,053 | 6.2 | 17.88 | 2,907 | 3.1 | 6.2 | 11.3 | 18.0 | -4.0 | -5.5 |
| Credit transfers | 2.1 | 6.36 | 2,960 | 2.7 | 8.62 | 3,198 | 4.2 | 15.30 | 3,621 | 2.6 | 10.41 | 3,995 | 7.9 | 10.7 | 16.2 | 21.1 | -14.9 | -12.0 |
| Debit transfers | 2.5 | 4.42 | 1,804 | 2.3 | 4.29 | 1,835 | 2.7 | 5.91 | 2,170 | 3.5 | 7.47 | 2,107 | -1.6 | -1.0 | 5.2 | 11.2 | 9.2 | 8.1 |
| Checks | 17.0 | 26.05 | 1,533 | 13.5 | 25.02 | 1,854 | 11.0 | 26.37 | 2,386 | 9.2 | 24.45 | 2,653 | -7.4 | -1.3 | -6.5 | 1.8 | -5.9 | -2.5 |
| Interbank | 12.7 | 18.22 | 1,430 | 9.8 | 17.66 | 1,805 | 8.4 | 18.98 | 2,268 | 7.1 | 18.13 | 2,568 | -8.4 | -1.0 | -5.1 | 2.4 | -5.5 | -1.5 |
| On-us | 4.2 | 7.83 | 1,843 | 3.7 | 7.36 | 1,983 | 2.7 | 7.39 | 2,756 | 2.2 | 6.32 | 2,935 | -4.4 | -2.0 | -10.3 | 0.1 | -7.1 | -5.1 |
| Additional estimates | ||||||||||||||||||
| Checks written | 19.1 | 26.55 | 1,392 | 15.0 | 25.42 | 1,693 | 11.9 | 26.66 | 2,232 | 9.7 | 24.72 | 2,544 | -7.7 | -1.4 | -7.3 | 1.6 | -6.7 | -2.5 |
| Checks converted to ACH | 2.1 | 0.50 | 238 | 1.5 | 0.40 | 263 | 0.9 | 0.29 | 328 | 0.5 | 0.28 | 549 | -9.9 | -6.8 | -16.2 | -9.8 | -17.5 | -2.1 |
| ATM cash withdrawals | 5.2 | 0.70 | 134 | 4.7 | 0.72 | 155 | 3.8 | 0.76 | 202 | 3.4 | 0.72 | 210 | -3.7 | 1.1 | -7.0 | 1.6 | -3.2 | -2.0 |
Note: General-purpose card figures are defined as net, authorized, and settled. Figures may not sum because of rounding. CAGR is compound annual growth rate. Checks written is the sum of "Checks" and "Checks converted to ACH" which uses the check as a source document to initiate the ACH payment.
Figure 1. Trends in noncash payments, by value, 2000–24
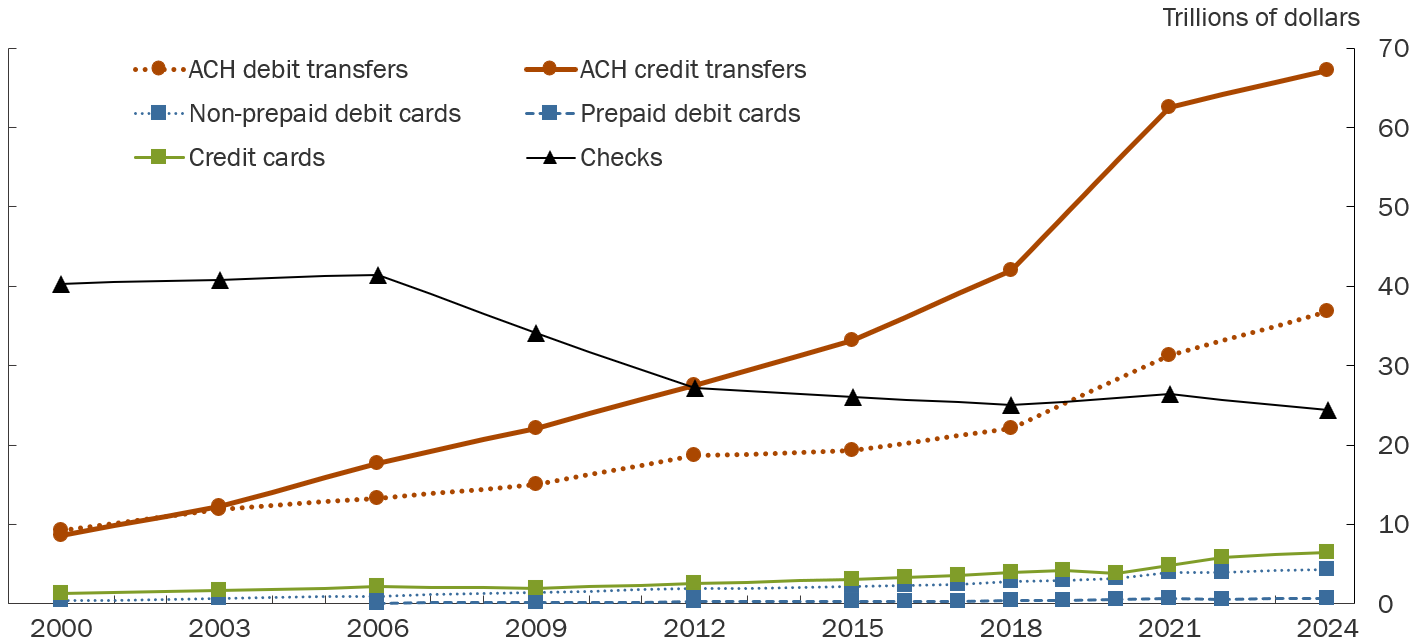
Note: Markers indicate years for which data were collected and estimates were produced; lines connecting markers are linear interpolations. Credit cards include general-purpose and private-label cards. Prepaid debit cards include general-purpose, private-label, and electronic benefits transfer (EBT) cards.
Source: Depository and Financial Institutions Payments Survey (DFIPS), Networks, Processors, and Issuers Payments Surveys (NPIPS).
Figure 2. Trends in noncash payments, by number, 2000–24
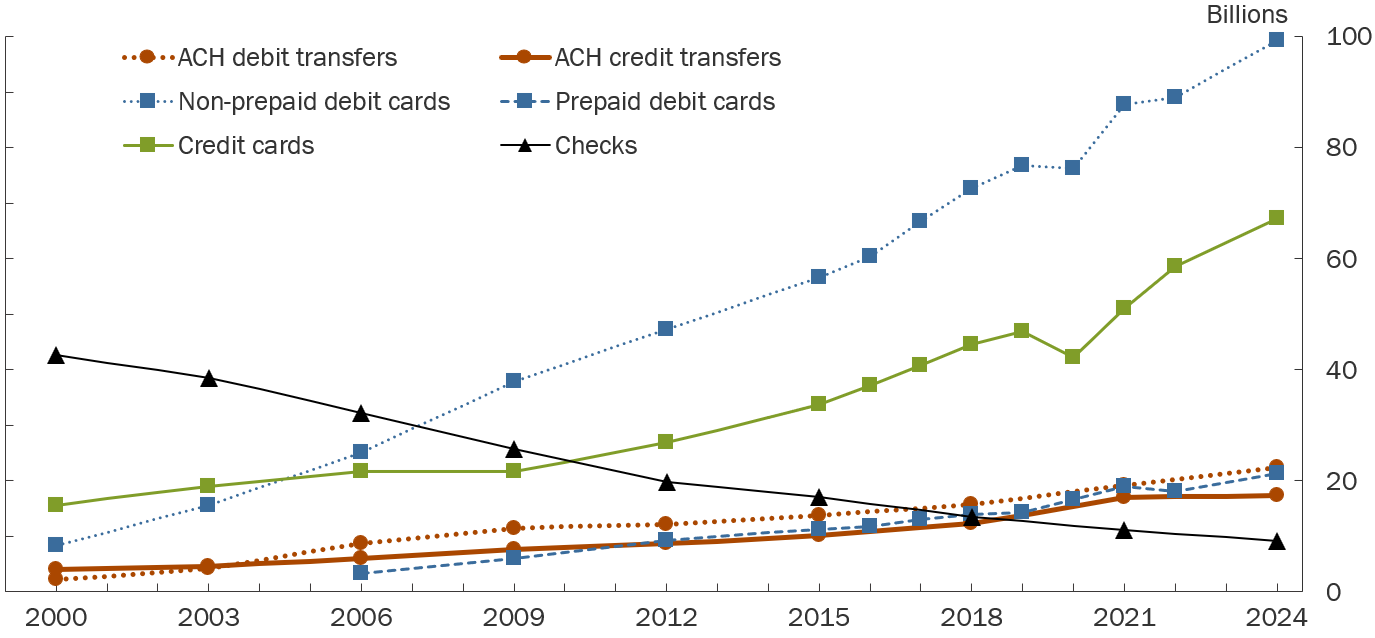
Note: Markers indicate years for which data were collected and estimates were produced; lines connecting markers are linear interpolations. Credit cards include general-purpose and private-label cards. Prepaid debit cards include general-purpose, private-label, and electronic benefits transfer (EBT) cards.
Source: Depository and Financial Institutions Payments Survey (DFIPS), Networks, Processors, and Issuers Payments Surveys (NPIPS).
Contact
For questions, comments, or to be added to the FRPS mailing list, please contact: [email protected].