Payment Volumes for Top 100 DIs, DFIPS (CY 2015–22)
Released March 2026
Figures
| Figure 1. Top 100 Value | Trends in noncash payments for Top 100 DIs, by value, 2015-22 |
|---|---|
| Figure 2. Top 100 Number | Trends in noncash payments for Top 100 DIs, by number, 2015-22 |
| Figure 3. Top 100 & Total Value | Trends in noncash payments, by value, Top 100 and Total, 2015-21 |
| Figure 4. Top 100 & Total Number | Trends in noncash payments, by number, Top 100 and Total, 2015-21 |
Tables
| Tables 1, 2. Accounts | Transaction deposit accounts and sweep program accounts at depository institutions |
|---|---|
| Tables 3, 4. Checks | Commercial checks paid and checks deposited |
| Tables 5, 6. ACH Transfers | Commercial Automated Clearinghouse credit and debit transfers |
| Tables 7, 8. Wire Transfers | Wires sent or received over large-value funds transfer and internal book-entry systems |
| Tables 9, 10. Alt Payments | Consumer bill and person-to-person payments via a depository institution-sponsored website or app irrespective of settlement mechanism |
Notes
- There are two tables for Accounts as well as for each payment type. The first table contains annual estimates for the Top 100 DIs. The second table contains national estimates (“Total”) as well as a breakdown into Top 100 DIs and All Other DIs subcategories, for the years when FRPS estimated national payment volumes.
- Balances, values, and averages are reported in U.S. dollars.
- Cells left blank or entered as ND in the data tables indicate data is not reported.
Acronyms
| ACH | Automated Clearinghouse |
|---|---|
| CAGR | Compound annual growth rate |
| DFIPS | Depository and Financial Institutions Payments Survey |
| DI | Depository institution |
| P2P | Person-to-person |
For more information, see the Notes on the Top 100 Data.
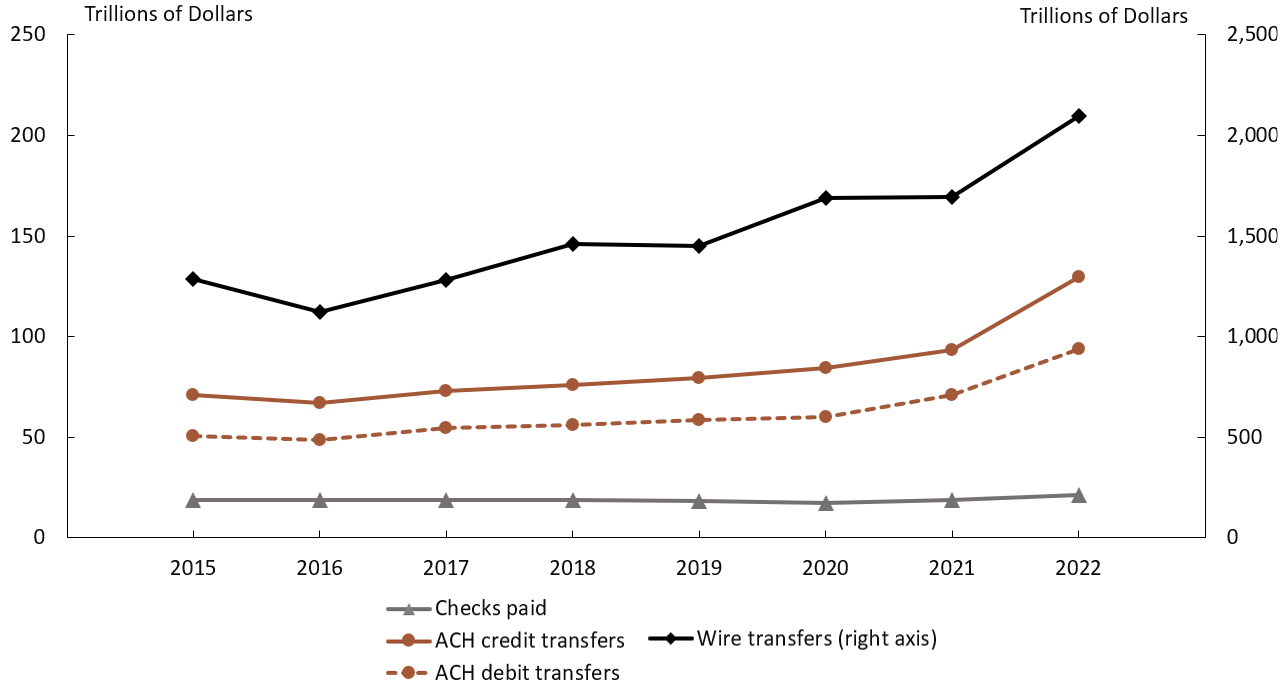
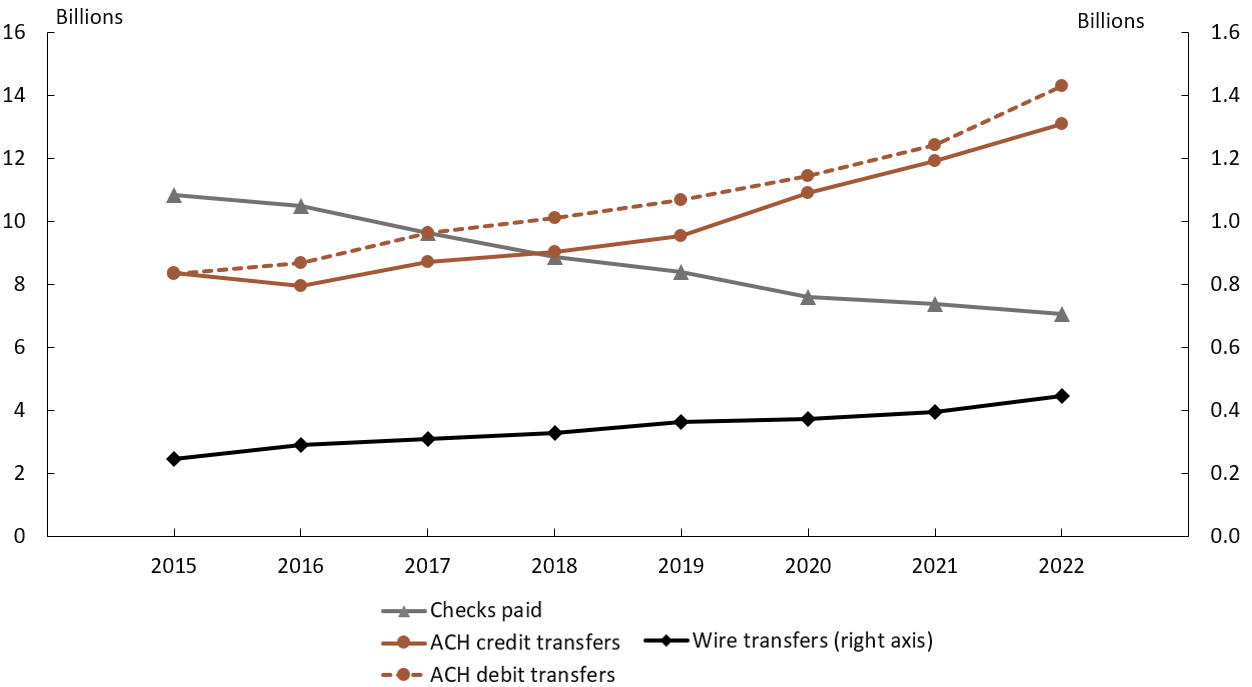
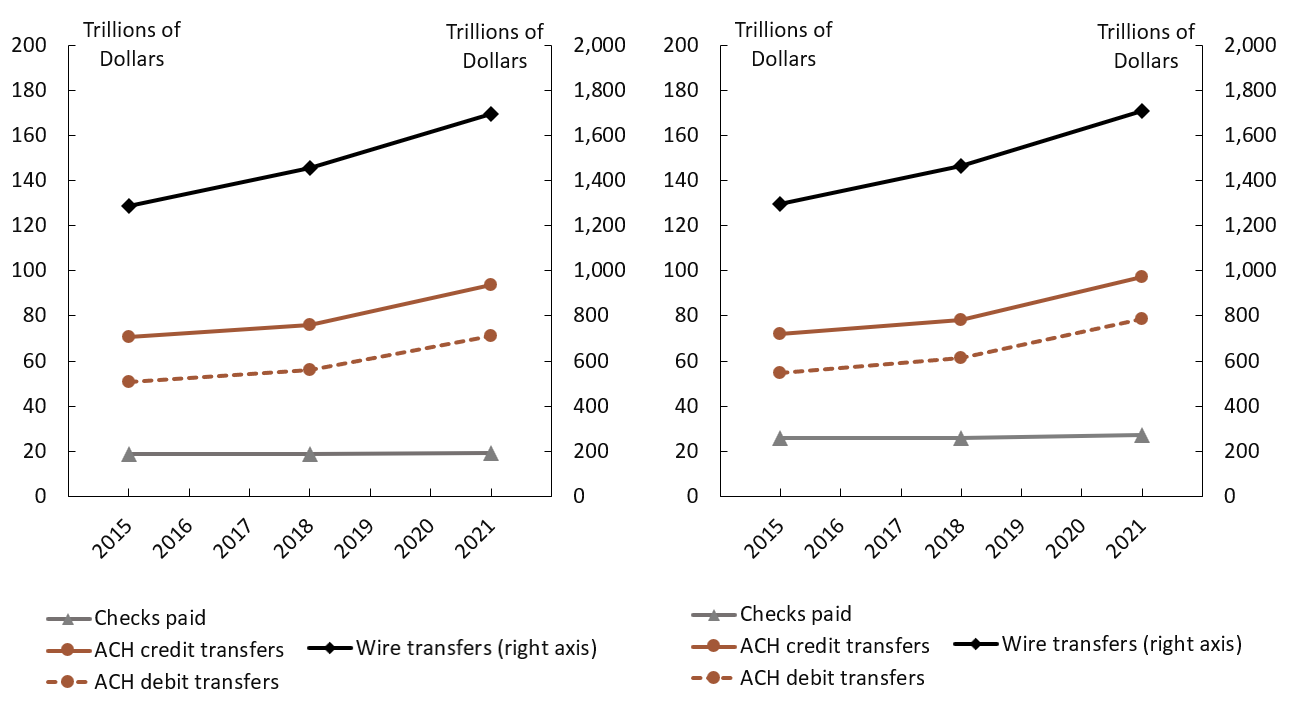
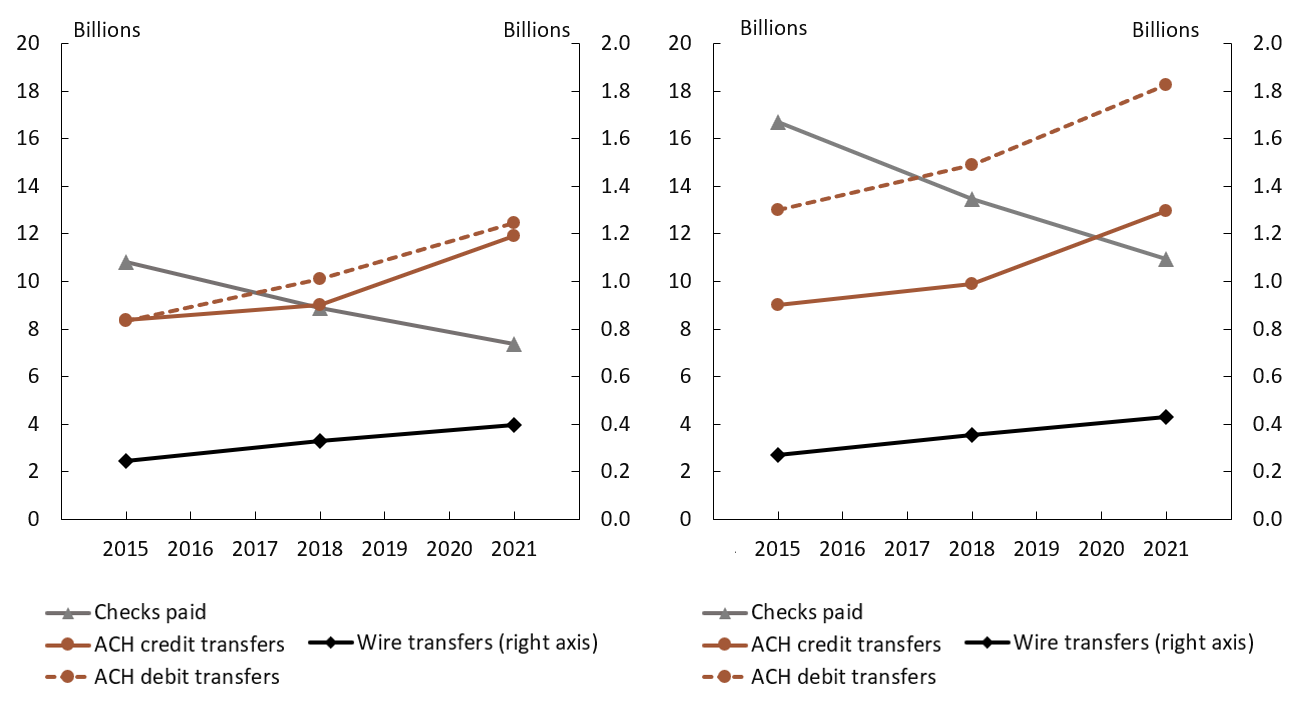
Table 1. Top 100 Accounts, 2015-22
| Depository and Financial Institutions Payments Survey (DFIPS) | 2015 | 2016 | 2017 | 2018 | 2019 | 2020 | 2021 | 2022 | CAGR (percent) | |||||||||||||||||||
|---|---|---|---|---|---|---|---|---|---|---|---|---|---|---|---|---|---|---|---|---|---|---|---|---|---|---|---|---|
| Number (millions) |
Balance ($ trillions) |
Average ($) |
Number (millions) |
Balance ($ trillions) |
Average ($) |
Number (millions) |
Balance ($ trillions) |
Average ($) |
Number (millions) |
Balance ($ trillions) |
Average ($) |
Number (millions) |
Balance ($ trillions) |
Average ($) |
Number (millions) |
Balance ($ trillions) |
Average ($) |
Number (millions) |
Balance ($ trillions) |
Average ($) |
Number (millions) |
Balance ($ trillions) |
Average ($) |
2015-18 | 2018-21 | |||
| Number | Balance | Number | Balance | |||||||||||||||||||||||||
| Transaction deposit accounts | 223.9 | 2.85 | 12,710 | 214.8 | 3.39 | 15,785 | 226.3 | 3.82 | 16,861 | 215.8 | 3.49 | 16,183 | 213.1 | 3.60 | 16,885 | 235.0 | 3.81 | 16,197 | 238.1 | 5.09 | 21,373 | 249.9 | 5.50 | 22,027 | -1.2 | 7.1 | 3.3 | 13.4 |
| Consumer | 201.5 | 1.24 | 6,158 | 189.2 | 1.38 | 7,299 | 201.5 | 1.47 | 7,291 | 192.6 | 1.42 | 7,398 | 191.2 | 1.39 | 7,278 | 210.3 | 1.17 | 5,575 | 211.9 | 1.76 | 8,325 | 219.8 | 1.96 | 8,906 | -1.5 | 4.7 | 3.2 | 7.4 |
| Business | 22.4 | 1.61 | 71,636 | 25.6 | 2.01 | 78,447 | 24.8 | 2.35 | 94,463 | 23.2 | 2.07 | 89,105 | 22.0 | 2.21 | 100,432 | 24.6 | 2.63 | 106,845 | 26.2 | 3.32 | 127,004 | 30.1 | 3.55 | 117,672 | 1.2 | 8.8 | 4.1 | 17.2 |
| Retail sweep program accounts | 114.1 | 1.83 | 16,028 | 142.0 | 1.82 | 12,820 | 187.7 | 2.18 | 11,632 | 230.1 | 2.40 | 10,435 | 136.2 | 1.92 | 14,083 | 142.8 | 2.51 | 17,544 | 174.2 | 3.68 | 21,129 | 232.2 | 3.54 | 15,234 | 26.4 | 9.5 | -8.9 | 15.3 |
| Consumer | 103.7 | 1.38 | 13,320 | 116.1 | 1.26 | 10,884 | 149.9 | 1.45 | 9,648 | 217.1 | 1.29 | 5,947 | 101.5 | 1.51 | 14,832 | 103.3 | 1.78 | 17,253 | 158.8 | 1.98 | 12,489 | 178.2 | 2.50 | 14,052 | 27.9 | -2.2 | -9.9 | 15.4 |
| Business | 10.4 | 0.45 | 43,127 | 26.0 | 0.56 | 21,468 | 37.8 | 0.74 | 19,492 | 13.0 | 1.11 | 85,361 | 34.6 | 0.41 | 11,889 | 39.5 | 0.72 | 18,306 | 15.4 | 1.70 | 110,274 | 54.0 | 1.03 | 19,135 | 7.9 | 35.4 | 5.8 | 15.2 |
| Wholesale sweep program accounts | 0.1 | 0.48 | 9,012,182 | 0.0 | 0.18 | 3,974,672 | 0.0 | 0.22 | 5,130,159 | 0.1 | 0.19 | 2,657,066 | 0.0 | 0.18 | 4,813,974 | 0.0 | 0.18 | 3,712,032 | 0.0 | 0.18 | 5,052,437 | 0.1 | 0.21 | 2,979,048 | 11.2 | -26.0 | -21.5 | -2.8 |
Table 2. Accounts, 2015-21
| Depository and Financial Institutions Payments Survey (DFIPS) | 2015 | 2018 | 2021 | CAGR (percent) | |||||||||
|---|---|---|---|---|---|---|---|---|---|---|---|---|---|
| Number (millions) |
Balance ($ trillions) |
Average ($) |
Number (millions) |
Balance ($ trillions) |
Average ($) |
Number (millions) |
Balance ($ trillions) |
Average ($) |
2015-18 | 2018-21 | |||
| Number | Balance | Number | Balance | ||||||||||
| Total | |||||||||||||
| Transaction deposit accounts | 350.4 | 4.06 | 11,584 | 353.9 | 4.81 | 13,602 | 374.1 | 7.48 | 20,002 | 0.3 | 5.8 | 1.9 | 15.8 |
| Consumer | 314.2 | 1.92 | 6,115 | 316.0 | 2.11 | 6,673 | 330.7 | 2.92 | 8,828 | 0.2 | 3.2 | 1.5 | 11.5 |
| Business | 36.2 | 2.14 | 59,069 | 37.9 | 2.70 | 71,389 | 43.4 | 4.56 | 105,074 | 1.5 | 8.2 | 4.7 | 19.0 |
| Retail sweep program accounts | 153.8 | 2.11 | 13,711 | 268.7 | 3.01 | 11,192 | 217.6 | 3.85 | 17,697 | 20.4 | 12.6 | -6.8 | 8.6 |
| Consumer | 141.5 | 1.54 | 10,907 | 248.6 | 1.53 | 6,167 | 200.4 | 2.08 | 10,376 | 20.7 | -0.2 | -6.9 | 10.7 |
| Business | 12.3 | 0.57 | 45,946 | 20.1 | 1.47 | 73,303 | 17.2 | 1.77 | 102,917 | 17.8 | 37.6 | -5.0 | 6.3 |
| Wholesale sweep program accounts | 0.1 | 0.56 | 4,448,449 | 0.1 | 0.28 | 2,330,035 | 0.1 | 0.37 | 4,088,519 | -1.0 | -20.2 | -9.3 | 9.4 |
| Top 100 | |||||||||||||
| Transaction deposit accounts | 223.9 | 2.85 | 12,710 | 215.8 | 3.49 | 16,183 | 238.1 | 5.09 | 21,373 | -1.2 | 7.1 | 3.3 | 13.4 |
| Consumer | 201.5 | 1.24 | 6,158 | 192.6 | 1.42 | 7,398 | 211.9 | 1.76 | 8,325 | -1.5 | 4.7 | 3.2 | 7.4 |
| Business | 22.4 | 1.61 | 71,636 | 23.2 | 2.07 | 89,105 | 26.2 | 3.32 | 127,004 | 1.2 | 8.8 | 4.1 | 17.2 |
| Retail sweep program accounts | 114.1 | 1.83 | 16,028 | 230.1 | 2.40 | 10,435 | 174.2 | 3.68 | 21,129 | 26.4 | 9.5 | -8.9 | 15.3 |
| Consumer | 103.7 | 1.38 | 13,320 | 217.1 | 1.29 | 5,947 | 158.8 | 1.98 | 12,489 | 27.9 | -2.2 | -9.9 | 15.4 |
| Business | 10.4 | 0.45 | 43,127 | 13.0 | 1.11 | 85,361 | 15.4 | 1.70 | 110,274 | 7.9 | 35.4 | 5.8 | 15.2 |
| Wholesale sweep program accounts | 0.1 | 0.48 | 9,012,182 | 0.1 | 0.19 | 2,657,066 | 0.0 | 0.18 | 5,052,437 | 11.2 | -26.0 | -21.5 | -2.8 |
| All Other | |||||||||||||
| Transaction deposit accounts | 126.4 | 1.21 | 9,590 | 138.1 | 1.32 | 9,569 | 136.0 | 2.39 | 17,603 | 3.0 | 2.9 | -0.5 | 21.9 |
| Consumer | 112.7 | 0.68 | 6,038 | 123.4 | 0.68 | 5,541 | 118.8 | 1.16 | 9,726 | 3.1 | 0.2 | -1.3 | 19.1 |
| Business | 13.8 | 0.53 | 38,631 | 14.7 | 0.64 | 43,405 | 17.3 | 1.24 | 71,811 | 2.2 | 6.2 | 5.5 | 24.8 |
| Retail sweep program accounts | 39.8 | 0.28 | 7,061 | 38.6 | 0.61 | 15,709 | 43.4 | 0.17 | 3,939 | -1.0 | 29.2 | 4.0 | -34.4 |
| Consumer | 37.8 | 0.16 | 4,291 | 31.5 | 0.24 | 7,683 | 41.6 | 0.10 | 2,314 | -5.9 | 14.2 | 9.8 | -26.4 |
| Business | 1.9 | 0.12 | 60,994 | 7.1 | 0.36 | 51,243 | 1.8 | 0.07 | 40,956 | 54.1 | 45.4 | -36.4 | -41.0 |
| Wholesale sweep program accounts | 0.1 | 0.08 | 1,092,617 | 0.0 | 0.09 | 1,839,066 | 0.1 | 0.19 | 3,475,959 | -12.4 | 4.2 | 4.5 | 29.2 |
Table 3. Top 100 Checks, 2015-22
| Depository and Financial Institutions Payments Survey (DFIPS) | 2015 | 2016 | 2017 | 2018 | 2019 | 2020 | 2021 | 2022 | CAGR (Percent) | |||||||||||||||||||
|---|---|---|---|---|---|---|---|---|---|---|---|---|---|---|---|---|---|---|---|---|---|---|---|---|---|---|---|---|
| Number (billions) |
Value ($ trillions) |
Average ($) |
Number (billions) |
Value ($ trillions) |
Average ($) |
Number (billions) |
Value ($ trillions) |
Average ($) |
Number (billions) |
Value ($ trillions) |
Average ($) |
Number (billions) |
Value ($ trillions) |
Average ($) |
Number (billions) |
Value ($ trillions) |
Average ($) |
Number (billions) |
Value ($ trillions) |
Average ($) |
Number (billions) |
Value ($ trillions) |
Average ($) |
2015-18 | 2018-21 | |||
| Number | Value | Number | Value | |||||||||||||||||||||||||
| Commercial checks paid by payer type | 10.8 | 18.89 | 1,743 | 10.5 | 18.96 | 1,805 | 9.7 | 18.63 | 1,930 | 8.9 | 18.64 | 2,099 | 8.4 | 18.46 | 2,201 | 7.6 | 17.57 | 2,310 | 7.4 | 19.10 | 2,585 | 7.1 | 21.15 | 2,987 | -6.4 | -0.4 | -5.9 | 0.8 |
| Consumer | 5.5 | 5.21 | 947 | 5.5 | 5.07 | 922 | ND | ND | ND | 4.2 | 4.45 | 1,071 | 4.1 | 4.58 | 1,129 | 3.2 | 3.66 | 1,157 | 3.2 | 4.13 | 1,289 | 2.6 | 3.83 | 1,490 | -8.9 | -5.1 | -8.3 | -2.5 |
| Business | 5.3 | 13.67 | 2,563 | 5.0 | 13.89 | 2,777 | ND | ND | ND | 4.7 | 14.18 | 3,006 | 4.3 | 13.89 | 3,201 | 4.4 | 13.91 | 3,132 | 4.2 | 14.97 | 3,579 | 4.5 | 17.32 | 3,840 | -4.0 | 1.2 | -3.9 | 1.8 |
| Commercial checks paid by clearing method | 10.8 | 18.89 | 1,743 | 10.5 | 18.96 | 1,805 | 9.7 | 18.63 | 1,930 | 8.9 | 18.64 | 2,099 | 8.4 | 18.46 | 2,201 | 7.6 | 17.57 | 2,310 | 7.4 | 19.10 | 2,585 | 7.1 | 21.15 | 2,987 | -6.4 | -0.4 | -5.9 | 0.8 |
| Interbank | 8.0 | 12.81 | 1,610 | 7.9 | 13.41 | 1,707 | 7.1 | 13.19 | 1,866 | 6.1 | 12.72 | 2,069 | 6.3 | 13.34 | 2,126 | 5.6 | 12.33 | 2,194 | 5.4 | 13.33 | 2,463 | 5.0 | 14.01 | 2,787 | -8.3 | -0.2 | -4.2 | 1.6 |
| On-us | 2.9 | 6.07 | 2,112 | 2.6 | 5.56 | 2,099 | 2.6 | 5.44 | 2,107 | 2.7 | 5.92 | 2,168 | 2.1 | 5.13 | 2,423 | 2.0 | 5.24 | 2,637 | 2.0 | 5.77 | 2,921 | 2.1 | 7.13 | 3,476 | -1.7 | -0.9 | -10.2 | -0.8 |
| Commercial checks paid by clearing method | 10.8 | 18.89 | 1,743 | 10.5 | 18.96 | 1,805 | 9.7 | 18.63 | 1,930 | 8.9 | 18.64 | 2,099 | 8.4 | 18.46 | 2,201 | 7.6 | 17.57 | 2,310 | 7.4 | 19.10 | 2,585 | 7.1 | 21.15 | 2,987 | -6.4 | -0.4 | -5.9 | 0.8 |
| Interbank | 8.0 | 12.81 | 1,610 | 7.9 | 13.41 | 1,707 | 7.1 | 13.19 | 1,866 | 6.1 | 12.72 | 2,069 | 6.3 | 13.34 | 2,126 | 5.6 | 12.33 | 2,194 | 5.4 | 13.33 | 2,463 | 5.0 | 14.01 | 2,787 | -8.3 | -0.2 | -4.2 | 1.6 |
| Inclearings | 7.3 | 11.97 | 1,642 | ND | ND | ND | ND | ND | ND | 5.9 | 12.34 | 2,087 | ND | ND | ND | ND | ND | ND | 5.0 | 12.56 | 2,510 | ND | ND | ND | -6.7 | 1.0 | -5.4 | 0.6 |
| On-us correspondent | 0.7 | 0.85 | 1,256 | ND | ND | ND | ND | ND | ND | 0.2 | 0.38 | 1,616 | ND | ND | ND | ND | ND | ND | 0.4 | 0.77 | 1,883 | ND | ND | ND | -29.4 | -23.2 | 19.7 | 25.9 |
| On-us | 2.9 | 6.07 | 2,112 | 2.6 | 5.56 | 2,099 | 2.6 | 5.44 | 2,107 | 2.7 | 5.92 | 2,168 | 2.1 | 5.13 | 2,423 | 2.0 | 5.24 | 2,637 | 2.0 | 5.77 | 2,921 | 2.1 | 7.13 | 3,476 | -1.7 | -0.9 | -10.2 | -0.8 |
| Checks deposited | 15.7 | 25.15 | 1,605 | ND | ND | ND | ND | ND | ND | 15.1 | 28.45 | 1,880 | ND | ND | ND | 12.5 | 27.15 | 2,170 | 11.3 | 27.75 | 2,458 | 12.1 | 28.92 | 2,397 | -1.1 | 4.2 | -9.3 | -0.8 |
| Consumer and business | 10.8 | 19.55 | 1,809 | ND | ND | ND | ND | ND | ND | ND | ND | ND | ND | ND | ND | ND | ND | ND | 7.8 | 20.14 | 2,592 | ND | ND | ND | ND | ND | ND | ND |
| Image | 2.7 | 5.51 | 2,017 | ND | ND | ND | ND | ND | ND | ND | ND | ND | ND | ND | ND | ND | ND | ND | 4.1 | 9.71 | 2,355 | ND | ND | ND | ND | ND | ND | ND |
| Other | 8.1 | 14.04 | 1,738 | ND | ND | ND | ND | ND | ND | ND | ND | ND | ND | ND | ND | ND | ND | ND | 3.6 | 10.43 | 2,860 | ND | ND | ND | ND | ND | ND | ND |
| Correspondent | 4.9 | 5.60 | 1,153 | ND | ND | ND | ND | ND | ND | ND | ND | ND | ND | ND | ND | ND | ND | ND | 3.5 | 7.61 | 2,161 | ND | ND | ND | ND | ND | ND | ND |
Table 4. Checks, 2015-21
| Depository and Financial Institutions Payments Survey (DFIPS) | 2015 | 2018 | 2021 | CAGR (Percent) | |||||||||
|---|---|---|---|---|---|---|---|---|---|---|---|---|---|
| Number (billions) |
Value ($ trillions) |
Average ($) |
Number (billions) |
Value ($ trillions) |
Average ($) |
Number (billions) |
Value ($ trillions) |
Average ($) |
2015-18 | 2018-21 | |||
| Number | Value | Number | Value | ||||||||||
| Total | |||||||||||||
| Commercial checks paid by payer type | 16.7 | 25.92 | 1,551 | 13.5 | 25.91 | 1,924 | 10.9 | 27.14 | 2,482 | -6.9 | 0.0 | -6.7 | 1.6 |
| Consumer | 9.1 | 7.45 | 816 | 7.0 | 6.86 | 983 | 5.2 | 6.50 | 1,249 | -8.6 | -2.7 | -9.3 | -1.8 |
| Business | 7.6 | 18.46 | 2,438 | 6.5 | 19.05 | 2,938 | 5.7 | 20.64 | 3,601 | -5.0 | 1.0 | -4.0 | 2.7 |
| Commerical checks paid by clearing method | 16.7 | 25.92 | 1,551 | 13.5 | 25.91 | 1,924 | 10.9 | 27.14 | 2,482 | -6.9 | 0.0 | -6.7 | 1.6 |
| Interbank | 12.5 | 18.09 | 1,447 | 9.7 | 18.45 | 1,898 | 8.2 | 19.58 | 2,398 | -8.0 | 0.7 | -5.7 | 2.0 |
| On-us | 4.2 | 7.83 | 1,862 | 3.7 | 7.46 | 1,993 | 2.8 | 7.56 | 2,731 | -3.8 | -1.6 | -9.6 | 0.5 |
| Commercial checks paid by clearing method | 16.7 | 25.92 | 1,551 | 13.5 | 25.91 | 1,924 | 10.9 | 27.14 | 2,482 | -6.9 | 0.0 | -6.7 | 1.6 |
| Interbank | 12.5 | 18.09 | 1,447 | 9.7 | 18.45 | 1,898 | 8.2 | 19.58 | 2,398 | -8.0 | 0.7 | -5.7 | 2.0 |
| Inclearings | 11.2 | 17.10 | 1,526 | 8.9 | 17.93 | 2,010 | 7.1 | 18.30 | 2,573 | -7.3 | 1.6 | -7.3 | 0.7 |
| On-us correspondent | 1.3 | 0.99 | 790 | 0.8 | 0.54 | 694 | 1.0 | 1.23 | 1,191 | -14.6 | -18.2 | 9.9 | 31.6 |
| On-us | 4.2 | 7.83 | 1,862 | 3.7 | 7.46 | 1,993 | 2.8 | 7.56 | 2,731 | -3.8 | -1.6 | -9.6 | 0.5 |
| Checks deposited | 20.0 | 31.49 | 1,578 | 20.1 | 37.25 | 1,857 | 14.6 | 35.80 | 2,450 | 0.2 | 5.8 | -10.0 | -1.3 |
| Consumer and business | 14.7 | 25.76 | 1,757 | ND | ND | ND | 10.6 | 27.23 | 2,576 | ND | ND | ND | ND |
| Image | 3.3 | 6.59 | 2,004 | ND | ND | ND | 5.5 | 13.12 | 2,364 | ND | ND | ND | ND |
| Other | 11.4 | 19.17 | 1,686 | ND | ND | ND | 5.0 | 14.11 | 2,811 | ND | ND | ND | ND |
| Correspondent | 5.3 | 5.71 | 1,082 | ND | ND | ND | 4.0 | 8.54 | 2,123 | ND | ND | ND | ND |
| Top 100 | |||||||||||||
| Commercial checks paid by payer type | 10.8 | 18.89 | 1,743 | 8.9 | 18.64 | 2,099 | 7.4 | 19.10 | 2,585 | -6.4 | -0.4 | -5.9 | 0.8 |
| Consumer | 5.5 | 5.21 | 947 | 4.2 | 4.45 | 1,071 | 3.2 | 4.13 | 1,289 | -8.9 | -5.1 | -8.3 | -2.5 |
| Business | 5.3 | 13.67 | 2,563 | 4.7 | 14.18 | 3,006 | 4.2 | 14.97 | 3,579 | -4.0 | 1.2 | -3.9 | 1.8 |
| Commercial checks paid by clearing method | 10.8 | 18.89 | 1,743 | 8.9 | 18.64 | 2,099 | 7.4 | 19.10 | 2,585 | -6.4 | -0.4 | -5.9 | 0.8 |
| Interbank | 8.0 | 12.81 | 1,610 | 6.1 | 12.72 | 2,069 | 5.4 | 13.33 | 2,463 | -8.3 | -0.2 | -4.2 | 1.6 |
| On-us | 2.9 | 6.07 | 2,112 | 2.7 | 5.92 | 2,168 | 2.0 | 5.77 | 2,921 | -1.7 | -0.9 | -10.2 | -0.8 |
| Commercial checks paid by clearing method | 10.8 | 18.89 | 1,743 | 8.9 | 18.64 | 2,099 | 7.4 | 19.10 | 2,585 | -6.4 | -0.4 | -5.9 | 0.8 |
| Interbank | 8.0 | 12.81 | 1,610 | 6.1 | 12.72 | 2,069 | 5.4 | 13.33 | 2,463 | -8.3 | -0.2 | -4.2 | 1.6 |
| Inclearings | 7.3 | 11.97 | 1,642 | 5.9 | 12.34 | 2,087 | 5.0 | 12.56 | 2,510 | -6.7 | 1.0 | -5.4 | 0.6 |
| On-us correspondent | 0.7 | 0.85 | 1,256 | 0.2 | 0.38 | 1,616 | 0.4 | 0.77 | 1,883 | -29.4 | -23.2 | 19.7 | 25.9 |
| On-us | 2.9 | 6.07 | 2,112 | 2.7 | 5.92 | 2,168 | 2.0 | 5.77 | 2,921 | -1.7 | -0.9 | -10.2 | -0.8 |
| Checks deposited | 15.7 | 25.15 | 1,605 | 15.1 | 28.45 | 1,880 | 11.3 | 27.75 | 2,458 | -1.1 | 4.2 | -9.3 | -0.8 |
| Consumer and business | 10.8 | 19.55 | 1,809 | ND | ND | ND | 7.8 | 20.14 | 2,592 | ND | ND | ND | ND |
| Image | 2.7 | 5.51 | 2,017 | ND | ND | ND | 4.1 | 9.71 | 2,355 | ND | ND | ND | ND |
| Other | 8.1 | 14.04 | 1,738 | ND | ND | ND | 3.6 | 10.43 | 2,860 | ND | ND | ND | ND |
| Correspondent | 4.9 | 5.60 | 1,153 | ND | ND | ND | 3.5 | 7.61 | 2,161 | ND | ND | ND | ND |
| All Other | |||||||||||||
| Commercial checks paid by payer type | 5.9 | 7.03 | 1,198 | 4.6 | 7.27 | 1,585 | 3.5 | 8.04 | 2,267 | -7.9 | 1.2 | -8.2 | 3.4 |
| Consumer | 3.6 | 2.24 | 617 | 2.8 | 2.41 | 853 | 2.0 | 2.37 | 1,185 | -8.0 | 2.4 | -10.9 | -0.6 |
| Business | 2.2 | 4.79 | 2,140 | 1.8 | 4.87 | 2,755 | 1.6 | 5.68 | 3,660 | -7.6 | 0.5 | -4.3 | 5.3 |
| Commercial checks paid by clearing method | 5.9 | 7.03 | 1,198 | 4.6 | 7.27 | 1,585 | 3.5 | 8.04 | 2,267 | -7.9 | 1.2 | -8.2 | 3.4 |
| Interbank | 4.5 | 5.27 | 1,162 | 3.6 | 5.73 | 1,602 | 2.8 | 6.25 | 2,270 | -7.6 | 2.8 | -8.3 | 2.9 |
| On-us | 1.3 | 1.75 | 1,321 | 1.0 | 1.54 | 1,522 | 0.8 | 1.79 | 2,257 | -8.6 | -4.2 | -7.8 | 5.1 |
| Commercial checks paid by clearing method | 5.9 | 7.03 | 1,198 | 4.6 | 7.27 | 1,585 | 3.5 | 8.04 | 2,267 | -7.9 | 1.2 | -8.2 | 3.4 |
| Interbank | 4.5 | 5.27 | 1,162 | 3.6 | 5.73 | 1,602 | 2.8 | 6.25 | 2,270 | -7.6 | 2.8 | -8.3 | 2.9 |
| Inclearings | 3.9 | 5.13 | 1,310 | 3.0 | 5.59 | 1,859 | 2.1 | 5.74 | 2,722 | -8.4 | 2.9 | -11.2 | 0.9 |
| On-us correspondent | 0.6 | 0.14 | 246 | 0.5 | 0.16 | 291 | 0.6 | 0.47 | 743 | -2.1 | 3.5 | 5.1 | 43.6 |
| On-us | 1.3 | 1.75 | 1,321 | 1.0 | 1.54 | 1,522 | 0.8 | 1.79 | 2,257 | -8.6 | -4.2 | -7.8 | 5.1 |
| Checks deposited | 4.3 | 6.34 | 1,477 | 4.9 | 8.79 | 1,789 | 3.3 | 8.06 | 2,424 | 4.6 | 11.5 | -12.2 | -2.9 |
| Consumer and business | 3.9 | 6.21 | 1,612 | ND | ND | ND | 2.8 | 7.09 | 2,532 | ND | ND | ND | ND |
| Image | 0.6 | 1.08 | 1,938 | ND | ND | ND | 1.4 | 3.41 | 2,390 | ND | ND | ND | ND |
| Other | 3.3 | 5.13 | 1,556 | ND | ND | ND | 1.4 | 3.68 | 2,680 | ND | ND | ND | ND |
| Correspondent | 0.4 | 0.10 | 250 | ND | ND | ND | 0.5 | 0.94 | 1,859 | ND | ND | ND | ND |
Table 5. Top 100 ACH, 2015-22
| Depository and Financial Institutions Payments Survey (DFIPS) | 2015 | 2016 | 2017 | 2018 | 2019 | 2020 | 2021 | 2022 | CAGR (Percent) | |||||||||||||||||||
|---|---|---|---|---|---|---|---|---|---|---|---|---|---|---|---|---|---|---|---|---|---|---|---|---|---|---|---|---|
| Number (billions) |
Value ($ trillions) |
Average ($) |
Number (billions) |
Value ($ trillions) |
Average ($) |
Number (billions) |
Value ($ trillions) |
Average ($) |
Number (billions) |
Value ($ trillions) |
Average ($) |
Number (billions) |
Value ($ trillions) |
Average ($) |
Number (billions) |
Value ($ trillions) |
Average ($) |
Number (billions) |
Value ($ trillions) |
Average ($) |
Number (billions) |
Value ($ trillions) |
Average ($) |
2015-18 | 2018-21 | |||
| Number | Value | Number | Value | |||||||||||||||||||||||||
| ACH transfers by type | 16.7 | 121.41 | 7,266 | 16.6 | 116.16 | 6,989 | 18.4 | 127.72 | 6,952 | 19.1 | 131.94 | 6,892 | 20.2 | 138.17 | 6,826 | 22.4 | 144.59 | 6,464 | 24.4 | 164.55 | 6,751 | 27.4 | 223.73 | 8,166 | 4.6 | 2.8 | 8.4 | 7.6 |
| Credit | 8.4 | 70.81 | 8,471 | 7.9 | 67.24 | 8,464 | 8.7 | 73.20 | 8,397 | 9.0 | 75.90 | 8,411 | 9.5 | 79.57 | 8,335 | 10.9 | 84.63 | 7,760 | 11.9 | 93.63 | 7,852 | 13.1 | 129.76 | 9,904 | 2.6 | 2.3 | 9.7 | 7.2 |
| Debit | 8.4 | 50.60 | 6,059 | 8.7 | 48.93 | 5,638 | 9.7 | 54.53 | 5,647 | 10.1 | 56.04 | 5,538 | 10.7 | 58.60 | 5,479 | 11.5 | 59.96 | 5,231 | 12.4 | 70.92 | 5,697 | 14.3 | 93.97 | 6,573 | 6.6 | 3.5 | 7.1 | 8.2 |
| ACH credit transfers by clearing method | 8.4 | 70.81 | 8,471 | 7.9 | 67.24 | 8,464 | 8.7 | 73.20 | 8,397 | 9.0 | 75.90 | 8,411 | 9.5 | 79.57 | 8,335 | 10.9 | 84.63 | 7,760 | 11.9 | 93.63 | 7,852 | 13.1 | 129.76 | 9,904 | 2.6 | 2.3 | 9.7 | 7.2 |
| Network | 6.4 | 21.55 | 3,343 | 6.5 | 22.62 | 3,500 | 7.2 | 25.89 | 3,585 | 7.5 | 27.78 | 3,727 | 8.0 | 29.12 | 3,652 | 9.1 | 31.87 | 3,509 | 10.0 | 36.23 | 3,637 | 10.8 | 43.79 | 4,061 | 5.0 | 8.8 | 10.1 | 9.3 |
| In-house on-us | 1.9 | 49.26 | 25,740 | 1.5 | 44.62 | 30,108 | 1.5 | 47.31 | 31,639 | 1.6 | 48.12 | 30,657 | 1.6 | 50.45 | 32,083 | 1.8 | 52.76 | 28,905 | 2.0 | 57.40 | 29,228 | 2.3 | 85.97 | 37,066 | -6.4 | -0.8 | 7.8 | 6.1 |
| ACH credit transfers by payer type | 8.4 | 70.81 | 8,471 | 7.9 | 67.24 | 8,464 | 8.7 | 73.20 | 8,397 | 9.0 | 75.90 | 8,411 | 9.5 | 79.57 | 8,335 | 10.9 | 84.63 | 7,760 | 11.9 | 93.63 | 7,852 | 13.1 | 129.76 | 9,904 | 2.6 | 2.3 | 9.7 | 7.2 |
| Consumer | 0.8 | 0.59 | 762 | ND | ND | ND | ND | ND | ND | 0.6 | 0.48 | 799 | ND | ND | ND | 0.8 | 0.76 | 903 | 0.9 | 0.72 | 789 | 0.8 | 0.98 | 1,274 | -8.1 | -6.6 | 15.1 | 14.6 |
| Business | 7.6 | 70.23 | 9,252 | ND | ND | ND | ND | ND | ND | 8.4 | 75.42 | 8,951 | ND | ND | ND | 10.1 | 83.87 | 8,334 | 11.0 | 92.91 | 8,436 | 12.3 | 128.77 | 10,445 | 3.5 | 2.4 | 9.3 | 7.2 |
| ACH credit transfers by settlement timing | 8.4 | 70.81 | 8,471 | 7.9 | 67.24 | 8,464 | 8.7 | 73.20 | 8,397 | 9.0 | 75.90 | 8,411 | 9.5 | 79.57 | 8,335 | 10.9 | 84.63 | 7,760 | 11.9 | 93.63 | 7,852 | 13.1 | 129.76 | 9,904 | 2.6 | 2.3 | 9.7 | 7.2 |
| Same-day | 0.0 | 0.21 | 6,179 | 0.1 | 1.35 | 22,061 | 0.1 | 1.22 | 11,605 | 0.2 | 2.07 | 8,769 | 0.3 | 2.47 | 8,798 | 0.3 | 3.02 | 9,473 | 0.6 | 3.60 | 5,977 | 2.4 | 10.10 | 4,211 | 91.8 | 115.5 | 36.6 | 20.3 |
| Non-same-day | 8.3 | 70.60 | 8,480 | 7.9 | 65.89 | 8,359 | 8.6 | 71.98 | 8,358 | 8.8 | 73.83 | 8,402 | 9.3 | 77.10 | 8,321 | 10.6 | 81.61 | 7,709 | 11.3 | 90.02 | 7,952 | 10.7 | 119.66 | 11,180 | 1.8 | 1.5 | 8.8 | 6.8 |
| ACH debit transfers by clearing method | 8.4 | 50.60 | 6,059 | 8.7 | 48.93 | 5,638 | 9.7 | 54.53 | 5,647 | 10.1 | 56.04 | 5,538 | 10.7 | 58.60 | 5,479 | 11.5 | 59.96 | 5,231 | 12.4 | 70.92 | 5,697 | 14.3 | 93.97 | 6,573 | 6.6 | 3.5 | 7.1 | 8.2 |
| Network | 6.3 | 10.26 | 1,632 | 7.0 | 10.50 | 1,511 | 7.8 | 12.06 | 1,541 | 8.2 | 13.37 | 1,630 | 8.9 | 14.34 | 1,611 | 9.5 | 14.39 | 1,518 | 10.1 | 17.23 | 1,712 | 11.3 | 20.24 | 1,793 | 9.3 | 9.2 | 7.1 | 8.8 |
| In-house on-us | 2.1 | 40.34 | 19,513 | 1.7 | 38.42 | 22,290 | 1.8 | 42.47 | 23,170 | 1.9 | 42.68 | 22,229 | 1.8 | 44.26 | 24,631 | 2.0 | 45.57 | 22,981 | 2.4 | 53.69 | 22,531 | 3.0 | 73.73 | 24,504 | -2.4 | 1.9 | 7.5 | 8.0 |
| ACH debit transfers by payer type | 8.4 | 50.60 | 6,059 | 8.7 | 48.93 | 5,638 | 9.7 | 54.53 | 5,647 | 10.1 | 56.04 | 5,538 | 10.7 | 58.60 | 5,479 | 11.5 | 59.96 | 5,231 | 12.4 | 70.92 | 5,697 | 14.3 | 93.97 | 6,573 | 6.6 | 3.5 | 7.1 | 8.2 |
| Consumer | 7.0 | 18.52 | 2,637 | ND | ND | ND | 7.4 | 9.60 | 1,306 | 6.9 | 5.87 | 851 | 7.9 | 10.40 | 1,312 | 8.2 | 7.64 | 929 | 9.3 | 7.83 | 845 | 9.9 | 8.14 | 821 | -0.6 | -31.8 | 10.3 | 10.1 |
| Business | 1.3 | 32.08 | 24,158 | ND | ND | ND | 2.3 | 44.93 | 19,498 | 3.2 | 50.17 | 15,592 | 2.8 | 48.20 | 17,416 | 3.2 | 52.32 | 16,171 | 3.2 | 63.09 | 19,823 | 4.4 | 85.83 | 19,553 | 34.3 | 16.1 | -0.4 | 7.9 |
| ACH debit transfers by settlement timing | 8.4 | 50.60 | 6,059 | 8.7 | 48.93 | 5,638 | 9.7 | 54.53 | 5,647 | 10.1 | 56.04 | 5,538 | 10.7 | 58.60 | 5,479 | 11.5 | 59.96 | 5,231 | 12.4 | 70.92 | 5,697 | 14.3 | 93.97 | 6,573 | 6.6 | 3.5 | 7.1 | 8.2 |
| Same-day | ND | ND | ND | ND | ND | ND | 0.2 | 0.83 | 4,705 | 0.2 | 0.94 | 4,354 | 0.7 | 1.73 | 2,611 | 0.3 | 1.23 | 3,919 | 1.1 | 2.59 | 2,381 | 0.9 | 2.92 | 3,206 | ND | ND | 71.4 | 40.1 |
| Non-same-day | ND | ND | ND | ND | ND | ND | 9.5 | 53.70 | 5,665 | 9.9 | 55.10 | 5,564 | 10.0 | 56.87 | 5,668 | 11.1 | 58.73 | 5,268 | 11.4 | 68.33 | 6,015 | 13.4 | 91.05 | 6,802 | ND | ND | 4.7 | 7.4 |
Table 6. ACH, 2015-21
| Depository and Financial Institutions Payments Survey (DFIPS) | 2015 | 2018 | 2021 | CAGR (Percent) | |||||||||
|---|---|---|---|---|---|---|---|---|---|---|---|---|---|
| Number (billions) |
Value ($ trillions) |
Average ($) |
Number (billions) |
Value ($ trillions) |
Average ($) |
Number (billions) |
Value ($ trillions) |
Average ($) |
2015-18 | 2018-21 | |||
| Number | Value | Number | Value | ||||||||||
| Total | |||||||||||||
| ACH transfers by type | 22.0 | 126.88 | 5,761 | 24.8 | 139.62 | 5,638 | 31.2 | 175.92 | 5,637 | 4.0 | 3.2 | 8.0 | 8.0 |
| Credit | 9.0 | 72.14 | 8,004 | 9.9 | 78.19 | 7,906 | 13.0 | 97.41 | 7,514 | 3.1 | 2.7 | 9.4 | 7.6 |
| Debit | 13.0 | 54.74 | 4,207 | 14.9 | 61.42 | 4,129 | 18.2 | 78.52 | 4,303 | 4.6 | 3.9 | 7.0 | 8.5 |
| ACH credit transfers by clearing method | 9.0 | 72.14 | 8,004 | 9.9 | 78.19 | 7,906 | 13.0 | 97.41 | 7,514 | 3.1 | 2.7 | 9.4 | 7.6 |
| Network | 7.0 | 22.47 | 3,226 | 8.2 | 29.51 | 3,615 | 10.9 | 38.87 | 3,582 | 5.4 | 9.5 | 10.0 | 9.6 |
| In-house on-us | 2.0 | 49.66 | 24,284 | 1.7 | 48.68 | 28,168 | 2.1 | 58.53 | 27,750 | -5.5 | -0.7 | 6.9 | 6.3 |
| ACH credit transfers by payer type | 9.0 | 72.14 | 8,004 | 9.9 | 78.19 | 7,906 | 13.0 | 97.41 | 7,514 | 3.1 | 2.7 | 9.4 | 7.6 |
| Consumer | 0.9 | 0.80 | 883 | 0.8 | 0.69 | 895 | 1.2 | 1.02 | 885 | -5.3 | -4.9 | 14.6 | 14.1 |
| Business | 8.1 | 71.34 | 8,798 | 9.1 | 77.51 | 8,496 | 11.8 | 96.39 | 8,162 | 4.0 | 2.8 | 9.0 | 7.5 |
| ACH credit transfers by settlement timing | 9.0 | 72.14 | 8,004 | 9.9 | 78.19 | 7,906 | 13.0 | 97.41 | 7,514 | 3.1 | 2.7 | 9.4 | 7.6 |
| Same-day | 0.0 | 0.21 | 5,618 | 0.2 | 2.10 | 8,435 | 0.7 | 3.76 | 5,618 | 87.5 | 114.7 | 39.2 | 21.5 |
| Non-same-day | 8.7 | 71.35 | 8,214 | 9.6 | 76.10 | 7,892 | 12.3 | 93.64 | 7,617 | 3.5 | 2.2 | 8.4 | 7.2 |
| ACH debit transfers by clearing method | 13.0 | 54.74 | 4,207 | 14.9 | 61.42 | 4,129 | 18.2 | 78.52 | 4,303 | 4.6 | 3.9 | 7.0 | 8.5 |
| Network | 10.8 | 13.52 | 1,251 | 12.7 | 17.99 | 1,416 | 15.5 | 23.79 | 1,533 | 5.5 | 10.0 | 6.9 | 9.8 |
| In-house on-us | 2.2 | 41.22 | 18,683 | 2.2 | 43.43 | 19,995 | 2.7 | 54.72 | 20,113 | -0.5 | 1.8 | 7.8 | 8.0 |
| ACH debit transfers by payer type | 13.0 | 54.74 | 4,207 | 14.9 | 61.42 | 4,129 | 18.2 | 78.52 | 4,303 | 4.6 | 3.9 | 7.0 | 8.5 |
| Consumer | 11.0 | 20.73 | 1,879 | 10.8 | 8.20 | 757 | 14.4 | 11.58 | 807 | -0.6 | -26.6 | 9.8 | 12.2 |
| Business | 2.0 | 34.01 | 17,165 | 4.0 | 53.22 | 13,165 | 3.9 | 66.93 | 17,202 | 26.8 | 16.1 | -1.3 | 7.9 |
| ACH debit transfers by settlement timing | 13.0 | 54.74 | 4,207 | 14.9 | 61.42 | 4,129 | 18.2 | 78.52 | 4,303 | 4.6 | 3.9 | 7.0 | 8.5 |
| Same-day | ND | ND | ND | 0.3 | 1.20 | 3,744 | 1.3 | 3.03 | 2,316 | ND | ND | 59.9 | 36.3 |
| Non-same-day | ND | ND | ND | 14.6 | 60.22 | 4,138 | 16.9 | 75.48 | 4,457 | ND | ND | 5.2 | 7.8 |
| Top 100 | |||||||||||||
| ACH transfers by type | 16.7 | 121.41 | 7,266 | 19.1 | 131.94 | 6,892 | 24.4 | 164.55 | 6,751 | 4.6 | 2.8 | 8.4 | 7.6 |
| Credit | 8.4 | 70.81 | 8,471 | 9.0 | 75.90 | 8,411 | 11.9 | 93.63 | 7,852 | 2.6 | 2.3 | 9.7 | 7.2 |
| Debit | 8.4 | 50.60 | 6,059 | 10.1 | 56.04 | 5,538 | 12.4 | 70.92 | 5,697 | 6.6 | 3.5 | 7.1 | 8.2 |
| ACH credit transfers by clearing method | 8.4 | 70.81 | 8,471 | 9.0 | 75.90 | 8,411 | 11.9 | 93.63 | 7,852 | 2.6 | 2.3 | 9.7 | 7.2 |
| Network | 6.4 | 21.55 | 3,343 | 7.5 | 27.78 | 3,727 | 10.0 | 36.23 | 3,637 | 5.0 | 8.8 | 10.1 | 9.3 |
| In-house on-us | 1.9 | 49.26 | 25,740 | 1.6 | 48.12 | 30,657 | 2.0 | 57.40 | 29,228 | -6.4 | -0.8 | 7.8 | 6.1 |
| ACH credit transfers by payer type | 8.4 | 70.81 | 8,471 | 9.0 | 75.90 | 8,411 | 11.9 | 93.63 | 7,852 | 2.6 | 2.3 | 9.7 | 7.2 |
| Consumer | 0.8 | 0.59 | 762 | 0.6 | 0.48 | 799 | 0.9 | 0.72 | 789 | -8.1 | -6.6 | 15.1 | 14.6 |
| Business | 7.6 | 70.23 | 9,252 | 8.4 | 75.42 | 8,951 | 11.0 | 92.91 | 8,436 | 3.5 | 2.4 | 9.3 | 7.2 |
| ACH credit transfers by settlement timing | 8.4 | 70.81 | 8,471 | 9.0 | 75.90 | 8,411 | 11.9 | 93.63 | 7,852 | 2.6 | 2.3 | 9.7 | 7.2 |
| Same-day | 0.0 | 0.21 | 6,179 | 0.2 | 2.07 | 8,769 | 0.6 | 3.60 | 5,977 | 91.8 | 115.5 | 36.6 | 20.3 |
| Non-same-day | 8.3 | 70.60 | 8,480 | 8.8 | 73.83 | 8,402 | 11.3 | 90.02 | 7,952 | 1.8 | 1.5 | 8.8 | 6.8 |
| ACH debit transfers by clearing method | 8.4 | 50.60 | 6,059 | 10.1 | 56.04 | 5,538 | 12.4 | 70.92 | 5,697 | 6.6 | 3.5 | 7.1 | 8.2 |
| Network | 6.3 | 10.26 | 1,632 | 8.2 | 13.37 | 1,630 | 10.1 | 17.23 | 1,712 | 9.3 | 9.2 | 7.1 | 8.8 |
| In-house on-us | 2.1 | 40.34 | 19,513 | 1.9 | 42.68 | 22,229 | 2.4 | 53.69 | 22,531 | -2.4 | 1.9 | 7.5 | 8.0 |
| ACH debit transfers by payer type | 8.4 | 50.60 | 6,059 | 10.1 | 56.04 | 5,538 | 12.4 | 70.92 | 5,697 | 6.6 | 3.5 | 7.1 | 8.2 |
| Consumer | 7.0 | 18.52 | 2,637 | 6.9 | 5.87 | 851 | 9.3 | 7.83 | 845 | -0.6 | -31.8 | 10.3 | 10.1 |
| Business | 1.3 | 32.08 | 24,158 | 3.2 | 50.17 | 15,592 | 3.2 | 63.09 | 19,823 | 34.3 | 16.1 | -0.4 | 7.9 |
| ACH debit transfers by settlement timing | 8.4 | 50.60 | 6,059 | 10.1 | 56.04 | 5,538 | 12.4 | 70.92 | 5,697 | 6.6 | 3.5 | 7.1 | 8.2 |
| Same-day | ND | ND | ND | 0.2 | 0.94 | 4,354 | 1.1 | 2.59 | 2,381 | ND | ND | 71.4 | 40.1 |
| Non-same-day | ND | ND | ND | 9.9 | 55.10 | 5,564 | 11.4 | 68.33 | 6,015 | ND | ND | 4.7 | 7.4 |
| All Other | |||||||||||||
| ACH transfers by type | 5.3 | 5.47 | 1,029 | 5.6 | 7.67 | 1,365 | 6.8 | 11.37 | 1,663 | 1.9 | 12.0 | 6.7 | 14.0 |
| Credit | 0.7 | 1.33 | 2,031 | 0.9 | 2.29 | 2,646 | 1.0 | 3.78 | 3,636 | 9.9 | 20.0 | 6.2 | 18.1 |
| Debit | 4.7 | 4.14 | 888 | 4.8 | 5.38 | 1,131 | 5.8 | 7.59 | 1,310 | 0.7 | 9.1 | 6.8 | 12.2 |
| ACH credit transfers by clearing method | 0.7 | 1.33 | 2,031 | 0.9 | 2.29 | 2,646 | 1.0 | 3.78 | 3,636 | 9.9 | 20.0 | 6.2 | 18.1 |
| Network | 0.5 | 0.92 | 1,771 | 0.7 | 1.73 | 2,446 | 0.9 | 2.65 | 2,961 | 10.8 | 23.4 | 8.0 | 15.1 |
| In-house on-us | 0.1 | 0.40 | 3,065 | 0.2 | 0.56 | 3,528 | 0.1 | 1.13 | 7,783 | 6.5 | 11.6 | -2.9 | 26.5 |
| ACH credit transfers by payer type | 0.7 | 1.33 | 2,031 | 0.9 | 2.29 | 2,646 | 1.0 | 3.78 | 3,636 | 9.9 | 20.0 | 6.2 | 18.1 |
| Consumer | 0.1 | 0.21 | 1,578 | 0.2 | 0.21 | 1,233 | 0.2 | 0.30 | 1,246 | 8.1 | -0.4 | 12.6 | 13.0 |
| Business | 0.5 | 1.11 | 2,148 | 0.7 | 2.09 | 2,989 | 0.8 | 3.47 | 4,363 | 10.4 | 23.2 | 4.5 | 18.6 |
| ACH credit transfers by settlement timing | 0.7 | 1.33 | 2,031 | 0.9 | 2.29 | 2,646 | 1.0 | 3.78 | 3,636 | 9.9 | 20.0 | 6.2 | 18.1 |
| Same-day | 0.0 | 0.00 | 1,143 | 0.0 | 0.02 | 1,926 | 0.1 | 0.16 | 2,357 | 42.3 | 69.3 | 76.4 | 88.7 |
| Non-same-day | 0.4 | 0.75 | 2,071 | 0.9 | 2.27 | 2,656 | 1.0 | 3.62 | 3,723 | 33.4 | 44.9 | 4.4 | 16.8 |
| ACH debit transfers by clearing method | 4.7 | 4.14 | 888 | 4.8 | 5.38 | 1,131 | 5.8 | 7.59 | 1,310 | 0.7 | 9.1 | 6.8 | 12.2 |
| Network | 4.5 | 3.26 | 722 | 4.5 | 4.62 | 1,026 | 5.5 | 6.56 | 1,203 | -0.1 | 12.3 | 6.6 | 12.4 |
| In-house on-us | 0.1 | 0.88 | 6,317 | 0.3 | 0.76 | 3,000 | 0.3 | 1.03 | 3,047 | 22.1 | -4.7 | 10.2 | 10.7 |
| ACH debit transfers by payer type | 4.7 | 4.14 | 888 | 4.8 | 5.38 | 1,131 | 5.8 | 7.59 | 1,310 | 0.7 | 9.1 | 6.8 | 12.2 |
| Consumer | 4.0 | 2.21 | 551 | 3.9 | 2.33 | 593 | 5.1 | 3.75 | 738 | -0.6 | 1.8 | 9.0 | 17.2 |
| Business | 0.7 | 1.93 | 2,959 | 0.8 | 3.05 | 3,695 | 0.7 | 3.84 | 5,421 | 8.0 | 16.4 | -4.9 | 8.0 |
| ACH debit transfers by settlement timing | 4.7 | 4.14 | 888 | 4.8 | 5.38 | 1,131 | 5.8 | 7.59 | 1,310 | 0.7 | 9.1 | 6.8 | 12.2 |
| Same-day | ND | ND | ND | 0.1 | 0.26 | 2,469 | 0.2 | 0.44 | 1,993 | ND | ND | 28.5 | 19.6 |
| Non-same-day | ND | ND | ND | 4.7 | 5.12 | 1,101 | 5.6 | 7.15 | 1,283 | ND | ND | 6.2 | 11.8 |
Table 7. Top 100 Wire Transfers, 2015-22
| Depository and Financial Institutions Payments Survey (DFIPS) | 2015 | 2016 | 20171 | 2018 | 2019 | 2020 | 2021 | 2022 | CAGR (Percent) | |||||||||||||||||||
|---|---|---|---|---|---|---|---|---|---|---|---|---|---|---|---|---|---|---|---|---|---|---|---|---|---|---|---|---|
| Number (millions) |
Value ($ trillions) |
Average ($) |
Number (millions) |
Value ($ trillions) |
Average ($) |
Number (millions) |
Value ($ trillions) |
Average ($) |
Number (millions) |
Value ($ trillions) |
Average ($) |
Number (millions) |
Value ($ trillions) |
Average ($) |
Number (millions) |
Value ($ trillions) |
Average ($) |
Number (millions) |
Value ($ trillions) |
Average ($) |
Number (millions) |
Value ($ trillions) |
Average ($) |
2015-18 | 2018-21 | |||
| Number | Value | Number | Value | |||||||||||||||||||||||||
| Wire transfers originated by payer type | 247.2 | 1,288.24 | 5,210,480 | 290.6 | 1,124.32 | 3,869,316 | 307.9 | 1,281.44 | 4,162,147 | 327.4 | 1,458.59 | 4,454,521 | 363.9 | 1,452.03 | 3,989,762 | 373.4 | 1,688.96 | 4,523,666 | 394.8 | 1,696.33 | 4,297,222 | 444.7 | 2,095.13 | 4,711,501 | 9.8 | 4.2 | 6.4 | 5.2 |
| Consumer | 11.8 | 3.42 | 290,366 | 14.7 | 5.24 | 355,901 | ND | ND | ND | 33.1 | 14.95 | 451,756 | 33.0 | 11.73 | 356,009 | 38.8 | 18.66 | 481,457 | 38.6 | 20.56 | 533,366 | 43.3 | 20.02 | 462,736 | 41.1 | 63.5 | 5.2 | 11.2 |
| Business | 235.5 | 1,284.82 | 5,456,583 | 275.9 | 1,119.09 | 4,056,698 | ND | ND | ND | 294.3 | 1,443.64 | 4,904,531 | 331.0 | 1,440.30 | 4,351,520 | 334.6 | 1,670.30 | 4,991,879 | 356.2 | 1,675.77 | 4,704,588 | 401.4 | 2,075.11 | 5,169,353 | 7.7 | 4.0 | 6.6 | 5.1 |
| Settlement/bank business | 26.8 | 447.12 | 16,713,988 | 31.1 | 372.39 | 11,962,799 | ND | ND | ND | 37.3 | 450.75 | 12,074,264 | 40.1 | 437.54 | 10,920,777 | 32.8 | 459.47 | 13,997,599 | 42.4 | 433.54 | 10,224,628 | 45.8 | 453.31 | 9,894,114 | 11.7 | 0.3 | 4.3 | -1.3 |
| Other | 208.7 | 837.70 | 4,013,686 | 244.7 | 746.70 | 3,051,067 | ND | ND | ND | 257.0 | 992.89 | 3,863,131 | 290.9 | 1,002.75 | 3,446,818 | 301.8 | 1,210.83 | 4,012,319 | 313.8 | 1,242.23 | 3,958,697 | 355.6 | 1,621.81 | 4,560,630 | 7.2 | 5.8 | 6.9 | 7.8 |
| Wire transfers originated by payee location | 247.2 | 1,288.24 | 5,210,480 | 290.6 | 1,124.32 | 3,869,316 | 307.9 | 1,281.44 | 4,162,147 | 327.4 | 1,458.59 | 4,454,521 | 363.9 | 1,452.03 | 3,989,762 | 373.4 | 1,688.96 | 4,523,666 | 394.8 | 1,696.33 | 4,297,222 | 444.7 | 2,095.13 | 4,711,501 | 9.8 | 4.2 | 6.4 | 5.2 |
| Domestic | 197.3 | 1,054.95 | 5,346,125 | 230.3 | 898.84 | 3,903,144 | ND | ND | ND | 262.0 | 1,204.69 | 4,597,538 | 290.0 | 1,199.85 | 4,137,684 | 300.0 | 1,414.54 | 4,715,198 | 308.9 | 1,399.38 | 4,530,693 | 349.5 | 1,784.92 | 5,107,516 | 9.9 | 4.5 | 5.6 | 5.1 |
| Cross-border | 49.9 | 233.29 | 4,674,190 | 60.3 | 225.49 | 3,740,104 | ND | ND | ND | 65.4 | 253.90 | 3,881,600 | 74.0 | 252.18 | 3,409,775 | 73.4 | 274.42 | 3,740,469 | 85.9 | 296.95 | 3,457,572 | 95.2 | 310.21 | 3,257,986 | 9.4 | 2.9 | 9.5 | 5.4 |
| Wire transfers originated by clearing method | 247.2 | 1,288.24 | 5,210,480 | 290.6 | 1,124.32 | 3,869,316 | 307.9 | 1,281.44 | 4,162,147 | 327.4 | 1,458.59 | 4,454,521 | 363.9 | 1,452.03 | 3,989,762 | 373.4 | 1,688.96 | 4,523,666 | 394.8 | 1,696.33 | 4,297,222 | 444.7 | 2,095.13 | 4,711,501 | 9.8 | 4.2 | 6.4 | 5.2 |
| Interbank | 154.9 | 674.83 | 4,357,623 | 185.3 | 602.39 | 3,251,066 | 190.6 | 668.37 | 3,506,349 | 192.8 | 691.96 | 3,588,321 | 211.9 | 661.89 | 3,123,871 | 223.9 | 740.52 | 3,307,682 | 232.7 | 792.10 | 3,404,213 | 248.7 | 906.00 | 3,643,062 | 7.6 | 0.8 | 6.5 | 4.6 |
| Book transfer | 92.4 | 613.41 | 6,640,212 | 105.3 | 521.93 | 4,957,398 | 117.3 | 613.07 | 5,228,172 | 134.6 | 766.63 | 5,695,477 | 152.1 | 790.14 | 5,196,310 | 149.5 | 948.44 | 6,344,833 | 162.1 | 904.23 | 5,579,305 | 196.0 | 1,189.13 | 6,067,228 | 13.4 | 7.7 | 6.4 | 5.7 |
| Wire transfers received | 225.2 | 992.07 | 4,406,241 | ND | ND | ND | ND | ND | ND | 237.8 | 908.39 | 3,819,657 | ND | ND | ND | ND | ND | ND | 310.0 | 1,140.97 | 3,680,669 | ND | ND | ND | 1.8 | -2.9 | 9.2 | 7.9 |
Table 8. Wire Transfers, 2015-21
| Depository and Financial Institutions Payments Survey (DFIPS) | 2015 | 2018 | 2021 | CAGR (Percent) | |||||||||
|---|---|---|---|---|---|---|---|---|---|---|---|---|---|
| Number (millions) |
Value ($ trillions) |
Average ($) |
Number (millions) |
Value ($ trillions) |
Average ($) |
Number (millions) |
Value ($ trillions) |
Average ($) |
2015-18 | 2018-21 | |||
| Number | Value | Number | Value | ||||||||||
| Total | |||||||||||||
| Wire transfers originated by payer type | 269.2 | 1,295.63 | 4,812,066 | 353.1 | 1,466.42 | 4,152,830 | 432.1 | 1,707.49 | 3,951,543 | 9.5 | 4.2 | 7.0 | 5.2 |
| Consumer | 17.7 | 3.90 | 219,820 | 39.9 | 15.55 | 389,600 | 47.0 | 21.41 | 455,774 | 31.0 | 58.6 | 5.6 | 11.3 |
| Business | 251.5 | 1,291.73 | 5,136,023 | 313.2 | 1,450.87 | 4,632,351 | 385.1 | 1,686.09 | 4,377,902 | 7.6 | 3.9 | 7.1 | 5.1 |
| Settlement/bank business | 30.0 | 451.14 | 15,026,048 | 41.0 | 453.77 | 11,060,794 | 45.9 | 437.15 | 9,534,187 | 11.0 | 0.2 | 3.8 | -1.2 |
| Other | 221.5 | 840.59 | 3,795,331 | 272.2 | 997.11 | 3,663,410 | 339.3 | 1,248.94 | 3,681,085 | 7.1 | 5.9 | 7.6 | 7.8 |
| Wire transfers originated by payee location | 269.2 | 1,295.63 | 4,812,066 | 353.1 | 1,466.42 | 4,152,830 | 432.1 | 1,707.49 | 3,951,543 | 9.5 | 4.2 | 7.0 | 5.2 |
| Domestic | 216.4 | 1,062.16 | 4,908,092 | 284.5 | 1,212.28 | 4,261,482 | 341.6 | 1,410.27 | 4,128,532 | 9.5 | 4.5 | 6.3 | 5.2 |
| Cross-border | 52.8 | 233.47 | 4,418,769 | 68.6 | 254.14 | 3,702,523 | 90.5 | 297.23 | 3,283,634 | 9.1 | 2.9 | 9.7 | 5.4 |
| Wire transfers originated by clearing method | 269.2 | 1,295.63 | 4,812,066 | 353.1 | 1,466.42 | 4,152,830 | 432.1 | 1,707.49 | 3,951,543 | 9.5 | 4.2 | 7.0 | 5.2 |
| Interbank | 174.7 | 681.75 | 3,902,506 | 215.2 | 699.18 | 3,249,628 | 266.8 | 802.50 | 3,007,693 | 7.2 | 0.8 | 7.4 | 4.7 |
| Book transfer | 94.6 | 613.88 | 6,492,602 | 138.0 | 767.25 | 5,561,439 | 165.3 | 905.00 | 5,475,103 | 13.4 | 7.7 | 6.2 | 5.7 |
| Wire transfers received | 246.1 | 998.94 | 4,058,624 | 262.2 | 918.00 | 3,501,520 | 343.5 | 1,156.51 | 3,367,078 | 2.1 | -2.8 | 9.4 | 8.0 |
| Top 100 | |||||||||||||
| Wire transfers originated by payer type | 247.2 | 1,288.24 | 5,210,480 | 327.4 | 1,458.59 | 4,454,521 | 394.8 | 1,696.33 | 4,297,222 | 9.8 | 4.2 | 6.4 | 5.2 |
| Consumer | 11.8 | 3.42 | 290,366 | 33.1 | 14.95 | 451,756 | 38.6 | 20.56 | 533,366 | 41.1 | 63.5 | 5.2 | 11.2 |
| Business | 235.5 | 1,284.82 | 5,456,583 | 294.3 | 1,443.64 | 4,904,531 | 356.2 | 1,675.77 | 4,704,588 | 7.7 | 4.0 | 6.6 | 5.1 |
| Settlement/bank business | 26.8 | 447.12 | 16,713,988 | 37.3 | 450.75 | 12,074,264 | 42.4 | 433.54 | 10,224,628 | 11.7 | 0.3 | 4.3 | -1.3 |
| Other | 208.7 | 837.70 | 4,013,686 | 257.0 | 992.89 | 3,863,131 | 313.8 | 1,242.23 | 3,958,697 | 7.2 | 5.8 | 6.9 | 7.8 |
| Wire transfers originated by payee location | 247.2 | 1,288.24 | 5,210,480 | 327.4 | 1,458.59 | 4,454,521 | 394.8 | 1,696.33 | 4,297,222 | 9.8 | 4.2 | 6.4 | 5.2 |
| Domestic | 197.3 | 1,054.95 | 5,346,125 | 262.0 | 1,204.69 | 4,597,538 | 308.9 | 1,399.38 | 4,530,693 | 9.9 | 4.5 | 5.6 | 5.1 |
| Cross-border | 49.9 | 233.29 | 4,674,190 | 65.4 | 253.90 | 3,881,600 | 85.9 | 296.95 | 3,457,572 | 9.4 | 2.9 | 9.5 | 5.4 |
| Wire transfers originated by clearing method | 247.2 | 1,288.24 | 5,210,480 | 327.4 | 1,458.59 | 4,454,521 | 394.8 | 1,696.33 | 4,297,222 | 9.8 | 4.2 | 6.4 | 5.2 |
| Interbank | 154.9 | 674.83 | 4,357,623 | 192.8 | 691.96 | 3,588,321 | 232.7 | 792.10 | 3,404,213 | 7.6 | 0.8 | 6.5 | 4.6 |
| Book transfer | 92.4 | 613.41 | 6,640,212 | 134.6 | 766.63 | 5,695,477 | 162.1 | 904.23 | 5,579,305 | 13.4 | 7.7 | 6.4 | 5.7 |
| Wire transfers received | 225.2 | 992.07 | 4,406,241 | 237.8 | 908.39 | 3,819,657 | 310.0 | 1,140.97 | 3,680,669 | 1.8 | -2.9 | 9.2 | 7.9 |
| All Other | |||||||||||||
| Wire transfers originated by payer type | 22.0 | 7.39 | 335,824 | 25.7 | 7.83 | 305,121 | 37.4 | 11.17 | 298,897 | 5.3 | 2.0 | 13.3 | 12.5 |
| Consumer | 6.0 | 0.48 | 80,516 | 6.8 | 0.60 | 87,884 | 8.4 | 0.85 | 100,556 | 4.6 | 7.7 | 7.3 | 12.2 |
| Business | 16.0 | 6.91 | 430,750 | 18.9 | 7.23 | 383,659 | 28.9 | 10.32 | 356,616 | 5.5 | 1.5 | 15.3 | 12.6 |
| Settlement/bank business | 3.3 | 4.02 | 1,228,676 | 3.7 | 3.02 | 816,800 | 3.4 | 3.61 | 1,046,444 | 4.1 | -9.1 | -2.3 | 6.2 |
| Other | 12.8 | 2.89 | 226,239 | 15.2 | 4.22 | 278,159 | 25.5 | 6.71 | 263,264 | 5.9 | 13.4 | 18.9 | 16.7 |
| Wire transfers originated by payee location | 22.0 | 7.39 | 335,824 | 25.7 | 7.83 | 305,121 | 37.4 | 11.17 | 298,897 | 5.3 | 2.0 | 13.3 | 12.5 |
| Domestic | 19.1 | 7.21 | 377,863 | 22.4 | 7.59 | 338,165 | 32.7 | 10.89 | 332,645 | 5.6 | 1.7 | 13.4 | 12.8 |
| Cross-border | 2.9 | 0.18 | 61,688 | 3.2 | 0.24 | 75,465 | 4.6 | 0.28 | 60,622 | 3.3 | 10.5 | 12.8 | 4.9 |
| Wire transfers originated by clearing method | 22.0 | 7.39 | 335,824 | 25.7 | 7.83 | 305,121 | 37.4 | 11.17 | 298,897 | 5.3 | 2.0 | 13.3 | 12.5 |
| Interbank | 19.8 | 6.92 | 348,788 | 22.3 | 7.21 | 323,214 | 34.1 | 10.40 | 304,787 | 4.0 | 1.4 | 15.2 | 13.0 |
| Book transfer | 2.2 | 0.47 | 217,504 | 3.4 | 0.62 | 184,781 | 3.2 | 0.76 | 236,528 | 15.6 | 9.5 | -1.3 | 7.1 |
| Wire transfers received | 21.0 | 6.87 | 327,317 | 24.4 | 9.61 | 394,655 | 33.5 | 15.53 | 463,922 | 5.1 | 11.9 | 11.2 | 17.4 |
Table 9. Top 100 Alternative Payments, 2015-22
| Depository and Financial Institutions Payments Survey (DFIPS) | 2015 | 2016 | 2017 | 2018 | 2019 | 2020 | 2021 | 2022 | CAGR (Percent) | |||||||||||||||||||
|---|---|---|---|---|---|---|---|---|---|---|---|---|---|---|---|---|---|---|---|---|---|---|---|---|---|---|---|---|
| Number (billions) |
Value ($ trillions) |
Average ($) |
Number (billions) |
Value ($ trillions) |
Average ($) |
Number (billions) |
Value ($ trillions) |
Average ($) |
Number (billions) |
Value ($ trillions) |
Average ($) |
Number (billions) |
Value ($ trillions) |
Average ($) |
Number (billions) |
Value ($ trillions) |
Average ($) |
Number (billions) |
Value ($ trillions) |
Average ($) |
Number (billions) |
Value ($ trillions) |
Average ($) |
2015-18 | 2018-21 | |||
| Number | Value | Number | Value | |||||||||||||||||||||||||
| Bill payment transactions | 1.9 | 0.89 | 462 | 1.8 | 0.75 | 416 | 1.7 | 0.76 | 434 | 2.4 | 1.42 | 584 | 2.6 | 1.60 | 622 | 2.6 | 1.61 | 619 | 2.5 | 1.72 | 700 | 2.5 | 1.93 | 778 | 7.9 | 16.7 | 0.2 | 6.5 |
| Person-to-person (P2P) transfers by funds availability to the recipient | 0.2 | 0.05 | 294 | 0.2 | 0.06 | 303 | 0.3 | 0.09 | 294 | 0.5 | 0.14 | 259 | 0.9 | 0.22 | 244 | 1.5 | 0.35 | 234 | 1.9 | 0.43 | 223 | 3.5 | 0.72 | 206 | 47.5 | 41.3 | 53.0 | 45.6 |
| Immediate | ND | ND | ND | ND | ND | ND | ND | ND | ND | ND | ND | ND | ND | ND | ND | ND | ND | ND | 1.4 | 0.30 | 216 | ND | ND | ND | ND | ND | ND | ND |
| Other | ND | ND | ND | ND | ND | ND | ND | ND | ND | ND | ND | ND | ND | ND | ND | ND | ND | ND | 0.5 | 0.13 | 243 | ND | ND | ND | ND | ND | ND | ND |
Table 10. Alternative Payments, 2015-21
| Depository and Financial Institutions Payments Survey (DFIPS) | 2015 | 2018 | 2021 | CAGR (Percent) | |||||||||
|---|---|---|---|---|---|---|---|---|---|---|---|---|---|
| Number (billions) |
Value ($ trillions) |
Average ($) |
Number (billions) |
Value ($ trillions) |
Average ($) |
Number (billions) |
Value ($ trillions) |
Average ($) |
2015-18 | 2018-21 | |||
| Number | Value | Number | Value | ||||||||||
| Total | |||||||||||||
| Bill payment transactions | 2.6 | 1.14 | 432 | 3.0 | 1.64 | 544 | 3.0 | 1.95 | 659 | 4.6 | 12.9 | -0.7 | 5.9 |
| Person-to-person (P2P) transfers by funds availability to the recipient | 0.2 | 0.06 | 320 | 0.6 | 0.15 | 265 | 2.0 | 0.45 | 224 | 47.9 | 38.8 | 51.8 | 43.5 |
| Immediate | ND | ND | ND | ND | ND | ND | 1.5 | 0.32 | 214 | ND | ND | ND | ND |
| Other | ND | ND | ND | ND | ND | ND | 0.5 | 0.14 | 253 | ND | ND | ND | ND |
| Top 100 | |||||||||||||
| Bill payment transactions | 1.9 | 0.89 | 462 | 2.4 | 1.42 | 584 | 2.5 | 1.72 | 700 | 7.9 | 16.7 | 0.2 | 6.5 |
| Person-to-person (P2P) transfers by funds availability to the recipient | 0.2 | 0.05 | 294 | 0.5 | 0.14 | 259 | 1.9 | 0.43 | 223 | 47.5 | 41.3 | 53.0 | 45.6 |
| Immediate | ND | ND | ND | ND | ND | ND | 1.4 | 0.30 | 216 | ND | ND | ND | ND |
| Other | ND | ND | ND | ND | ND | ND | 0.5 | 0.13 | 243 | ND | ND | ND | ND |
| All Other | |||||||||||||
| Bill payment transactions | 0.7 | 0.25 | 349 | 0.6 | 0.22 | 375 | 0.5 | 0.24 | 462 | -6.0 | -3.7 | -4.6 | 2.3 |
| Person-to-person (P2P) transfers by funds availability to the recipient | 0.0 | 0.01 | 650 | 0.0 | 0.02 | 340 | 0.1 | 0.03 | 243 | 52.1 | 22.5 | 35.7 | 21.3 |
| Immediate | ND | ND | ND | ND | ND | ND | 0.1 | 0.02 | 184 | ND | ND | ND | ND |
| Other | ND | ND | ND | ND | ND | ND | 0.0 | 0.01 | 523 | ND | ND | ND | ND |