EFA: Household Debt
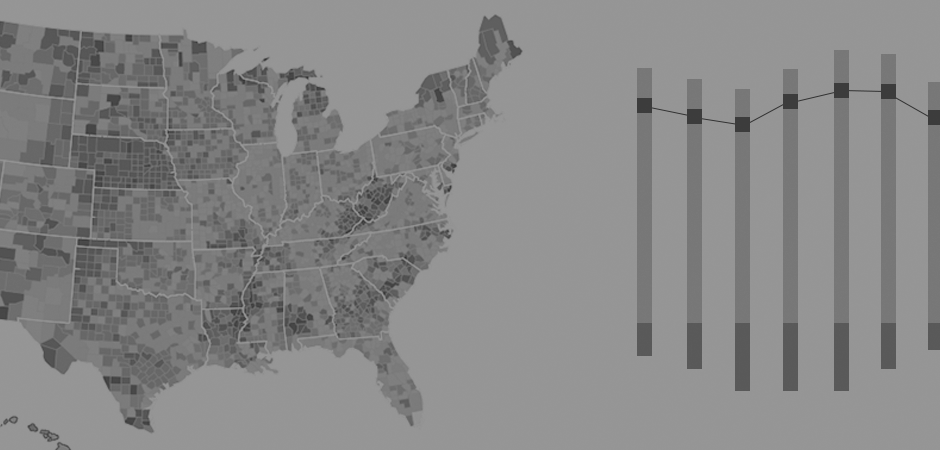
MSA-Level Debt-to-Income Ratio, 1999 - 2025 1
These maps illustrate the evolution of the household debt-to-income ratio by metropolitan statistical area over time.
1999
2025
PLAY
- 0.51
- 1.02
- 1.14
- 1.25
- 1.35
- 1.47
- 1.61
- 1.79
- 2.06
- > 2.51
Note: (1) The map shows Q4 of each year. Data for all quarters are available in the table view. Return to text
Last Update: June 18, 2026