FEDS Notes
June 24, 2022
Bottlenecks, Shortages, and Soaring Prices in the U.S. Economy
Deepa D. Datta, Laura Feiveson, Ekaterina Peneva, Gisela Rua1
On June 29, 2022, the right panel in Figure 4 was updated to switch the lines for New vehicles and Used vehicles.
Introduction
Since the onset of the COVID-19 pandemic, sweeping production constraints, combined with surging demand in some industries, have led to shortages, severe congestion, and soaring prices. What will it take for these bottlenecks to resolve and for price pressures to ease?
In this note, we address this question by providing a simple framework in which to conceptually distinguish between supply-driven and demand-driven bottlenecks within an industry. This distinction allows us to consider how bottlenecks might resolve on an industry-by-industry basis. For example, for those industries that are mostly plagued by labor shortages, the return of people to work post-pandemic may be enough to allow supply to recover, reducing price pressures. But for those industries that are facing elevated demand, an eventual tapering in demand or increase in supply capacity may be needed, though the latter could require a longer adjustment period.
Widespread evidence of bottlenecks in the U.S. economy
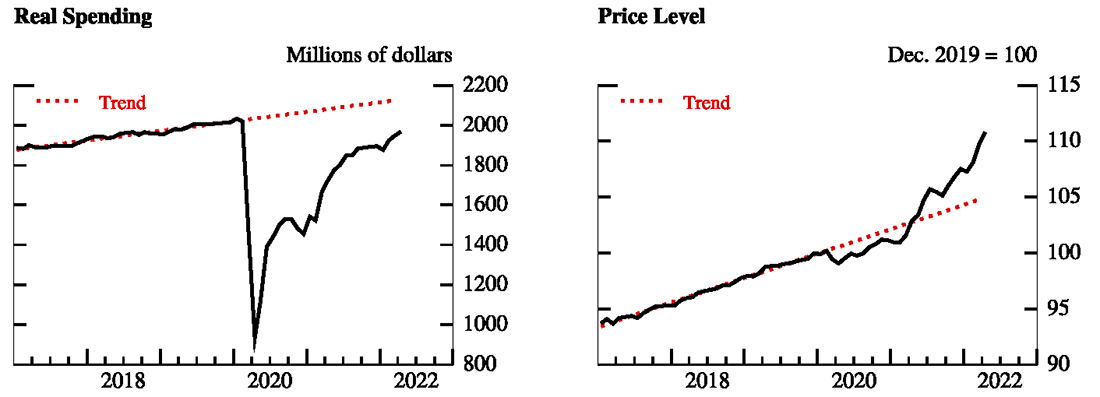
Supply and demand imbalances in the U.S. economy have been widespread, prompting inflation to rise to levels not seen in decades. One key contributor to the imbalances is that pandemic-induced social distancing led consumers to quickly shift spending away from services and towards goods. Further supported by fiscal stimulus and accommodative monetary policy, real goods spending by households has risen markedly, far exceeding its pre-pandemic trend, as have goods prices (Figure 1).2 This pattern of soaring demand and steep price increases has been seen across many industries and related supply chains. For instance, the increased demand for goods has led to higher demand for imported consumer goods, resulting in substantial increases in port throughputs that have strained port capacity (Figure 2, left panel). Accordingly, the shipping sector has been under pressure, leading to delayed shipments and sharp increases in costs (Figure 2, right panel).
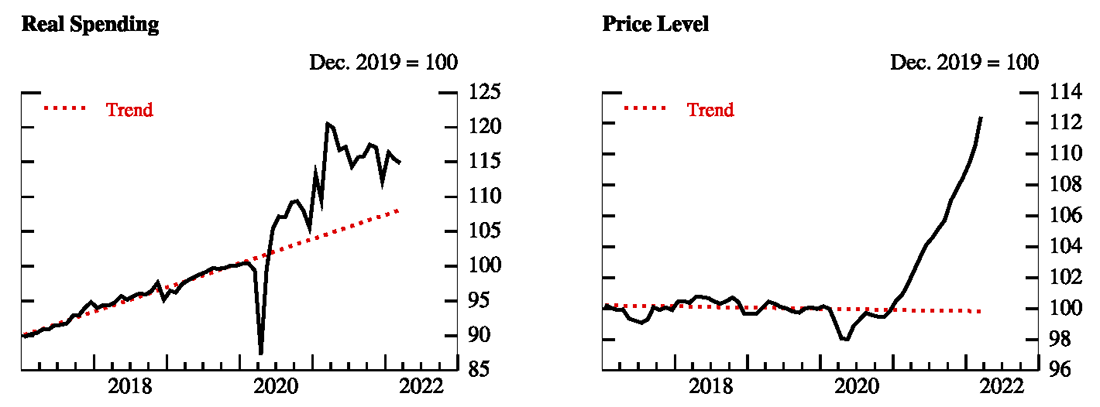
Source: Bureau of Economic Analysis via Haver Analytics.
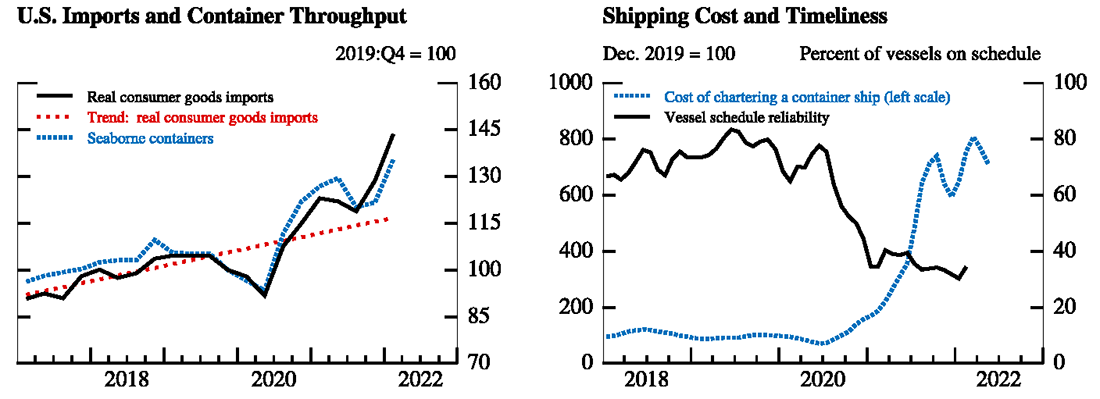
Left panel:
Note: The containers data are seasonally adjusted quarterly averages of monthly data.
Source: Bureau of Economic Analysis; Maryland Port Administration; Virginia Port Authority; South Carolina Port Authority; Port of Houston Authority; Port of Los Angeles; Port of Long Beach; Port of New York and New Jersey; Port of Oakland; Georgia Ports Authority; Northwest Seaport Alliance; all via Haver Analytics; Federal Reserve Board staff calculations.
Right panel:
Note: Data are not seasonally adjusted. "On schedule" is defined as a vessel arriving within 1 day of its listed schedule.
Source: NewConTex, © VHSS e.V., Hamburg and Bremen Shipbrokers' Association; Sea-Intelligence (2021), Global Liner Performance, issue 127 (March).
Supply-side factors have also contributed significantly to the bottlenecks in the economy over the last two years. At the onset of the pandemic, many businesses were forced to shut down as states imposed social-distancing restrictions, and other businesses, expecting low demand, voluntarily curtailed production and reduced their orders for material inputs. Despite most businesses fully reopening and some even producing more output than they did pre-COVID, businesses are still working to catch up with the lost production to replenish their inventories. Additionally, labor force participation declined sharply at the onset of the pandemic and the recovery so far has been slow and only partial. As a result, broad-based worker shortages have been limiting production capacity, and as the recovery has gained steam, we have started seeing unusually strong wage increases (Figure 3).
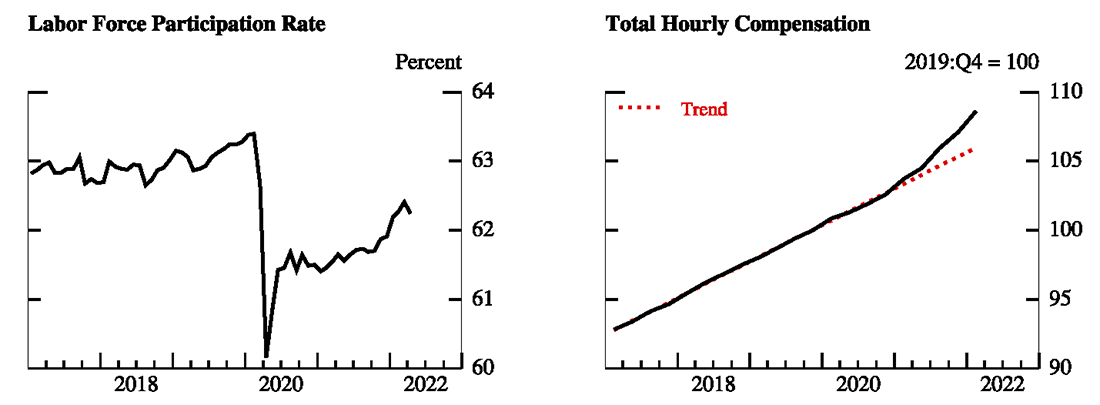
Left panel:
Note: The labor force participation rate is a percentage of the population aged 16 and over.
Source: Bureau of Labor Statistics via Haver Analytics.
Right panel:
Note: The data are the private-sector employment cost index for total compensation, which includes both wages and benefits.
Source: Bureau of Labor Statistics via Haver Analytics.
Finally, in many industries, demand and supply factors have interacted with one another to result in more severe bottlenecks, with some still ongoing. For instance, even though semiconductors are being shipped at levels well above their pre-pandemic trend, there have been semiconductor shortages in the auto sector, in part due to the siphoning off of semiconductors toward other high-demand industries, such as household appliances and consumer electronics. Additionally, demand for semiconductors by the auto sector has been boosted by a shift toward models that require a higher chip content per vehicle than the average car—such as high-profit-margin luxury vehicles (which come equipped with more technology) and vehicles with hybrid and electric powertrains (which require twice the chip content of the average vehicle).3 As a result of the chip shortages, motor vehicle production has remained well below pre-pandemic levels, and consumers seeking to purchase a new vehicle are facing empty dealer lots, long wait times, and elevated prices. And with new vehicles in short supply, prices of used cars have skyrocketed (Figure 4).
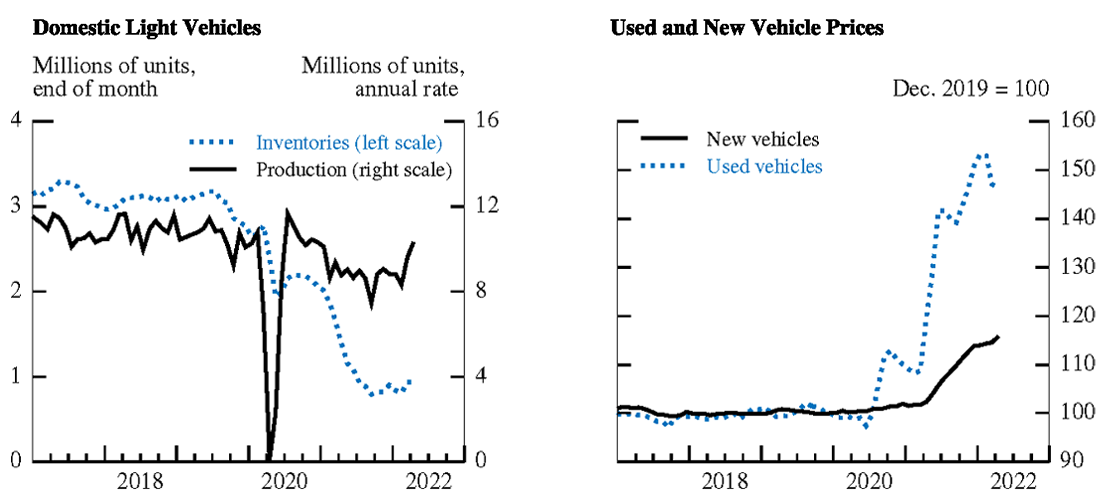
Left panel:
Source: Ward’s Communications.
Right panel:
Note: Consumer Price Indexes for new and used vehicles.
Source: Bureau of Labor Statistics via Haver Analytics.
All told, developments in both supply and demand contributed to unusually sharp increases in consumer prices, leading overall inflation to reach levels not seen since the early 1980s (Figure 5).
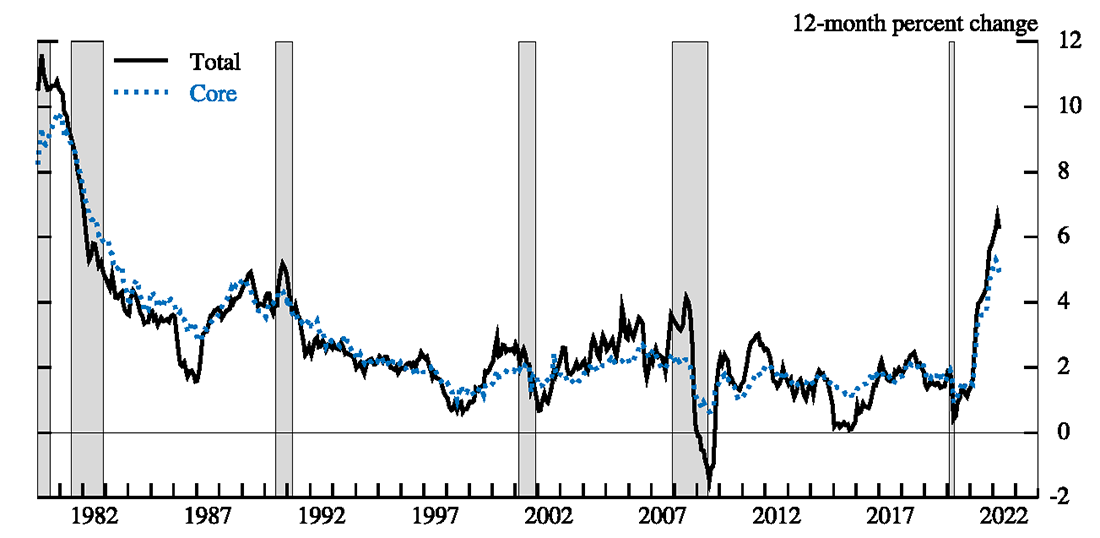
Note: The shaded bars indicate periods of business recession as defined by the National Bureau of Economic Research.
Source: Bureau of Economic Analysis via Haver Analytics.
Conceptual framework
Bottlenecks occur when constraints in the production, transportation, or distribution of goods or services lead to unusually large movements in prices and/or shortages of goods and services. This can happen when there is a sudden, sizable drop in supply capacity or when demand expands enough such that supply is unable to meet the increase in demand without large price increases. Bottlenecks would not, however, occur when typical fluctuations in demand or supply lead to relatively small movements in quantities and prices. With this in mind, we define bottlenecks in a simple static conceptual framework, in which we abstract from movements in prices and quantities that are in line with their long-term trends.
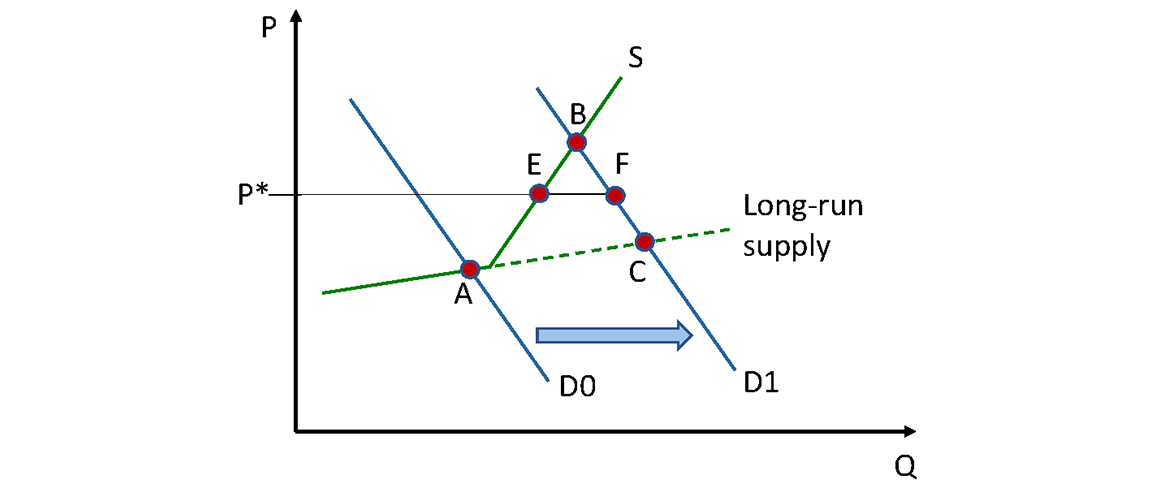
We start by supposing that, for a given industry, the realized price and quantity are pinned down by a downward sloping demand curve and an upward sloping supply curve (Figure 6, left panel). As is taught in introductory economics classes, this means that as prices rise, the quantity demanded decreases and the quantity supplied increases. To this standard framework, we introduce a kink in the short-run supply curve to capture the notion that there is a quantity above which it is very hard for producers to expand output quickly without incurring significant increases in costs—and thus prices must rise sharply as quantities are demanded beyond that point. In contrast, the long-run supply curve is flatter, illustrating that production can expand without significant increases in prices when the economy is given enough time to adjust.
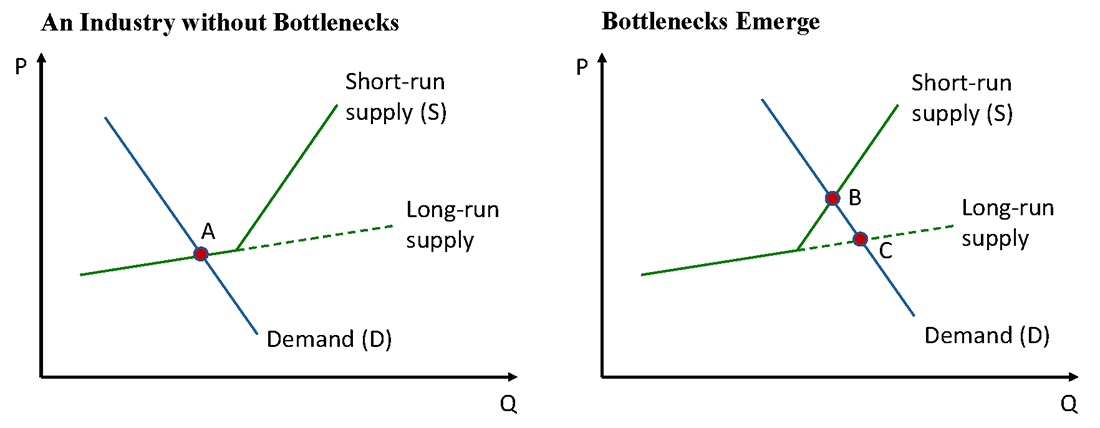
In this framework, we define a bottleneck equilibrium as the one that occurs when the demand curve intersects the short-run supply curve to the right of the kink, as in the right panel of Figure 6. The bottleneck is characterized by the difference between the realized quantity and price in the bottleneck equilibrium (point B) and the counterfactual quantity and price that would be achieved with the long-run supply curve (point C). When the demand curve intersects the supply curve to the left of the kink (as in point A in the left panel), there are no bottlenecks. However, a large and rapid inward shift in the short-run supply curve, a marked outward shift in demand, or both, will introduce bottlenecks if the shifts are large enough to result in the demand curve intersecting the short-run supply curve beyond the kink. Bottlenecks can happen at any time in individual industries (for example, if the sole supplier of a crucial part goes out of business or a producer has to close temporarily due to health concerns). However, over the past two years, they have been unusually ubiquitous and persistent across many industries.
How did such widespread bottlenecks emerge during the pandemic? In some cases, the short-run supply curve shifted dramatically inward. As shown in the left panel of Figure 7, such movement prompted prices to rise and quantities to fall. As described above, the bottleneck effect on quantities and prices is illustrated by the difference between the new equilibrium (point B) and the long-run equilibrium (point C), which, in this case, also corresponds to the original equilibrium (point A). An example of an industry facing this type of bottleneck was the meat packing industry early in the pandemic. Since conditions at meat packing plants were particularly conducive to the spread of COVID, many facilities were temporarily shut down after workers experienced COVID outbreaks, and others operated below capacity for some time due to increased social-distancing protocols. The reduced supply led to sharp price increases and lower quantities available for consumption.4
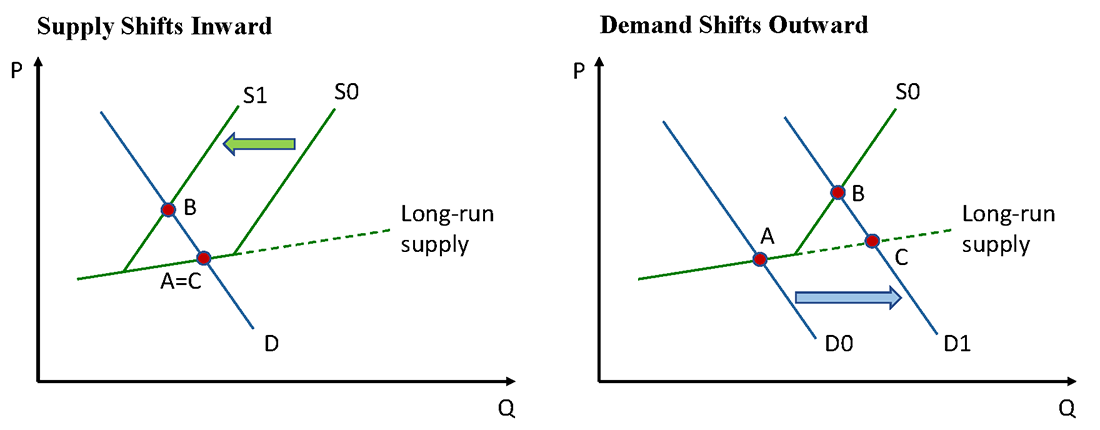
Other industries experienced a large and rapid outward shift in the demand curve, leading both quantities and prices to rise substantially (Figure 7, right panel). A key feature of this scenario is that the bottleneck is driven by the speed of this initial shift of the demand curve, since, over time, we would expect supply capacity to adjust towards the long-run curve. An example of an industry facing this type of shift in demand was the furniture industry. As people stayed home during the pandemic, there was a massive shift towards spending to adjust and improve living and working spaces.
The examples above each show shifts in only one of the curves. However, it is possible for the supply curve to shift in at the same time as the demand curve shifts out. Indeed, during the pandemic, most goods industries have experienced both an outward shift in the demand curve, as consumer preferences shifted from services to goods, as well as an inward shift of the supply curve due to shortages of labor and other inputs. The left panel of Figure 8 below shows an example in which these simultaneous shifts lead to a significant increase in prices but only a modest change in quantities. The notable upward movement in prices is a feature of all cases like this. However, depending on the relative size of the shifts in the demand and supply curves, we may observe quantities that are higher, lower, or about unchanged from the original equilibrium.
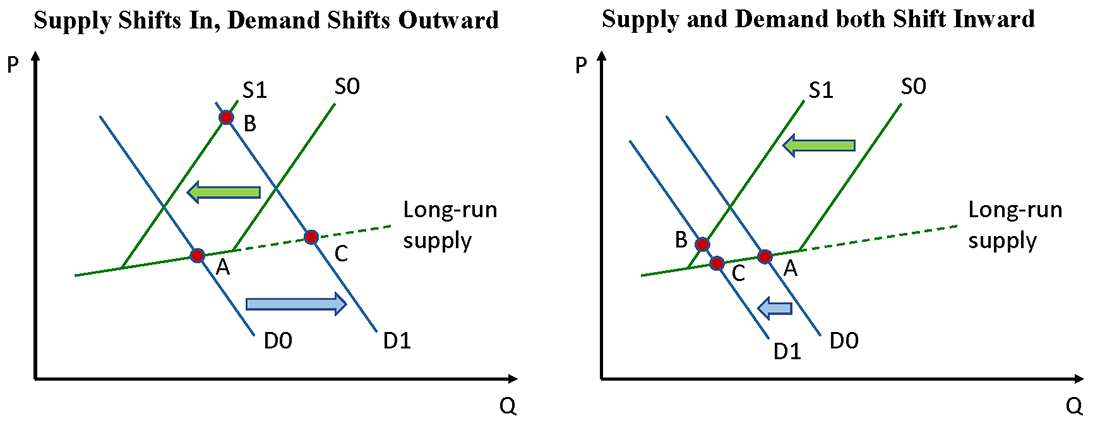
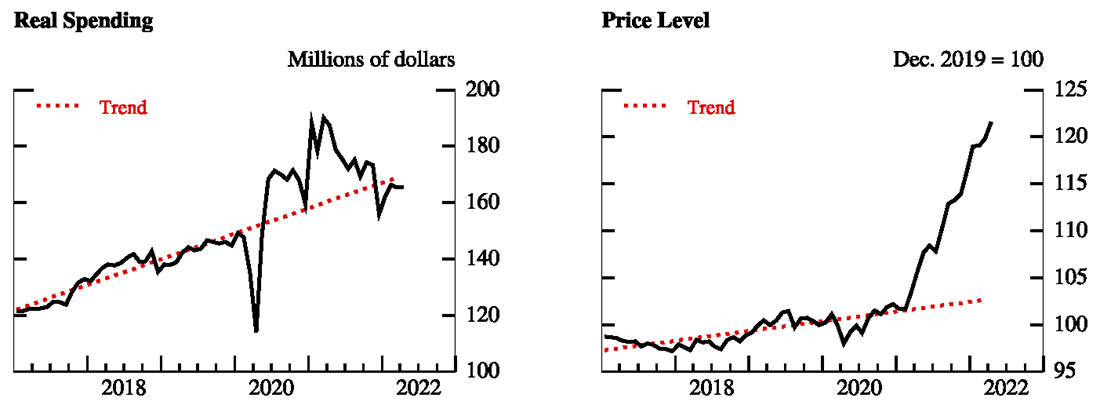
Finally, many service sectors affected by social distancing—such as restaurants, travel, and tourism—have experienced inward shifts of both the supply and demand curves (Figure 8, right panel). The shrinking of the labor force has acutely affected these labor-intensive industries, and many businesses continue to produce below capacity because of insufficient labor inputs, which has shifted in the short-run supply curve. At the same time, demand shifted inwards due to social-distancing regulations, as well as changing consumer preferences related to risk of COVID exposure. These simultaneous inward shifts in the demand and supply curves could lead to bottlenecks and an increase in prices, as shown in Figure 8. Indeed, as seen in Figure 9, the prices for leisure, travel, and hospitality have moved above the level suggested by their pre-COVID trend, even as spending in these categories has remained depressed, suggesting that this mechanism is at play.
Source: Bureau of Economic Analysis via Haver Analytics; Federal Reserve Board staff calculations.
Sluggish price adjustment and shortages
In all the above supply–demand figures, we assume that prices adjust quickly enough to ensure that markets clear in the short run, i.e., the quantity demanded is equal to the quantity supplied. In some cases, however, producers intentionally set prices below the market-clearing level to avoid being accused of price gauging or in order to maintain long-term relationships with their customers. Other producers lack the capacity to quickly change posted prices. Whatever the reason, in such scenarios, prices do not immediately increase all the way to their market-clearing level, and we instead observe shortages, as shown in Figure 10. In this figure, P* is the price set by the producer, and the shortage is represented by the difference between the quantity demanded (at point F) and supplied (at point E) at that price. Such shortages are often marked by empty store shelves or long wait times for order fulfillment.
This type of sluggish price adjustment results in two notable phenomena. First, instead of a one-time big jump in the price level from point A to point B, we observe a sequence of smaller price increases as prices slowly adjust toward the new market-clearing level. Importantly, this means we may observe prices rising well after the initial shift of the demand (and/or supply) curve causes the bottleneck to emerge. Second, declining shortages or wait times do not necessarily indicate an improvement in bottlenecks, as we have defined them, because the industry may be moving from a situation with shortages at point E to the short-run bottlenecks equilibrium at point B, while not yet resolving towards the long-run equilibrium at point C. For example, the shortages for consumer staples like rice, pasta, and flour that emerged early in the pandemic were resolved within a few months, even though their prices remained elevated. That said, there are certainly sectors in which wait times and prices have both come down substantially from their peaks—such as for steel and lumber—suggesting an improvement in bottlenecks for those industries.
Resolution of bottlenecks
So, what does all of this mean for the way in which bottlenecks might unwind in this framework? For any industry experiencing bottlenecks, at least one of the following must occur for bottlenecks to resolve: 1) the demand curve shifts inward; 2) the short-run supply curve shifts outward; or 3) the supply curve moves towards its long-run state.
Focusing on the goods sector first, current bottlenecks appear to be driven largely by elevated demand stemming from the shift in preferences away from services and towards goods and supported by fiscal stimulus and accommodative monetary policy. Effects from an inward shift in the short-run supply curve were likely smaller in this sector. The resolution of these bottlenecks is likely to come primarily from either a decrease in the demand for goods or an increase in production capacity that will allow an eventual move towards the long-run supply curve.
Looking ahead, there are plausible reasons to believe that the demand curve for goods will shift inward. First, we may begin to see a natural easing of demand for goods if consumers, particularly lower-income consumers who generally hold very little net wealth, run down the excess savings they accumulated over the pandemic.5 Second, we expect to see a policy-induced tightening of demand due to the recent steps taken by the FOMC. Third, recent declines in sentiment due to high inflation and the war in Ukraine may increase uncertainty about the future and dampen consumer's appetite for spending on discretionary goods. Finally, some of the strong sales seen of household furnishings and other durable goods might have been a "pull forward" of expenditures that would have happened later. In such instances, we would expect to see a decline in the demand for such goods, especially as consumption rebalances towards the goods and services split that existed pre-pandemic. Perhaps for this reason, furniture spending has already shown such a decline. However, prices have not yet shown signs of moderation, possibly because of continued pressure from high shipping and input costs (Figure 11).
Source: Bureau of Economic Analysis via Haver Analytics.
The left panel of Figure 12 illustrates what could happen if demand for goods were to shift inward for any of the reasons mentioned, at the same time that the short-run supply curve shifts out only slightly. As the economy moves from point B to point G, prices come down significantly, although output doesn't fall much at all. Indeed, as these stylized demand and supply figures abstract from trend growth, we may actually see an easing of price pressures even as goods output continues to grow, albeit at a rate slow enough to allow output to drift back to the level suggested by trend.
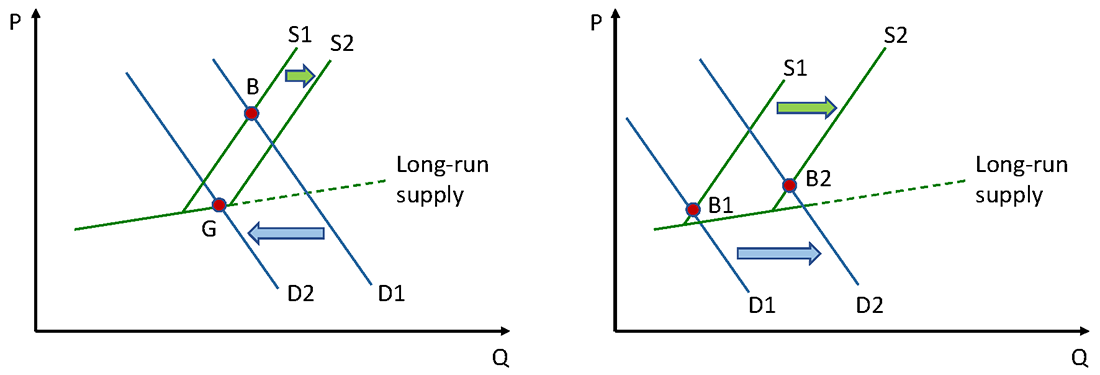
At the same time, the rebalancing of spending from goods to services—as social distancing fully eases—will serve to shift out the demand curve for the services industries, potentially exacerbating bottlenecks. It is possible, however, that a simultaneous increase in the labor force participation rate will be able to shift the supply curve out enough to absorb that increased demand. This shift could happen as childcare issues are resolved, immigration picks up, and as higher wages, lower COVID risk, and lower excess savings induce people to return to the labor force.6 In this case, the outward shifts in both the supply and demand curves may lead to only marginal price increases even as quantities rise substantially (seen by looking at the change between points B1 and B2 in Figure 12).
Finally, in some industries, we might expect the unwinding of bottlenecks to be primarily driven by the longer-term increase in capacity. For example, in the shipping industry, the port of Savannah is constructing new berths, and, over time, we may expect to see more redirection of shipments from congested West Coast ports toward Savannah and other East Coast ports that are more able to expand capacity. We are also seeing capacity expansion in industries in which a shift in preferences has led to permanently higher demand, as with semiconductors.7 For these industries, we may expect a slower adjustment, as it takes time for new entrants to enter the market or for existing firms to increase their capacity. To effectively resolve bottlenecks for the final goods consumer, this expansion must take place at all stages of the supply chain and transportation network.
To conclude, bottlenecks and inflation during the pandemic were importantly driven by the very strong and rapid expansion of demand during the initial economic recovery combined with an unprecedented re-allocation of demand across sectors and reduced supply capacity, prompted in part by sharp declines in labor force participation. Looking ahead, the resolution of bottlenecks will depend crucially on an easing of consumer goods demand, which may follow from a return to the pre-pandemic mix between goods and services. The resolution will also depend on the recovery in labor force participation, which can support short-run supply, and strategic investments that can expand longer-term production capacity. If all these developments are realized, we may see a slowdown in overall inflation even as the economy continues to grow.
That said, there are several notable risks to such a scenario. First, if we do not see much reallocation of consumption from goods to services (for example if observed shifts in consumption patterns prove more persistent than expected, or if goods demand remains elevated due to the ongoing need to replenish inventories), bottlenecks and price pressures in the goods sector will continue. Second, if the reallocation of demand towards services is so rapid that supply does not have time to adjust, we may see more bottlenecks and high inflation readings concentrated in the services categories where pent-up demand is especially strong. Third, the negative supply shocks could prove more persistent. For example, the ongoing COVID developments and shutdowns in China along with the war in Ukraine represent notable risks to goods production and distribution, implying that even if goods demand subsides, we might not see much improvement to bottlenecks and if we see any, it could come in ebbs and flows.8
Finally, a crucial question for inflation going forward is whether the recent string of widespread high inflation readings raises the prospect of inflation becoming routinely embedded in economic decisions in such spheres as job search, wage expectations, price setting, savings decisions, and consumptions choices, including the possibility of feedback between wages and prices (the so-called "wage-price spiral"). In such an event, even if bottlenecks resolve on the real side, their effects on inflation may linger.
1. We would like to thank AnneMarie Bryson for valuable research assistance. The note benefitted from comments by Logan Lewis, Paul Lengermann, Norman Morin, and Andrew Figura. The analysis and conclusions set forth are those of the authors and do not indicate concurrence by other members of the staff, the Board of Governors, or the Federal Reserve Banks. Return to text
2. Unless otherwise stated, the data series in the figures are seasonally adjusted and trend lines are estimated using the 2017 to 2019 period. Return to text
3. "The average electric vehicle has about 2,000 chips, roughly double the average number of chips in a non-electric car," U.S. Commerce Secretary Raimondo, November 29, 2021 (Chip Shortage Threatens Biden's Electric Vehicle Plans Commerce Secretary Says, https://www.scientificamerican.com/article/chip-shortage-threatens-bidens-electric-vehicle-plans-commerce-secretary-says/). "[T]he auto industry's need for chips will double in the next five years as electric cars and higher-tech vehicles come to market," Shilpan Amin, vice president of global purchasing and supply chain at General Motors, November 29, 2021 (U.S. Will Miss Electric-Vehicle Targets Without Big Investments in Semiconductor Manufacturing, Commerce Secretary Warns, https://www.washingtonpost.com/technology/2021/11/29/electric-vehicles-semiconductors-chips-act/). Return to text
4 See, for example, Another Look at Availability and Prices of Food Amid the COVID-19 Pandemic and Meatpackers Cautiously Reopen Plants Amid Coronavirus Fears, https://apnews.com/article/business-ap-top-news-us-news-sioux-falls-south-dakota-83ef6383e6a437aae20962e3c9de8855. Return to text
5. See, for example, Pandemic-Era 'Excess Savings' Are Dwindling for Many, https://www.nytimes.com/2021/12/07/business/pandemic-savings.html, and Wealth Inequality and COVID-19: Evidence from the Distributional Financial Accounts. Return to text
6. See Bauer and Edelberg, "Labor Market Exits and Entrances Are Elevated: Who Is Coming Back?" Brookings report, December 14, 2021. Return to text
7. See Power and Compound Fab Capacity Projected to Top Record 10 Million Wafers Per Month in 2023, SEMI Report, October 12, 2021. Return to text
8. Indeed, the war in Ukraine has already significantly affected energy and food commodity prices. The war also has the potential to disrupt the supply of key inputs for the production of semiconductors and electric vehicle batteries, and to more generally exacerbate already strained global supply chains and transportation networks. Return to text
Datta, Deepa D., Laura Feiveson, Ekaterina Peneva, and Gisela Rua (2022). "Bottlenecks, Shortages, and Soaring Prices in the U.S. Economy," FEDS Notes. Washington: Board of Governors of the Federal Reserve System, June 24, 2022, https://doi.org/10.17016/2380-7172.3153.
Disclaimer: FEDS Notes are articles in which Board staff offer their own views and present analysis on a range of topics in economics and finance. These articles are shorter and less technically oriented than FEDS Working Papers and IFDP papers.