FEDS Notes
June 01, 2022
Economic Restrictions during the COVID-19 Pandemic and Measures of Small Business Health
Introduction
Over the course of the COVID-19 pandemic, state and local governments have instituted a wide array of restrictions on activity, easing or tightening these restrictions as concerns about transmission evolved. These restrictions have included stay-at-home requirements, requirements serving to limit interstate travel, limits on the size of public gatherings, and recommendations about the closing of schools and workplaces.
In choosing to institute these restrictions, policymakers faced a tradeoff between limiting the spread of the virus and other goals, including maintaining the health of the local economies. Different approaches to this tradeoff led to a wide range of the restrictions across states and municipalities. For instance, during the early months of the pandemic, 42 states and territories issued mandatory stay-at-home orders. The coverage of the stay-at-home orders varied widely; across states, they applied to all individuals, or only to high-risk individuals, or only to those in certain counties. In the extremes, eight states and territories recommended that all individuals stay at home while six issued no orders at all.1
The particular choices that governments made could have large impacts on both public health and on economic prosperity. In this note, we provide evidence on the relationship between the level of these restrictions and a key component of the vitality of local economies, namely small businesses. We find that, in states with tighter restrictions, a greater proportion of small businesses generally reported levels of significantly curtailed operations than in states with looser restrictions throughout the pandemic, although this relationship weakens by the summer of 2021. In addition, states with tighter restrictions experienced a larger increase in small business loan default rates. At the same time, evidence is consistent with the Paycheck Protection Program (PPP)—in particular, the second draw loans issued as part of the second round of PPP—helping to mitigate effects of government-imposed restrictions on small business health.
Data Sources
In this note, we use data from four sources: the Oxford Stringency Index (OSI), loan-level PPP data from the Small Business Administration (SBA), the Census Bureau's Small Business Pulse Survey, and PayNet. The OSI measures state-level restrictions on activity by constructing an index of the strictness of policies that constrain people's behavior. The key inputs to the state-level indices are the degree to which schools and workplaces are closed, whether public events are required or recommended to be cancelled, the maximum size of public gatherings, whether public transportation is required or recommended to be cancelled, the strictness of stay-at-home requirements, and restrictions on movement between regions and cities.2
We use loan-level data from the SBA to measure participation in the PPP program at the state-industry level, where industry is defined using the 20 NAICS sectors.3 Our analysis relies on second draw PPP participation by small businesses that received a PPP loan in 2020. While the loan-level data has information on the identity of the borrower and whether the loan in question was a first- or second-draw loan, there is not a unique borrower identifier. To create one, we match first draw loan recipients to second draw loans on the basis of firm name, firm street address, firm city, firm county, firm state, and firm industry using a fuzzy match algorithm.4 Using the results of this match, we are able to identify which first draw loan recipients in 2020 subsequently received a second draw loan in 2021. We calculate the mean of this variable by state-industry, which we call the second-draw PPP loan rate.
Data from the Census Bureau's Small Business Pulse Survey and from PayNet, a small business credit registry, measure small business outcomes and health. In response to the pandemic, the Census Bureau has conducted weekly surveys of small businesses beginning in late April 2020.5 These surveys, which typically receive responses from 20,000-25,000 small businesses per week, collect data on the effects of the pandemic on business outcomes, expectations about the recovery, and assistance from sources such as the PPP.6 To measure small business loan performance, we use aggregated data from PayNet, which consists of data on more than 27 million loan contracts from more than 400 small business lenders.7 While Pulse data are generally available at the state level, PayNet data on default rates are available at both the state and state-industry level.
Results
Over the course of the pandemic, state-level restrictions have been strongly correlated with the level of operations of small businesses; when restrictions have been more stringent, a larger share of small businesses have had significantly reduced levels of operations. Figure 1 plots the relationship between state-level restrictions and the share of small businesses in the Pulse surveys reporting a reduction in operations of at least 50 percent relative to pre-pandemic levels at four points during the pandemic, with the level of restrictions measured as of the day prior to the start of the Pulse survey period.8
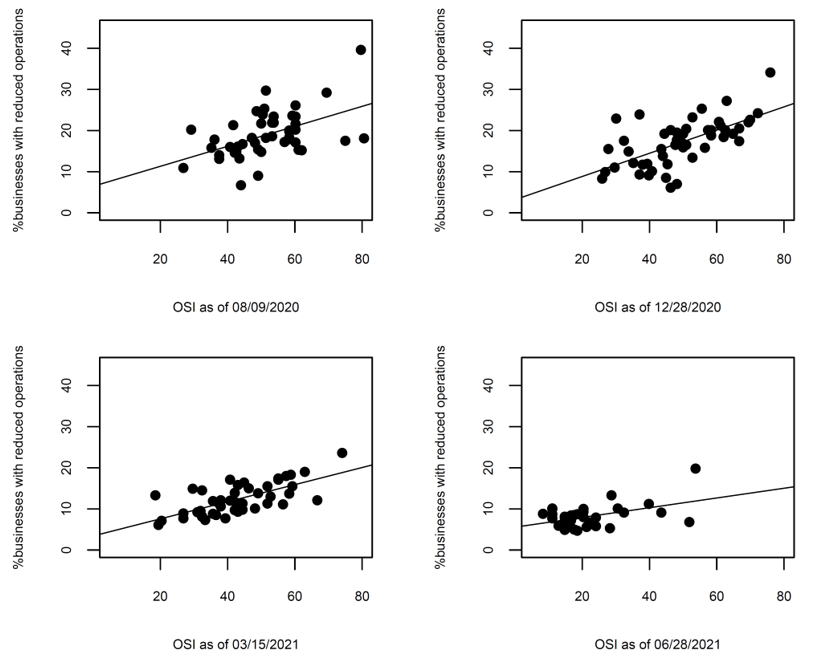
Note: The charts plot the state-level share of respondents from weekly Small Business Pulse Surveys that report that current operating capacity is below 50 percent relative to pre-pandemic levels against the state-level Oxford Stringency Index at four points during the pandemic. For each of the four charts, Pulse survey data collected in the seven days after the date of the OSI measurement is used.
Source: Census Bureau, Oxford University.
As of mid-August 2020, depicted in the top left panel, there was a strong positive relationship between the level of restrictions and the share of businesses with significantly reduced levels of operations. By early January 2021, depicted in the top right panel, this correlation had strengthened as the number of positive cases nationally grew; that is, higher levels of restrictions in January 2021 were associated with larger shares of businesses with significantly reduced operations than at similar levels in August 2020. This very strong correlation persisted into March 2021, as shown in the bottom left panel.
However, by June 2021, two important changes in this relationship occurred. First, restrictions generally eased across the country; whereas the OSI ranged from 30 to 70 in early January 2021 and from 20 to 60 in March 2021, by June 2021, the OSI was below 25 for most states. Second, the relationship between the level of restrictions and the share of businesses with significantly reduced operations weakened. While states with tighter restrictions in June 2021 did have a higher share of businesses with reduced operations than states with looser restrictions, this relationship is not statistically significant and is also smaller in magnitude. Therefore, it appears that the relationship between economic restrictions and the level at which small businesses operated was largely a temporary one, observed during the second half of 2020 and early 2021 before dissipating by the summer of 2021.
While the relationship between economic restrictions and operating performance of businesses appears to have been temporary, there are important long-lasting effects. In particular, small businesses in states with tighter restrictions experienced significantly larger increases in the rate at which they defaulted on their loans. As shown in Figure 2, there is a positive and significant relationship between the level of restrictions in a state and the change in default rates relative to pre-pandemic levels. This is most apparent in the left panel, where restrictions are measured as of December 28, 2020; states with tighter restrictions experienced a significantly larger increase in small business loan default rates than other states. The relationship is weaker in the right panel, where economic restrictions are measured as of June 28, 2021, due to the easing of restrictions in the first half of 2021, particularly in states with stricter policies earlier in the pandemic. However, even though conditions improved for small businesses in 2021, the higher small business loan default rates in states with tighter restrictions may have long-lasting implications for the ability of small businesses to obtain credit in the future at reasonable rates.
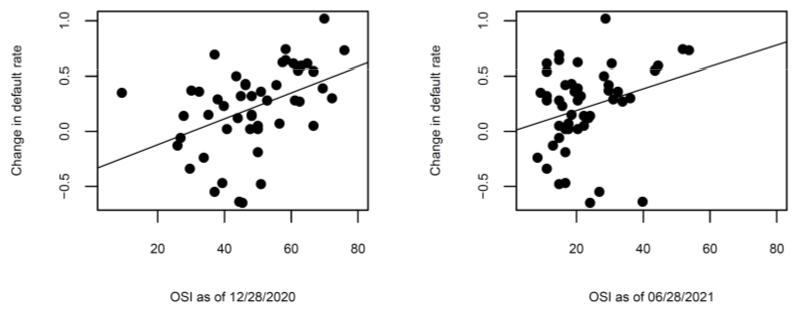
Note: The charts plot the state-level change in small business 12-month trailing default rates between February 2020 and July 2021 against the state-level Oxford Stringency Index in December 2020 and June 2021.
Source: PayNet, Oxford University.
Simple regression analysis shows that PPP, particularly the rate of second-draw loans made in the first half of 2021, is highly correlated with improved loan performance in 2021, suggesting that PPP may help explain part of the resilience of small businesses. The Economic Aid Act, passed in December 2020, allowed small businesses that had experienced at least a 25 percent decline in quarterly revenues in 2020 relative to 2019 to receive a second PPP loan. Given that small businesses in states with tighter restrictions were more likely to report significantly decreased operations, a greater share of small businesses in those states were more likely to qualify for a second PPP loan.
In column 1 of Table 1, we present estimates from a regression of the state-industry level share of PPP loan recipients in 2020 that subsequently received a second draw PPP loan in 2021 against the OSI as of December 28, 2020.9 We find a positive and significant relationship between the level of restrictions in a state and the share of small businesses in that state that received a second draw loan. In other words, in states with tighter restrictions, a higher share of small businesses received a second draw PPP loan. The magnitude of the estimate is economically meaningful; the estimate implies that a small business with a first draw loan in 2020 in the tenth most restrictive state was approximately 8 percent more likely to apply for a second draw loan than a similar business in the tenth least restrictive state.
Table 1: Economic Restrictions, Second Draw PPP Loans, and Default Rates
| Dependent Variable: | (1) | (2) | (3) | (4) |
|---|---|---|---|---|
| Second Draw PPP Loan Rate | Change in Default Rate, December 2020 to July 2021 | |||
| Oxford Stringency Index | 0.001*** | 0.034*** | 0.029** | n/a |
| (0.000) | (0.011) | (0.011) | ||
| Second Draw PPP Loan Rate | n/a | 3.764*** | 4.870*** | 4.874*** |
| (1.392) | (1.523) | (1.296) | ||
| OSI x Second Draw PPP Loan Rate | n/a | -0.096*** | -0.088*** | -0.086*** |
| (0.028) | (0.029) | (0.024) | ||
| Industry Fixed Effects | yes | no | yes | yes |
| State Fixed Effects | no | no | no | yes |
| Observations | 900 | 900 | 900 | 900 |
| R-squared | 0.59 | 0.04 | 0.23 | 0.33 |
Note: This table presents regression estimates based on state-sector level data. The dependent variable in column 1 is the share of PPP loans made in 2020 with a second draw PPP loan in 2021. The dependent variable in columns 2 through 4 is the change in the 12-month trailing default rate on small business loans between December 2020 and July 2021, as measured by PayNet. The key independent variables are the Oxford Stringency Index (OSI), a state-level measure of restrictions on economic activity, as of December 28, 2020, and the share of PPP loans made in 2020 with a second draw PPP loan in 2021. Robust standard errors are in parentheses. *, **, and *** denote statistical significance at the 10%, 5%, and 1% levels, respectively.
The estimates presented in columns 2 through 4 of Table 1 present the relationship between changes in default rates and the restrictiveness of the state. The difference between columns 2 and 3 is that we include industry fixed effects in column 3 to account for the fact that certain industries, such as the Food and Accommodation Services sector, were more adversely affected by the pandemic than others. Then in column 4, we include state fixed effects to account for the fact that certain states may have been more affected by the pandemic, independent of the level of economic restrictions, than other states.
There are several interesting findings to highlight. First, the results are broadly consistent with the notion that the level of economic restrictions negatively affected small businesses during the pandemic. The estimate on the OSI variable is positive and significant in columns 2 and 3. In other words, small business default rates fell less in the first seven months in 2021 in states with tighter restrictions than in states with looser restrictions on activity.
In addition, the estimate on the second draw PPP loan rate variable is also positive and significant. Again, this is consistent with tighter economic restrictions leading to greater revenue losses in 2020, which in turn results in a larger fraction of PPP loan recipients qualifying for second draw PPP loans in 2021. Thus, it appears that both the OSI and the second draw PPP loan rate are reflective of worsening loan performance for small businesses in 2021, even if the precise causal channel driving these relationships is unclear.
In contrast, the interaction term enters negatively and significantly. In other words, for a given level of restrictions, states with relatively high rate of second draw PPP loans have seen stronger improvement in default rates than states with lower application rates. To be more concrete, consider the tenth most restrictive states based on the OSI as of December 28, 2020. The estimates in column 3 suggest that increasing the rate of second draw PPP loans from the 25th percentile of the distribution to the 75th percentile is associated with a 10 percent larger decline in small business default rates between December 2020 and July 2021. Therefore, the evidence is consistent with second draw PPP loan participation partially offsetting the negative effects of economic restrictions on default rates.
Discussion
Small businesses in states with tighter restrictions on economic activity have been more likely to report diminished levels of operations and experience worse small business loan performance over the course of the pandemic. However, our analysis suggests that PPP loans, and second-draw PPP loans in particular, may have helped offset some of the negative effects of economic restrictions.
An important caveat to this analysis is that the relationships that we document are only correlations. For instance, geographical variation in the level of community spread of the virus may lead governments to tighten restrictions and businesses to limit operations. Likewise, the stigma associated with a loan default may be less in areas with tighter restrictions, leading to greater rates of strategic defaults by small businesses in those areas. Additionally, if states' pandemic responses, such as vaccination programs or programs providing economic support for businesses and individuals vary in ways that reflect other relevant economic policies rather than economic restrictions and PPP loan application rates per se, then our results may be confounded with differences from those policy sources. While exploring these alternative explanations are beyond the scope of this note, we intend to explore these alternative explanations in future research.
References
Buffington, Catherine, Carrie Dennis, Emin Dinlersoz, Lucia Foster, and Shawn Klimek (2020). "Measuring the Effect of COVID-19 on U.S. Small Businesses: The Small Business Pulse Survey," Center for Economic Studies Working Paper, CES 20-16 May, 2020.
Clark, Andrew. and Thomas Ware (2021). [online] Thomsonreuters.com. Available at: https://www.thomsonreuters.com/content/dam/openweb/documents/pdf/tr-com-financial/white-paper/looking-into-the-future-paynet-sbli-whitepaper.pdf [Accessed 15 December 2021].
Hallas, Laura, Ariq Hatibie, Rachelle Koch, Saptarshi Majumdar, Monika Pyarali, Andrew Wood, and Thomas Hale (2021). "Variation in Us States' Responses to Covid-19," BSG Working Paper Series. Oxford: Blavatnik School of Government, University of Oxford. BSG-WP-2020/034 Version 3.0 (May 2021).
Moreland, A., Herlihy, C., Tynan, M., Sunshine, G., McCord, R., Hilton, C., Poovey, J., Werner, A., Jones, C., Fulmer, E., Gundlapalli, A., Strosnider, H., Potvien, A., García, M., Honeycutt, S., Baldwin, G., Clodfelter, C., Howard-Williams, M., Jeong, G., Landsman, L., Shelburne, J., Brown, A., Cramer, R., Gilchrist, S., Hulkower, R., Limeres, A. and Popoola, A. (2020). Timing of State and Territorial COVID-19 Stay-at-Home Orders and Changes in Population Movement — United States, March 1–May 31, 2020. MMWR. Morbidity and Mortality Weekly Report, 69(35), pp.1198-1203.
Small Business Administration (2021). PPP FOIA - U.S. Small Business Administration (SBA) | Open Data. [online] Available at: https://data.sba.gov/dataset/ppp-foia [Accessed 15 December 2021].
US Census Bureau (2021). Small Business Pulse Survey Data. [online] Portal.census.gov. Available at: https://portal.census.gov/pulse/data/ [Accessed 15 December 2021].
* We would like to thank Balen Essak for valuable research assistance. All errors are our own. The analysis and conclusions set forth are those of the author and do not indicate concurrence by other members of the staff, by the Board of Governors or by the Federal Reserve Banks. Dore can be reached at 202-452-2887; [email protected]. Mach can be reached at 202-452-3906; [email protected]. Return to text
1. For more detail on stay-at-home orders and mobility, see Moreland et al. (2020). Return to text
2. For more information on the OSI for U.S. states, see Hallas et al. (2021). Return to text
3. These data are available for download at PPP FOIA - Dataset - U.S. Small Business Administration (SBA) | Open Data from Small Business Administration (2021). Return to text
4. Using this algorithm, we are able to match 95.7 percent of second draw loan recipients to a first draw loan. Return to text
5. The survey underwent six different phases, with small breaks between phases and slight changes in the questionnaire each phase. Return to text
6. For more information about the methodology of the Pulse surveys, see Buffington et al. (2020). Aggregate data are available at https://portal.census.gov/pulse/data/ from the US Census Bureau (2021). Return to text
7. For more information on the construction of the PayNet indices, see Clark and Ware (2021). Return to text
8. The precise wording of this question is: "How would you describe this business's current operating capacity relative to its operating capacity prior to the Coronavirus pandemic?" where operating capacity is defined as "the maximum amount of activity this business could conduct under realistic operating conditions." For more details, the questionnaire is available at https://www2.census.gov/data/experimental-data-products/small-business-pulse-survey/small-business-pulse-survey-questionnaire.pdf. Return to text
9. In Table 1, we use the OSI as of December 28, 2020 to measure the prevailing level of restrictions in a given state. The choice of this date is motivated by the fact that the second round of PPP began on January 8, 2021 as well as the fact that restrictions were tightest nationally over the winter of 2020-2021. Our results are generally robust to the use of the OSI on alternative dates. Return to text
Dore, Tim, and Traci Mach (2022). "Economic Restrictions during the COVID-19 Pandemic and Measures of Small Business Health," FEDS Notes. Washington: Board of Governors of the Federal Reserve System, June 01, 2022, https://doi.org/10.17016/2380-7172.3051.
Disclaimer: FEDS Notes are articles in which Board staff offer their own views and present analysis on a range of topics in economics and finance. These articles are shorter and less technically oriented than FEDS Working Papers and IFDP papers.