FEDS Notes
October 11, 2022
Non-bank financial institutions and the slope of the yield curve1
Sebastian Infante, Phillip Monin, Lubomir Petrasek, and Mary Tian
In this note, we examine how changes in the yield curve slope affect the provision of credit and intermediation services by non-bank financial institutions (NBFIs), including broker-dealers and hedge funds. Although these NBFIs typically do not lend directly to the non-financial sector, they indirectly support the flow of credit by investing in debt securities and extending financing to investors who own such securities.2 Dealers also support market functioning of these securities markets by standing ready to buy and sell them from clients and providing financing for these trades. Like banks, these NBFIs engage in maturity transformation, primarily by investing in or warehousing longer-term securities while financing their positions in short-term funding markets. A flattening of the yield curve might therefore affect their profitability and their willingness and ability to provide credit and support smooth market functioning. However, we find that large dealers' total exposure to different parts of the yield curve is small, likely reflecting the effect of their hedging activity. Moreover, we do not find strong evidence that NBFIs' credit provision, trading activities, or trading profitability are meaningfully affected by changes in the slope of the yield curve or yield curve inversions.
Broker-dealers and hedge funds engage in maturity transformation.
As shown in Figure 1, the weighted average maturity of dealers' net securities positions is currently about 2 years. These positions are typically supported by repo and reverse repo to finance and source securities, respectively. The weighted average maturity of dealers' net repo financing is typically close to zero, consistent with the idea that a large fraction of dealers' inventories are supported by overnight borrowing and lending.3 The picture is similar for hedge funds: The weighted duration of hedge funds' net Treasury positions is 4 years while the average maturity of their financing is 40 days.4 This suggests that changes in the slope of the yield curve, in particular the difference between longer-term Treasury yields and short-term financing rates, if unhedged, could have significant effects on the profitability of NBFIs' business models and affect their willingness and ability to intermediate credit.
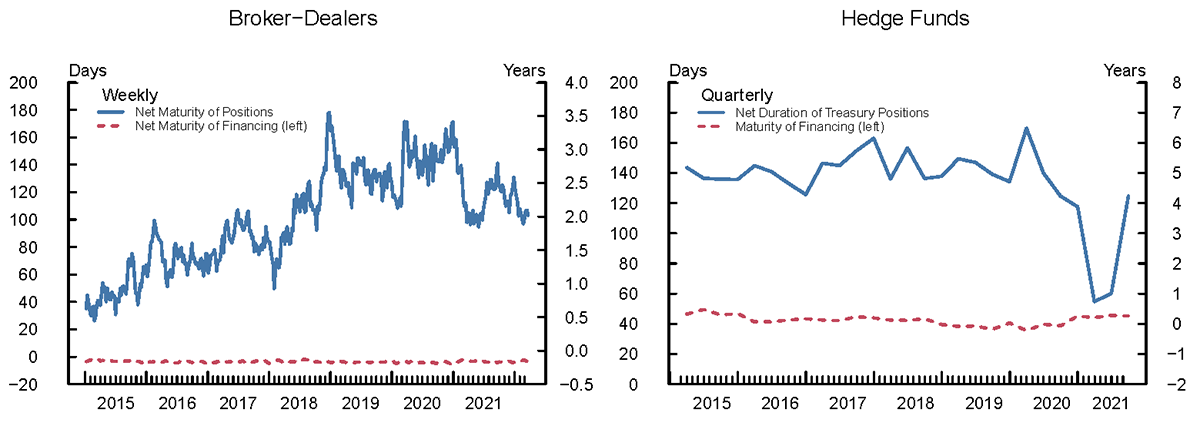
Left panel
Note: Chart shows the maturity of net Treasury and corporate security positions and Treasury and corporate security repo borrowing calculated using a weighted average over the midpoint of maturity buckets.
Source: Board of Governors of the Federal Reserve System. Government Securities Dealers Reports (FR 2004A, FR 2004C)
Right panel
Note: Chart plots estimated duration of net Treasury positions of hedge funds using methods developed in Kruttli, Monin, Petrasek, and Watugala (2021) and Banegas, Monin, and Petrasek (2021). Chart also plots financing maturity of hedge funds with Treasury exposure.
Source: Securities and Exchange Commission. Private Fund Reporting (Form PF)
Although they engage in maturity transformation, the total net exposure of large dealers' trading portfolios to the yield curve is small, likely reflecting hedging activities.
Data on the trading exposures of bank holding companies with large dealer operations, the left panel in Figure 2, show that over the past several years dealers' net exposures to longer maturity interest rates (so-called DV01s5) have been close to zero on average, suggesting that dealers likely use derivatives to actively hedge the risks associated with maturity transformation. Indeed, data from the CFTC, the right panel in Figure 2, indicate that in recent years dealers held sizeable net short positions in longer-term Treasury futures, consistent with dealers using Treasury futures to offset the long duration exposures in their securities portfolios.
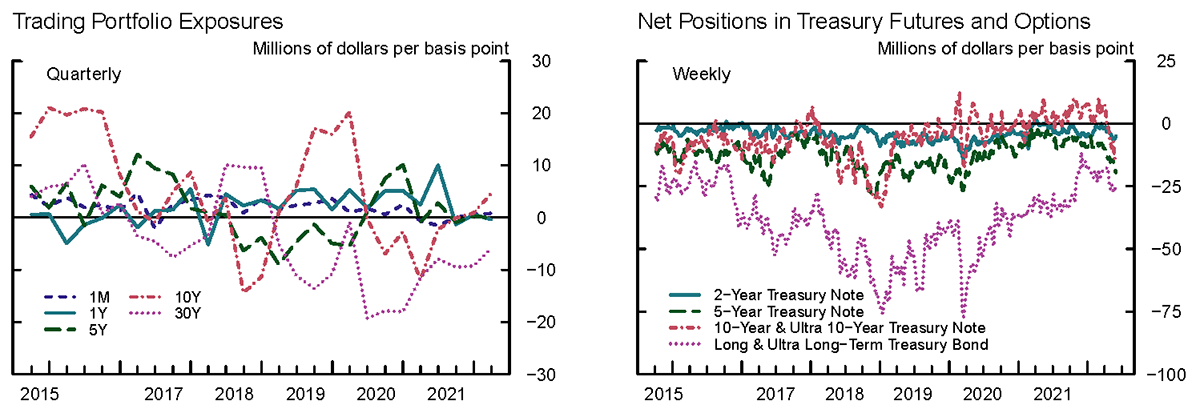
Left panel
Note: Chart shows the impact in millions of dollars of a −1 basis point change in the yield of Treasury securities of a given maturity. Includes data for 12 primary dealers.
Source: Board of Governors of the Federal Reserve System, Capital Assessments and Stress Testing (FR Y−14 Schedule F.6)
Right panel
Note: Net position is estimated by multiplying the net notional value by its approximate interest rate sensitivity.
Source: Commodity Futures Trading Commission. Traders in Financial Futures
We do not find a statistically significant relationship between the slope of the yield curve and brokers-dealers' profitability.
We measure profitability as trading revenue scaled by total assets and regress it on two alternative measures of the yield curve slope – either the 10-year minus 2-year Treasury spread (10y2y) or the 10-year minus 3-month Treasury spread (10y3m). We examine both aggregate trading revenue as well as revenue by asset class (rates, foreign exchange, equity, commodity, and credit). Quarterly data on BHC trading revenue and total assets is from FR-Y9C, and we concentrate on BHCs with more than $3 billion in total assets. In general, the regressions do not show a consistent or statistically significant relationship between trading profitability and yield curve slope (Table 1). Furthermore, we do not find a statistically significant difference in trading revenue during periods of flattening or the inversion of the yield curve. While broker-dealers engage in maturity transformation, these empirical findings suggest that for trading purposes, the slope of the yield curve does not appear to be a significant factor.
Table 1. Sensitivity of Profitability to the Yield Curve
| Aggregate | Rates | Foreign Exchange | Equity | Commodity | Credit | |
|---|---|---|---|---|---|---|
| 10y3m spread | -0.001 | -0.004 | 0.001 | -0.005* | 0.001 | 0.011 |
| 10y2y spread | -0.008 | -0.008 | 0.001 | -0.007** | 0.002** | 0.006 |
Note: Each entry in the table reports a coefficient from separate regressions of profitability on the slope of the yield curve. The sample period is from 2000Q1 to 2021Q4, with 88 quarterly observations. Significance is based on Newey-West standard errors with 1 lag. *, **, and *** denote significance at the 10%, 5%, and 1% levels, respectively.
Our analysis of hedge fund returns also shows that hedge funds are not significantly exposed to changes in the yield curve slope.
Specifically, there is no significant relationship between changes in the 10y3m Treasury spread (Table 2) or the 10y2y spread and aggregate hedge fund returns or returns on major hedge fund strategies.6 Interestingly, hedge fund returns are significantly higher when the yield curve is inverted, especially for relative-value hedge funds, suggesting that these periods are associated with profitable trading and arbitrage opportunities.
Table 2. Sensitivity of Hedge Fund Returns to the Yield Curve
| All Hedge Funds | Equity Long/Short | Global Macro | Fixed Income RV | |
|---|---|---|---|---|
| Δ(10yr-3m) | 0.04 | 0.26 | -0.79* | 0.27 |
| 10yr-3m inversion | 0.52*** | 0.46** | 0.22 | 0.70*** |
| 3m yield change | 1.11* | 1.94** | -1.47 | 2.17** |
| S&P500 return | 0.27*** | 0.40*** | 0.08** | 0.25*** |
| VIX | -0.02 | -0.01 | -0.02 | -0.01 |
| constant | 0.19 | 0.03 | 0.48 | 0.11 |
| R-squared | 0.64 | 0.7 | 0.06 | 0.45 |
Note: The sample period is from January 2003 until April 2022, with 229 monthly observations. The ‘inversion’ dummy indicates periods when the 10y3m yield difference is negative. The results are qualitatively similar if we use the 10y2y spread instead. Significance is based on Newey-West standard errors with 3 lags. *, **, and *** denote significance at the 10%, 5%, and 1% levels, respectively.
Some prior research finds that changes in the slope of the yield curve affect dealers' willingness to intermediate.
Adrian and Shin (2008, 2009) find that a steeper yield curve, as measured by the 10y3m Treasury yield spread, is conducive to faster growth in dealers' total secured lending and their balance sheets prior to 2008. The balance sheet growth of broker-dealers, in turn, forecasts real economic activity, especially those components that are sensitive to the supply of credit. Adrian, Estrella, and Shin (2019) argue that the forecasting power of the term spread for real economic activity derives from the balance sheet management of financial intermediaries, including broker-dealers.
However, our analysis extending that line of research does not find a robust relationship between the term structure of interest rates and dealers' activities in Treasury markets or the size of dealer balance sheets.
Extending Adrian and Shin (2008), we explore the sensitivity of quarterly changes in dealers' Treasury cash and repo positions to changes in the 10y2y and 10y3m Treasury spreads, controlling for other financial variables. As shown in Table 3, we do not find a statistically significant relationship between changes in Treasury long/short positions, or total Treasury financing by dealers (securities in), and changes in the slope of the yield curve.7 Taking a broader perspective beyond Treasury markets, we do find that total dealer asset growth appear to have a positive and mildly statistically significant sensitivity to changes in the 10y2y spread (Table 4), we do not find such a relationship for the 10y3m spread.8
Table 3. Sensitivity of Dealer Treasury Financing and Positions to the Yield Curve
| Without UST Supply Controls | With UST Supply Controls | |||||||
|---|---|---|---|---|---|---|---|---|
| $$\Delta log(SecIn_t)$$ | $$\Delta log(Long_t)$$ | $$\Delta log(SecIn_t)$$ | $$\Delta log(Long_t)$$ | |||||
| $$ \Delta (y^{10yr} - y^{2yr})_t $$ | -0.010 | -0.003 | -0.028 | -0.004 | ||||
| (0.020) | (0.033) | (0.017) | (0.042) | |||||
| $$ (y^{10yr} - y^{2yr})_{t-13} $$ | 0.017 | 0.009 | -0.009 | 0.012 | ||||
| (0.019) | (0.033) | (0.017) | (0.045) | |||||
| $$ \Delta (y^{10yr} - y^{3mo})_t $$ | 0.001 | 0.006 | -0.010 | 0.009 | ||||
| (0.013) | (0.028) | (0.014) | (0.035) | |||||
| $$ (y^{10yr} - y^{3mo})_{t-13} $$ | 0.027 | 0.018 | 0.007 | 0.009 | ||||
| (0.017) | (0.033) | (0.013) | (0.039) | |||||
| $$ \Delta \log(TbillOut_t) $$ | -0.073 | -0.068 | 0.150 | 0.138 | ||||
| (0.058) | (0.062) | (0.146) | (0.129) | |||||
| $$ \Delta \log(USTOut_t) $$ | 0.969*** | 0.855** | 1.809*** | 1.812** | ||||
| (0.315) | (0.336) | (0.669) | (0.720) | |||||
| $$ \Delta \log(SOMA_t) $$ | 0.025 | 0.026 | -0.078 | -0.080 | ||||
| (0.062) | (0.067) | (0.099) | (0.096) | |||||
| Adj Rsq | .185 | .19 | .173 | .174 | .288 | .279 | .239 | .239 |
| Obs | 1030 | 1030 | 1030 | 1030 | 880 | 880 | 880 | 880 |
Note: Table contains the result from regressing 13-week log changes of Treasury financing (securities in) and Treasury long positions reported in the FR 2004 to 13-week change in the 10y2y and 10y3m slope of the U.S. Treasury yield curve. The regressions control for the 13- week change and 13-week lagged level of the federal funds rate, S&P 500 Index, VIX Index, and the credit spread of Baa Corporate bonds over 10-year Treasury and lagged 13-week changes of the dependent variable (not shown). The last four columns also control for the 13-week log changes in U.S. Treasury outstanding and SOMA holdings of U.S. Treasury securities. The sample runs from July 2001 to March 2021, at a weekly frequency. The dependent variable is winsorized at the 1% and 99%. Newey-West standard errors with 26 lags are reported. *, **, and *** denote significance at the 10%, 5%, and 1% levels, respectively.
Table 4. Sensitivity of Total Dealer Assets to the Yield Curve
| Without UST Supply Controls | With UST Supply Controls | |||
|---|---|---|---|---|
| $$ \Delta (y^{10yr} - y^{2yr})_t $$ | 0.031* | 0.049* | ||
| (0.017) | (0.026) | |||
| $$ (y^{10yr} - y^{2yr})_{t-1} $$ | 0.005 | 0.009 | ||
| (0.016) | (0.018) | |||
| $$ \Delta (y^{10yr} - y^{3mo})_t $$ | 0.019 | 0.019 | ||
| (0.014) | (0.019) | |||
| $$ (y^{10yr} - y^{3mo})_{t-1} $$ | -0.016 | -0.024 | ||
| (0.013) | (0.019) | |||
| $$ \Delta \log(T-billOut_t) $$ | -0.043 | -0.036 | ||
| (0.047) | (0.043) | |||
| $$ \Delta \log(USTOut_t) $$ | 0.306 | 0.534 | ||
| (0.408) | (0.373) | |||
| $$ \Delta \log(SOMA_t) $$ | 0.085 | 0.062 | ||
| (0.084) | (0.092) | |||
| Adj Rsq | .383 | .401 | .57 | .572 |
| Obs | 106 | 106 | 69 | 69 |
Note: Table contains the result from regressing one quarter log changes of total assets held by dealers reported in the flow of funds to the on quarterly changes in the 10y2y and 10y3m slope of the U.S. Treasury yield curve. The regressions control for the one quarter change and one quarter lagged level of the federal funds rate, S&P 500 Index, VIX Index, and the credit spread of Baa Corporate bonds over 10-year Treasury and lagged one quarter changes of the dependent variable (not shown). The last two columns also control for the one quarter change in U.S. Treasury outstanding and SOMA holdings of U.S. Treasury securities. The sample runs from March 1995 to March 2021, at a quarterly frequency. Newey-West standard errors with 1 lag are reported. *, **, and *** denote significance at the 10%, 5%, and 1% levels, respectively.
Recent survey evidence also suggests that the terms provided by dealers on a broad range of securities financing transactions are not significantly affected by the slope of the yield curve.
In response to a set of questions about the effect of hypothetical interest rate scenarios on dealer financing in the March 2022 Senior Credit Officer Opinion Survey (SCOOS), dealers indicated that their price and non-price terms would tighten if short-term interest rates rose, regardless of changes in longer-term interest rates. Nonetheless, the survey indicated that client demand for securities financing may be lower if the yield curve flattens.
References
Adrian, Tobias, Arturo Estrella, and Hyun Song Shin (2019). "Risk-Taking Channel of Monetary Policy," Financial Management 48(3):725–738.
Adrian, Tobias, and Hyun Song Shin (2008). "Financial Intermediaries, Financial Stability, and Monetary Policy," FRBNY Staff Report no. 346.
Adrian, Tobias, and Hyun Song Shin (2009). "Money, Liquidity, and Monetary Policy," American Economic Review: Papers and Proceedings 99(2): 600-605.
Banegas, Ayelen, Phillip J. Monin, and Lubomir Petrasek (2021). "Sizing hedge funds' Treasury market activities and holdings," FEDS Notes. Washington: Board of Governors of the Federal Reserve System, October 6, 2021, https://doi.org/10.17016/2380-7172.2979.
Senior Credit Officer Opinion Survey, March 2022, https://www.federalreserve.gov/data/scoos/scoos-202203.htm.
Kruttli, Mathias S., Phillip J. Monin, Lubomir Petrasek, Sumudu W. Watugala (2021). "Hedge Fund Treasury Trading and Funding Fragility: Evidence from the COVID-19 Crisis." Finance and Economics Discussion Series 2021-038. Washington: Board of Governors of the Federal Reserve System, June. https://doi.org/10.17016/FEDS.2021.038
1. Sebastian Infante, Phillip Monin, Lubomir Petrasek, Mary Tian. We thank Paul Cochran, Benjamin Iorio, and Karl Patram for their research assistance. Return to text
2. Although other NBFIs such as mutual funds and insurance companies also engage in maturity transformation, they do not rely on short-term borrowing to finance large portions of their securities portfolio. Here we focus on institutions that are more likely to be directly affected by the yield curve because of mismatches between the maturities of their assets and those of their short-term liabilities. Return to text
3. The negative sign of dealers' net Treasury repo maturity indicates that dealers' repo borrowing has a slightly shorter term than their lending through reverse repo, which is indicative of dealer maturity transformation through repo. Return to text
4. The sample of hedge funds consists of all funds with long or short U.S. Treasury exposure. Unlike for broker-dealers, net financing maturity for hedge funds' positions is not available. Instead, we use the maturity of their financing. Return to text
5. DV01 is the dollar value effect of a one-basis point decrease in yields of a given maturity on portfolio value. Thus, positive DV01s are indicative of a net long duration exposure. Return to text
6. Hedge fund returns are measured by the HFRX Global Hedge Fund Index and the corresponding sub-indices for the equity hedge, equity market neutral, global macro, and relative-value fixed income strategies from January 2003 to February 2022. Return to text
7. We use weekly data from FR 2004 between July 2001 and March 2022 to calculate 13-week changes with overlapping data at aggregate primary dealer-level. We correct for serial autocorrelation by using Newey-West errors. Return to text
8. We use quarterly data from the flow of funds between March 1995 to March 2021 to calculate quarterly changes. We correct for serial autocorrelation by using Newey-West errors. Results can be found in Table 3. Return to text
Infante, Sebastian, Phillip Monin, Lubomir Petrasek, and Mary Tian (2022). "Non-bank financial institutions and the slope of the yield curve," FEDS Notes. Washington: Board of Governors of the Federal Reserve System, October, 11, https://doi.org/10.17016/2380-7172.3185.
Disclaimer: FEDS Notes are articles in which Board staff offer their own views and present analysis on a range of topics in economics and finance. These articles are shorter and less technically oriented than FEDS Working Papers and IFDP papers.